


Jean-Luc Ichard/iStock Editorial via Getty Images
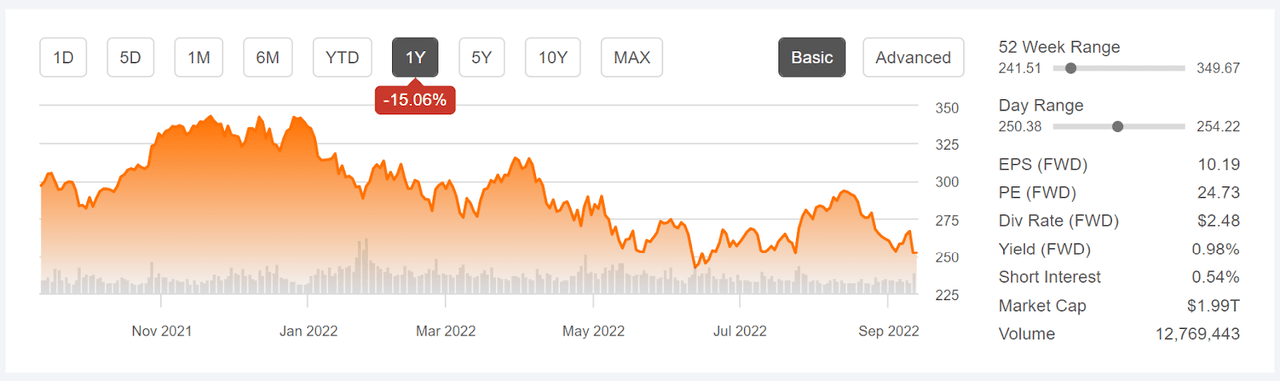
Over the past 12 months, Microsoft (NASDAQ:NASDAQ:MSFT) has returned a total of -14.3%, worse than the total return for the S&P 500, -10.7%, but better than the total return for the NASDAQ 100 (QQQ), at -21.5%. On September 13th, after inflation came in higher than expected, MSFT dropped by 5.5%, the worst day for MSFT since September of 2020.
Seeking Alpha
12-Month price history and basic statistics for MSFT above.
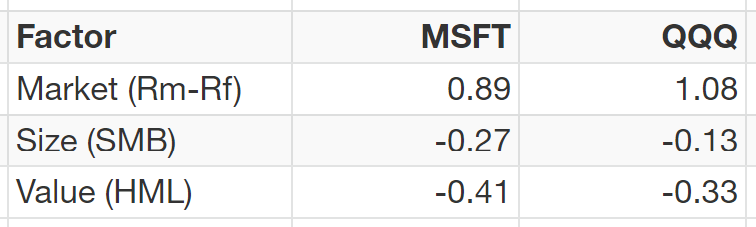
It is not surprising that MSFT has done better than QQQ, or that both have performed worse than the S&P 500, over the past year. Both MSFT and QQQ have a growth tilt (negative loadings on the Fama-French value factor), and growth has substantially underperformed value over the past 12 months. In addition, QQQ has a larger beta in the 3-factor model than MSFT, so we would expect QQQ to perform worse in a market decline.
Portfolio Visualizer
3-Factor Fama-French loadings using 36 months of history above.
To get a sense of just how much worse growth has performed vs. value over the past year, the iShares S&P 500 Growth ETF (IVW) has returned a total of -17.4% vs. -3.7% for the iShares S&P 500 Value ETF (IVE).
With rising interest rates, we expect value to have an edge of growth because higher rates correspond to higher discount factors applied to future earnings. Growth stocks valuations rely more on earnings that are predicted to occur further into the future, so the effects of compounding disproportionately impact the net present value of growth stocks vs. value stocks. Rising interest rates reduce the net present value of growth stocks more than value stocks.
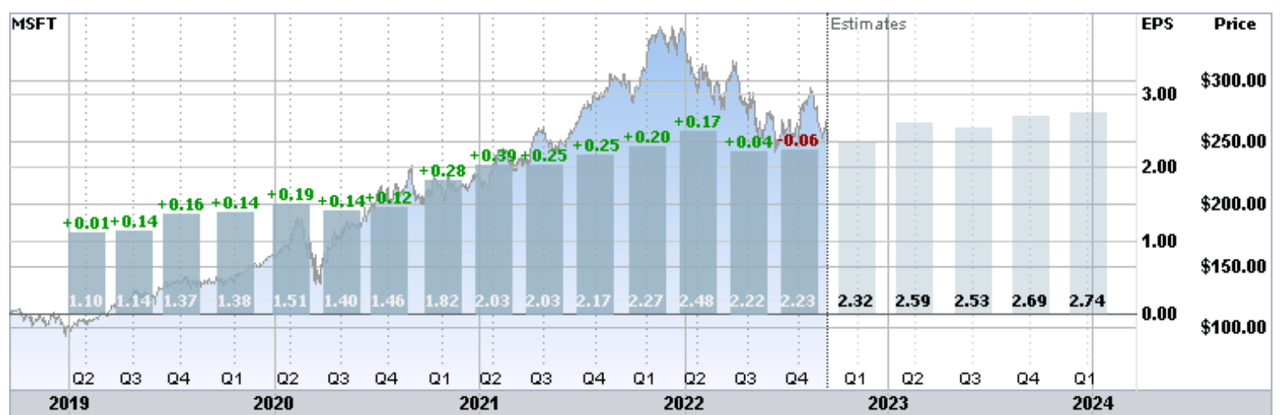
Microsoft’s falling share price in 2022 is partly attributable to the fact that earnings in FY Q3 and Q4 were below the Q2 EPS. FY Q3 had the largest quarterly decline in EPS in years, breaking a run of quarters for which EPS was at or above the previous quarter. Even so, it is worth noting that FY Q4 EPS, reported on July 26, 2022, was 2.8% higher than Q4 of last year and Q3 EPS beat Q3 of last year by 9.4%.
ETrade
Historical (4 years) and estimated future quarterly EPS for MSFT. Green (red) values are amounts by which EPS beat (missed) the consensus expected value above.
The consensus outlook for EPS growth is 13.2% per year over the next 3 to 5 years. The TTM and forward P/E ratios are below the 5-year averages and the forward PEG ratio is below its 5-year average. MSFT’s P/E is in the high range of values over the past 10-12 years, largely due to an upward trend over this period. Earnings have increased rapidly, but the share price has gone up even faster. In short, MSFT is not cheap but neither does it look especially expensive given the company’s growth trajectory.
I last wrote about MSFT on September 15, 2021, a year ago, and I assigned a buy rating to the shares. At that time, the valuation was getting somewhat stretched (forward P/E of 33.8), but the company’s success in growing the cloud segment was encouraging. The Wall Street consensus rating for MSFT was a buy, and the consensus 12-month price target was 10.65% above the share price at that time, for an expected total return of 11.4% over the next year. In analyzing a stock, I also rely on a probabilistic outlook calculated from the prices of call and put options, the market-implied outlook. As of mid-September, the market-implied outlook for MSFT was bullish to early- and mid-2022. The expected volatility calculated from the market-implied outlook was about 27%-28% (annualized). As a rule of thumb for a buy rating, I look for an expected total return that is at least ½ the expected volatility. Taking the Wall Street consensus price target at face value, MSFT did not meet this threshold (11.4% total return vs. 27%-28% volatility), but the bullish orientation of the market-implied outlooks convinced me to go with a buy rating. As noted earlier, MSFT has underperformed the S&P 500 over the past year but substantially beaten the NASDAQ 100.
For readers who are unfamiliar with the market-implied outlook, a brief explanation is needed. The price of an option on a stock is largely determined by the market’s consensus estimate of the probability that the stock price will rise above (call option) or fall below (put option) a specific level (the option strike price) between now and when the option expires. By analyzing the prices of call and put options at a range of strike prices, all with the same expiration date, it is possible to calculate a probabilistic price forecast that reconciles the options prices. This is the market-implied outlook. For a deeper explanation and background, I recommend this monograph published by the CFA Institute.
With a year since my last post on MSFT, I have calculated updated market-implied outlooks and I have compared these with the current Wall Street consensus outlooks in revisiting my rating.
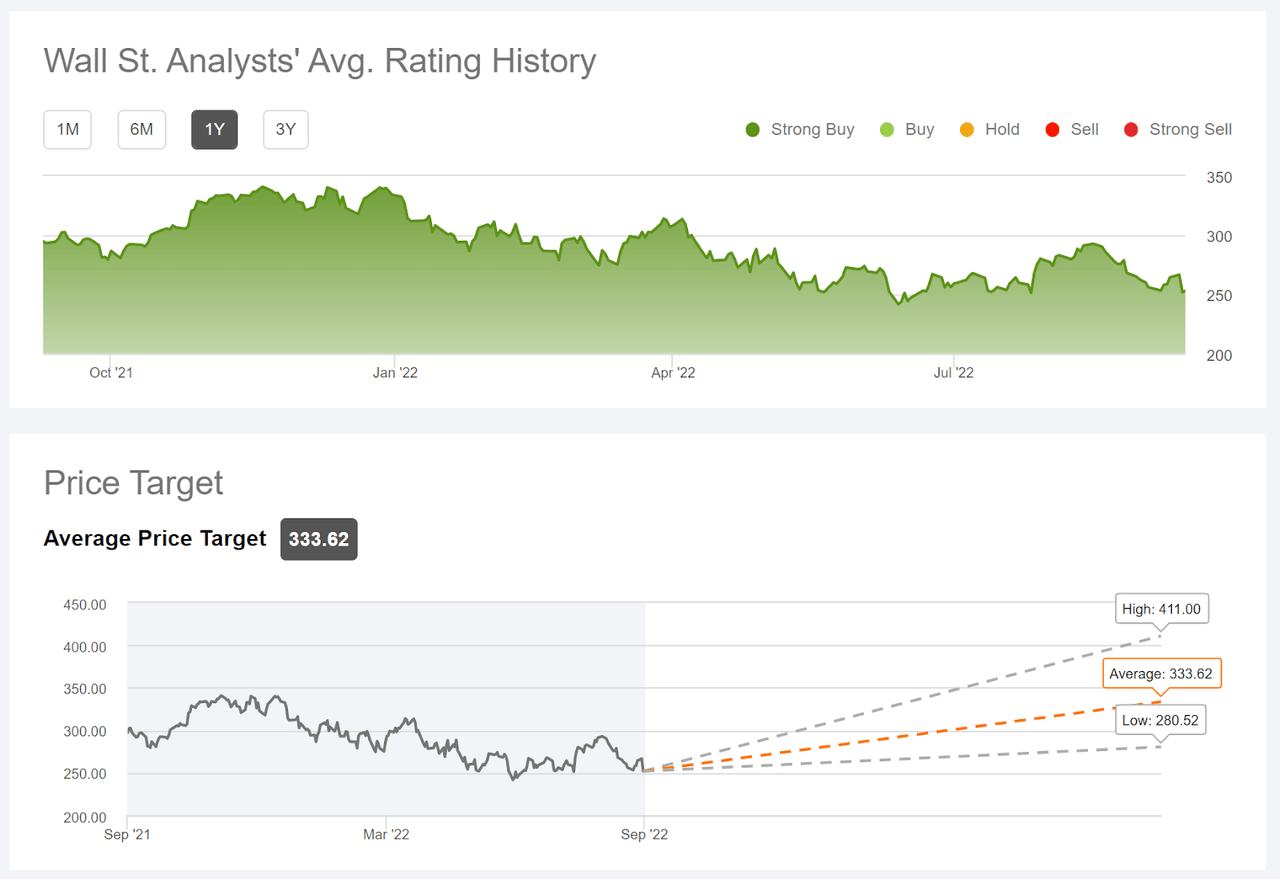
Wall Street Consensus Outlook for MSFT
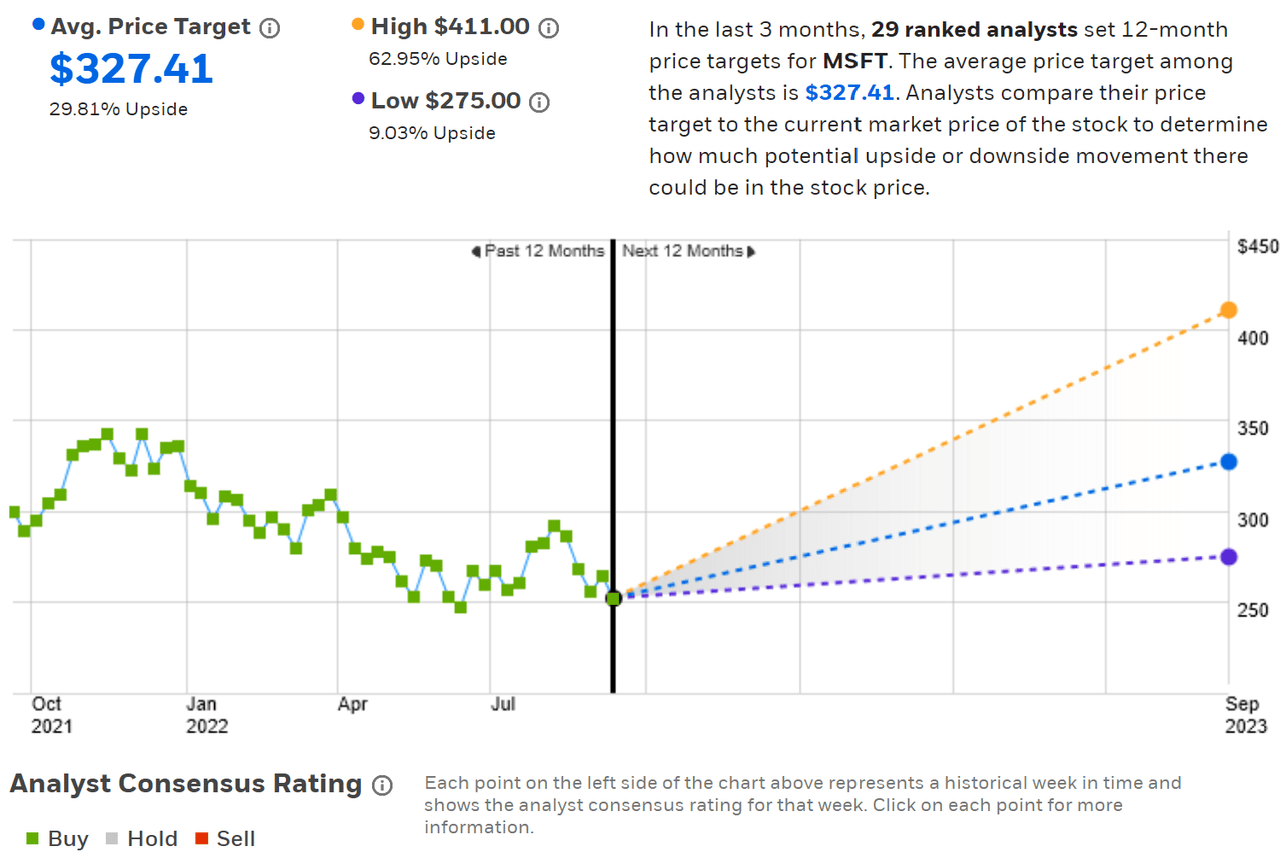
ETrade calculates the Wall Street consensus outlook for MSFT by combining the views of 29 ranked analysts who have published ratings and price targets over the past 3 months. The consensus rating is a buy and the consensus 12-month price target is 29.8% above the current share price. This is a dramatic increase in the annual return compared to a year ago.
ETrade
Wall Street analyst consensus rating and 12-month price target for MSFT above.
Seeking Alpha’s version of the Wall Street consensus outlook is calculated using the views of 49 analysts who have published ratings and price targets over the past 90 days. The consensus rating is a buy and the consensus 12-month price target is 32.3% above the current share price.
Seeking Alpha
Wall Street analyst consensus rating and 12-month price target for MSFT above.
Given the large number of analysts who follow MSFT, it is not surprising that the consensus price targets from ETrade and Seeking Alpha are so similar. That said, there is a fair amount of spread in the individual analyst price targets. The consensus price target has predictive value as long as the dispersion in the individual price targets is not too high. I tend to discount the consensus price target when the ratio of the highest and lowest individual price targets exceeds a factor of 2. MSFT is well below this threshold, with a ratio of 1.5.
Market-Implied Outlook for MSFT
I have calculated the market-implied outlook for MSFT for the 4.2-month period from now until January 20, 2023 and for the 9-month period from now until June 16, 2023. I selected these two dates to provide a view to the start and middle of 2023, as well as because the options expiring in January and June tend to be among the most liquid.
The standard presentation of the market-implied outlook is a probability distribution of price return, with probability on the vertical axis and return on the horizontal.
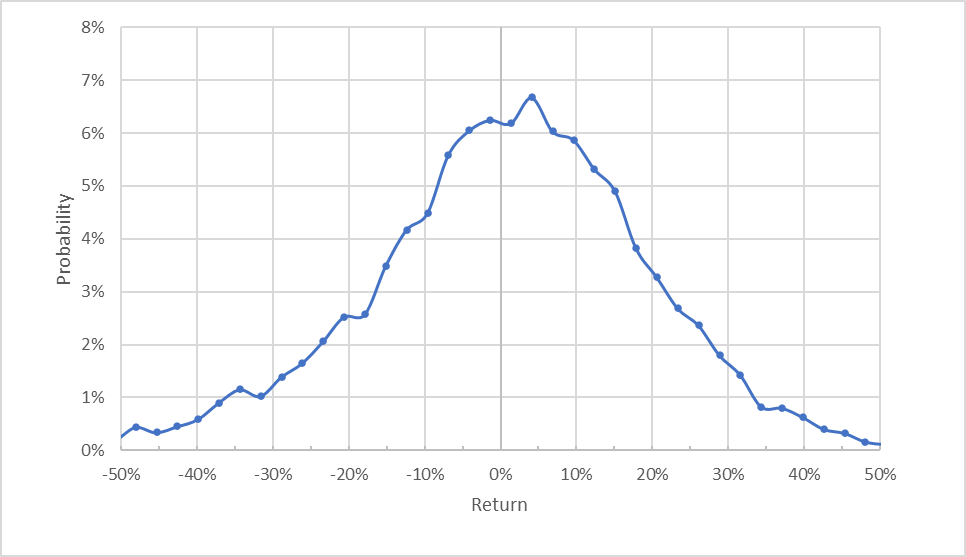
Geoff Considine
Market-implied price return probabilities for MSFT for the 4.2-month period from now until January 20, 2023 above.
The market-implied outlook for the next 4 months has the peak in probability tilted to favor positive returns. The maximum probability corresponds to a price return of +4% over this period. The expected volatility calculated from this distribution is 32% (annualized). This is a reasonable level of volatility, albeit slightly higher than in my analysis from a year ago.
To make it easier to compare the relative probabilities of positive and negative returns, I rotate the negative return side of the distribution about the vertical axis (see chart below).
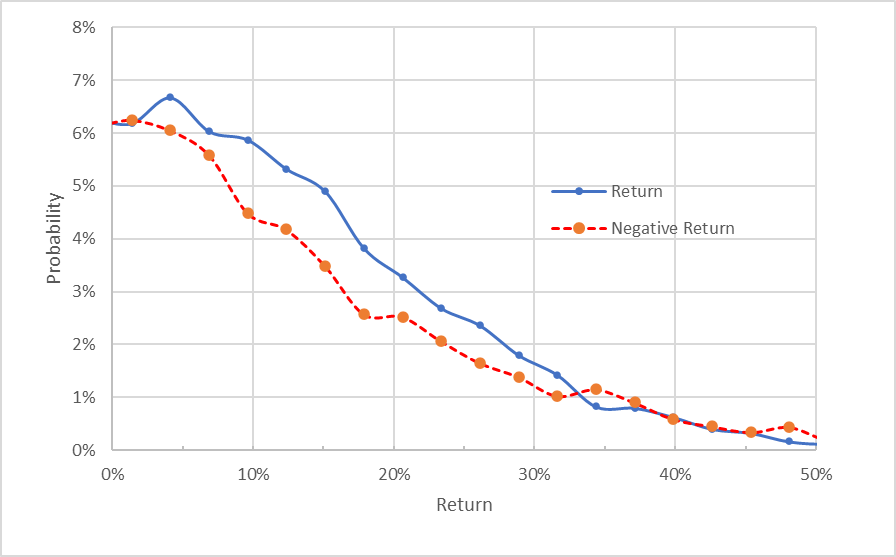
Geoff Considine
Market-implied price return probabilities for MSFT for the 4.2-month period from now until January 20, 2023. The negative return side of the distribution has been rotated about the vertical axis above.
This view makes it easier to see that the probabilities of positive returns are consistently higher than for negative returns of the same magnitude, across a wide range of the most-probable outcomes (the solid blue line is above the dashed red line over the left ⅔ of the chart above). This is a bullish outlook for MSFT for the next 4 months.
Theory indicates that the market-implied outlook is expected to have a negative bias because investors, in aggregate, are risk averse and thus tend to pay more than fair value for downside protection. There is no way to measure the magnitude of this bias, or whether it is even present, however. The expectation of a negative bias reinforces the bullish interpretation of this outlook.
The market-implied outlook for the 9-month period from now until June 16, 2023 is slightly less bullish than the 4.2-month outlook. The expected volatility for the 9-month outlook is 32% (annualized), equal to the value calculated for the next 4.2 months.
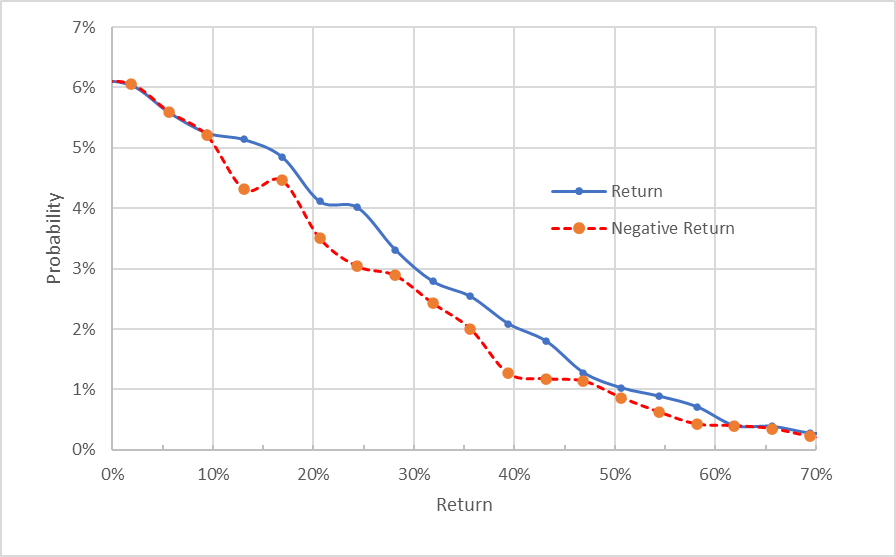
Geoff Considine
Market-implied price return probabilities for MSFT for the 9.2-month period from now until June 16, 2023. The negative return side of the distribution has been rotated about the vertical axis above.
The market-implied outlooks to mid-January and to mid-June of 2023 tell a consistent story. The outlook to mid-January is bullish, with expected volatility of 32%. The outlook to mid-June is also bullish, with expected volatility of 32%. These outlooks are similar to those from a year ago, although the current outlook to June of 2023 is slightly more bullish than last-year’s outlook to June of 2022.
Summary
I started this post by noting that MSFT would be expected to underperform the S&P 500 in the current market conditions because MSFT is a growth stock. This begs the question as to the degree to which the sell-off in MSFT is a reflection of the company’s actual performance, as opposed being pulled down by the broad declines for growth stocks. Granted, MSFT’s valuation was somewhat stretched last year. With the current lower price (as compared to late in 2021), the case for MSFT is considerably stronger. The prevailing view is that the company can maintain earnings growth, albeit at a lower rate than over the past couple of years. The Wall Street consensus rating continues to be bullish, and the consensus 12-month price target is now 30% above the current share price. As noted earlier, one of my criteria for a buy rating is an expected 12-month total return than is at least ½ the expected volatility (32% from the market-implied outlook). Even giving the analyst consensus price target a considerable haircut, MSFT will come in above this threshold. The market-implied outlooks to the start and middle of 2023 are consistently bullish. I am maintaining a buy rating on MSFT.
Be the first to comment