

rrodrickbeiler
The iShares 20+ Year Treasury Bond ETF (NASDAQ:TLT) is experiencing its sharpest draw-down in the post-GFC era. Since recording an all-time high of $179.70 on March 9, 2020, the ETF has fallen a staggering -43% to $100.99 by the time markets closed on Friday, October 7, 2022.
Oversold and ready to bounce?
The Relative Strength Index, commonly referred to as RSI, has fallen to 23.92 in the weekly timeframe. A figure below 30 is considered ‘oversold’ if using conventional parameters.
Created by Author using TradingView, 8 October, 2022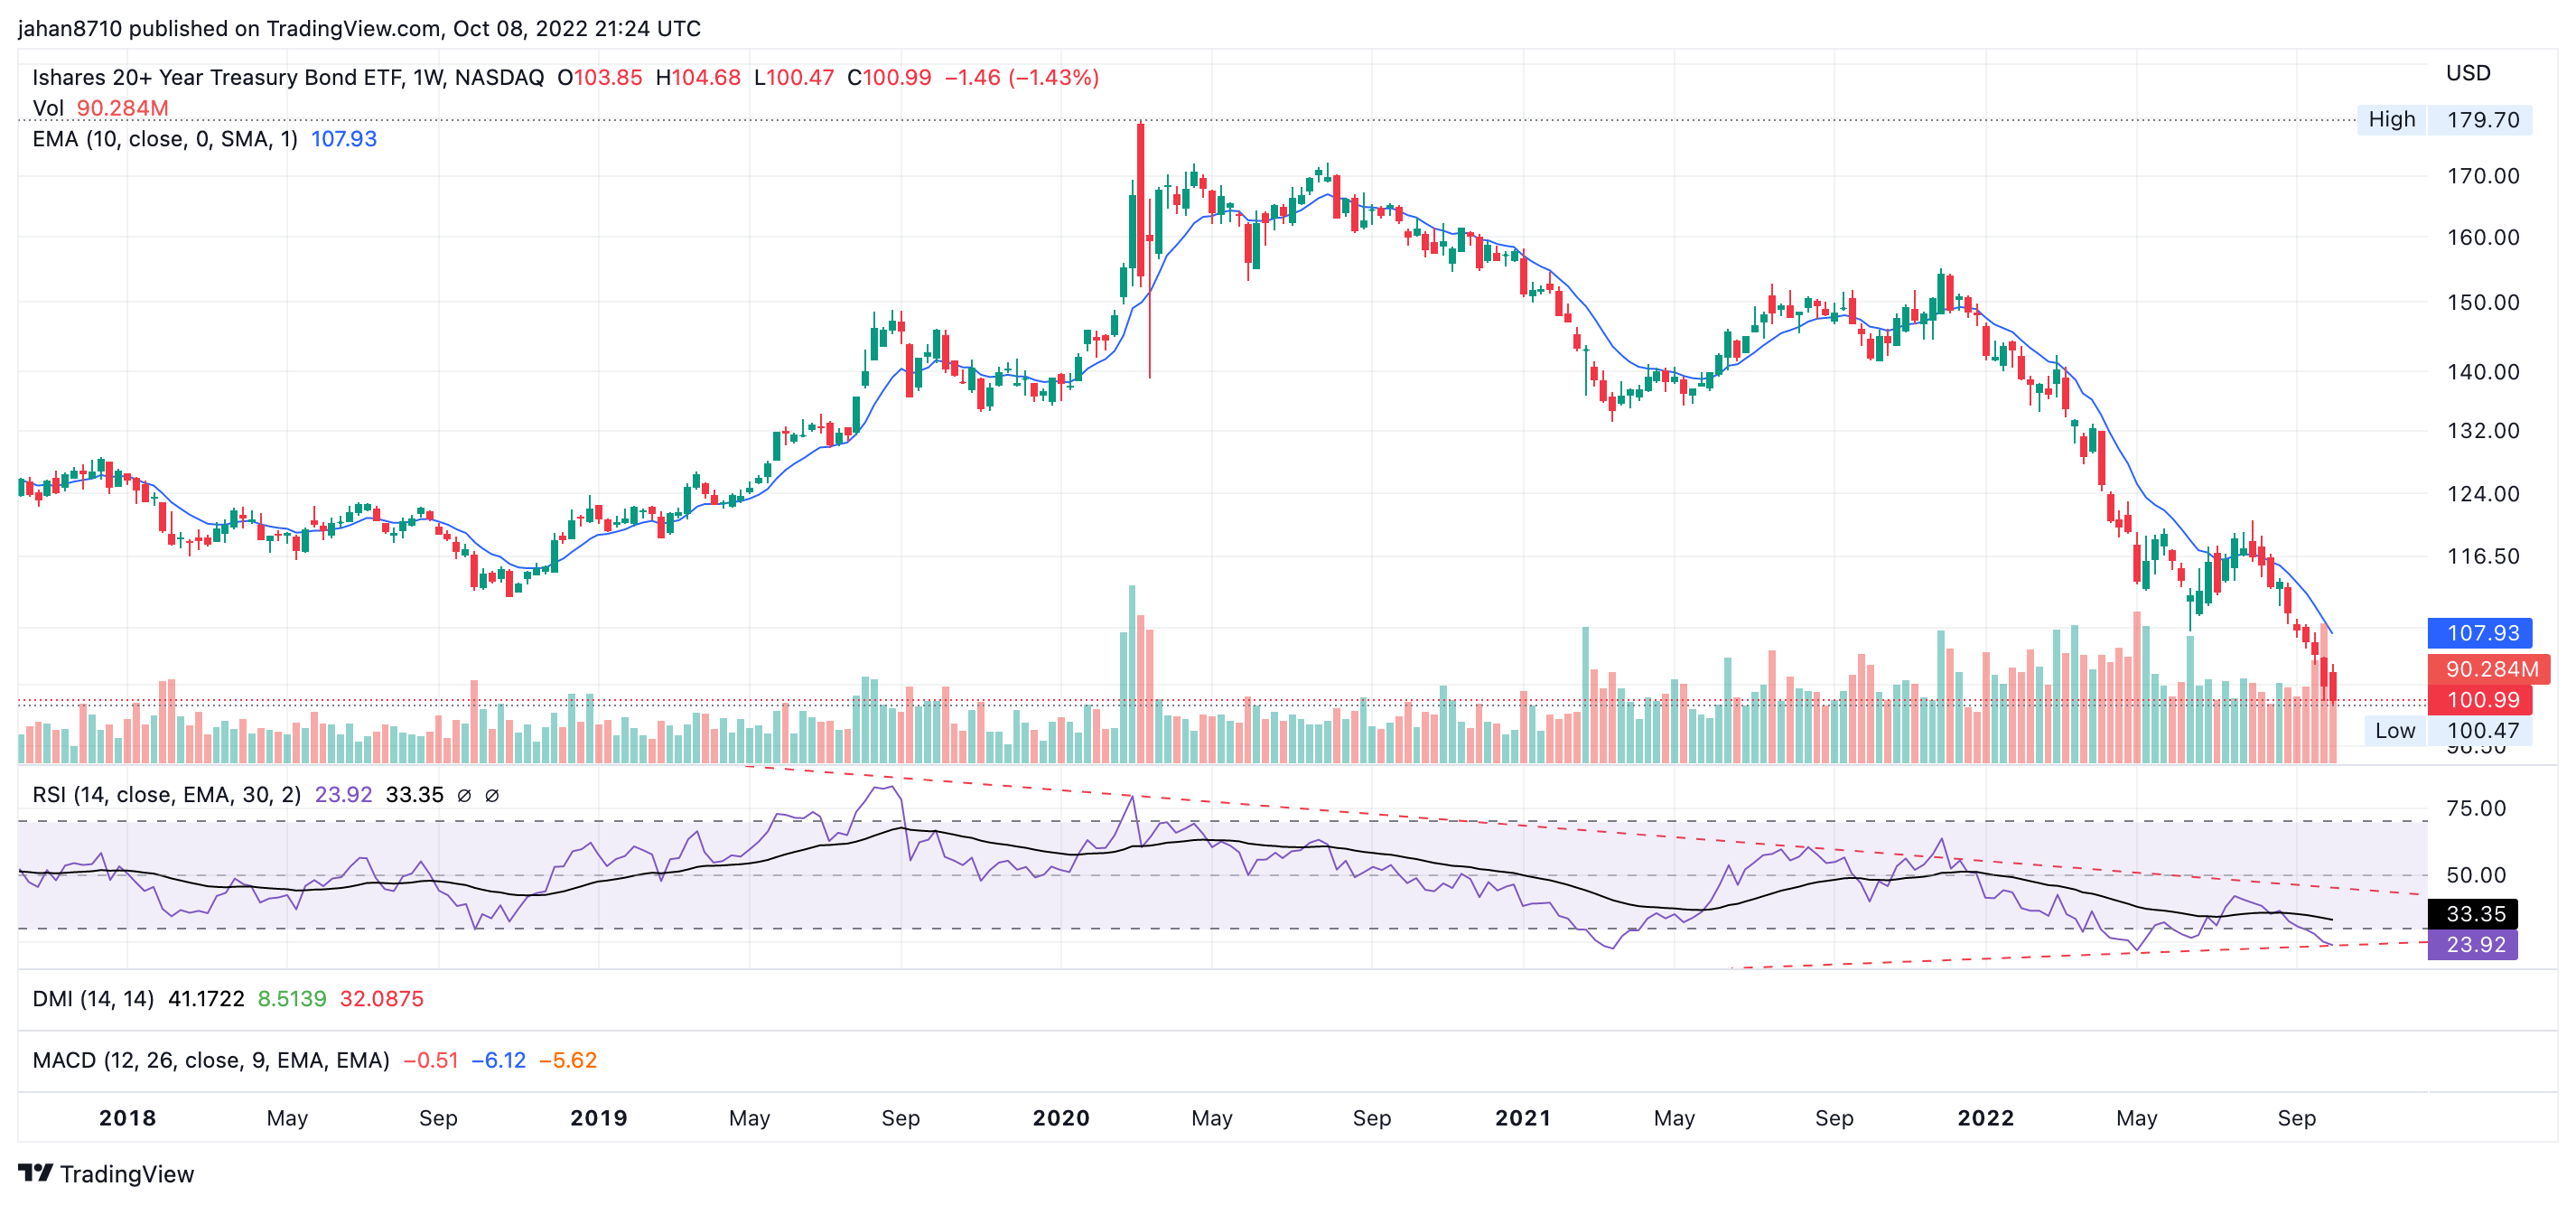
Oversold readings in the weekly timeframe occur less frequently than in shorter timeframes. This means such readings are more likely to occur ahead of substantial bounces in price.
Moreover, we can observe a ‘bullish divergence’ between the price and weekly RSI. This means the former is making lower lows but the latter is not. Bullish divergences are even less common than oversold readings and are more likely to mark points of significant exhaustion in selling pressure.
Downtrends remain intact
Price remains below key moving averages such as the 10-week Exponential Moving Average, or ‘EMA,’ and the 40-week EMA. The former confirms a downtrend in the short-term timeframe while the latter confirms a downtrend in the intermediate timeframe.
We also have confirmation of the intermediate downtrend from the rising Average Directional Index, or ADX, in the weekly timeframe. A rising ADX indicates that the prevailing trend is getting stronger, especially if the recorded level is above 20.
Created by Author using TradingView, 8 October, 2022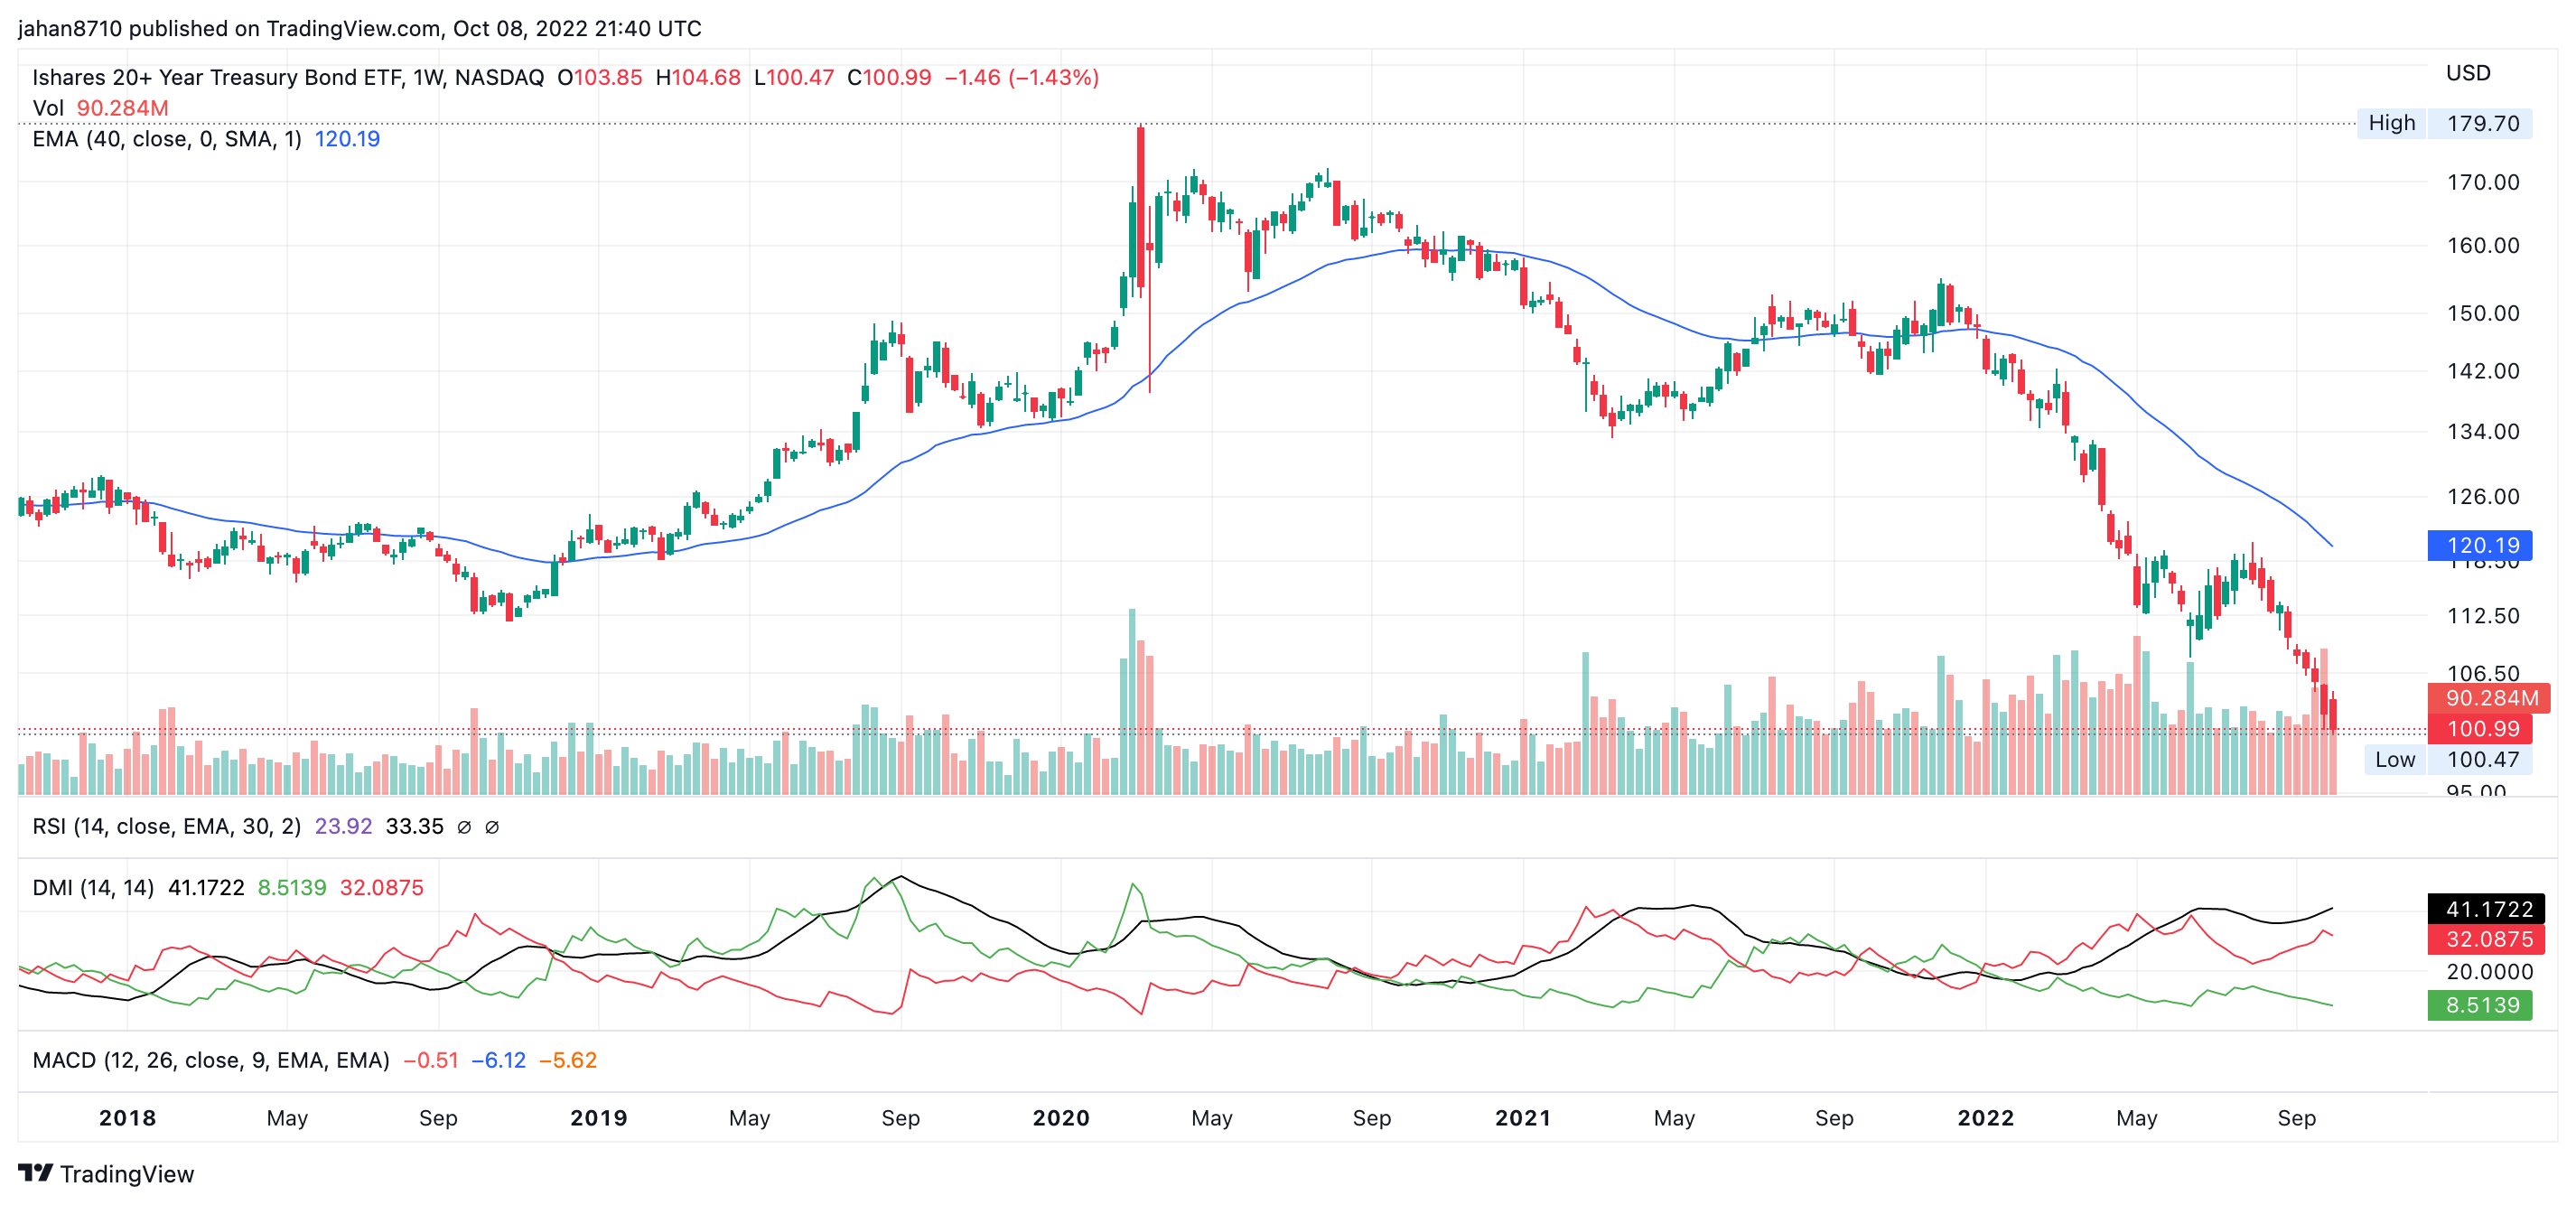
Trading against the trend is harder and riskier than trading with the trend. Since TLT is in downtrends across multiple timeframes, we should have modest expectations for potential upside and choose our entry levels carefully.
The only factors that make buying TLT are the oversold condition in weekly RSI and the bullish divergence between price and weekly RSI. We still do not have an oversold reading for RSI in the daily timeframe.
Created by Author using TradingView, 8 October, 2022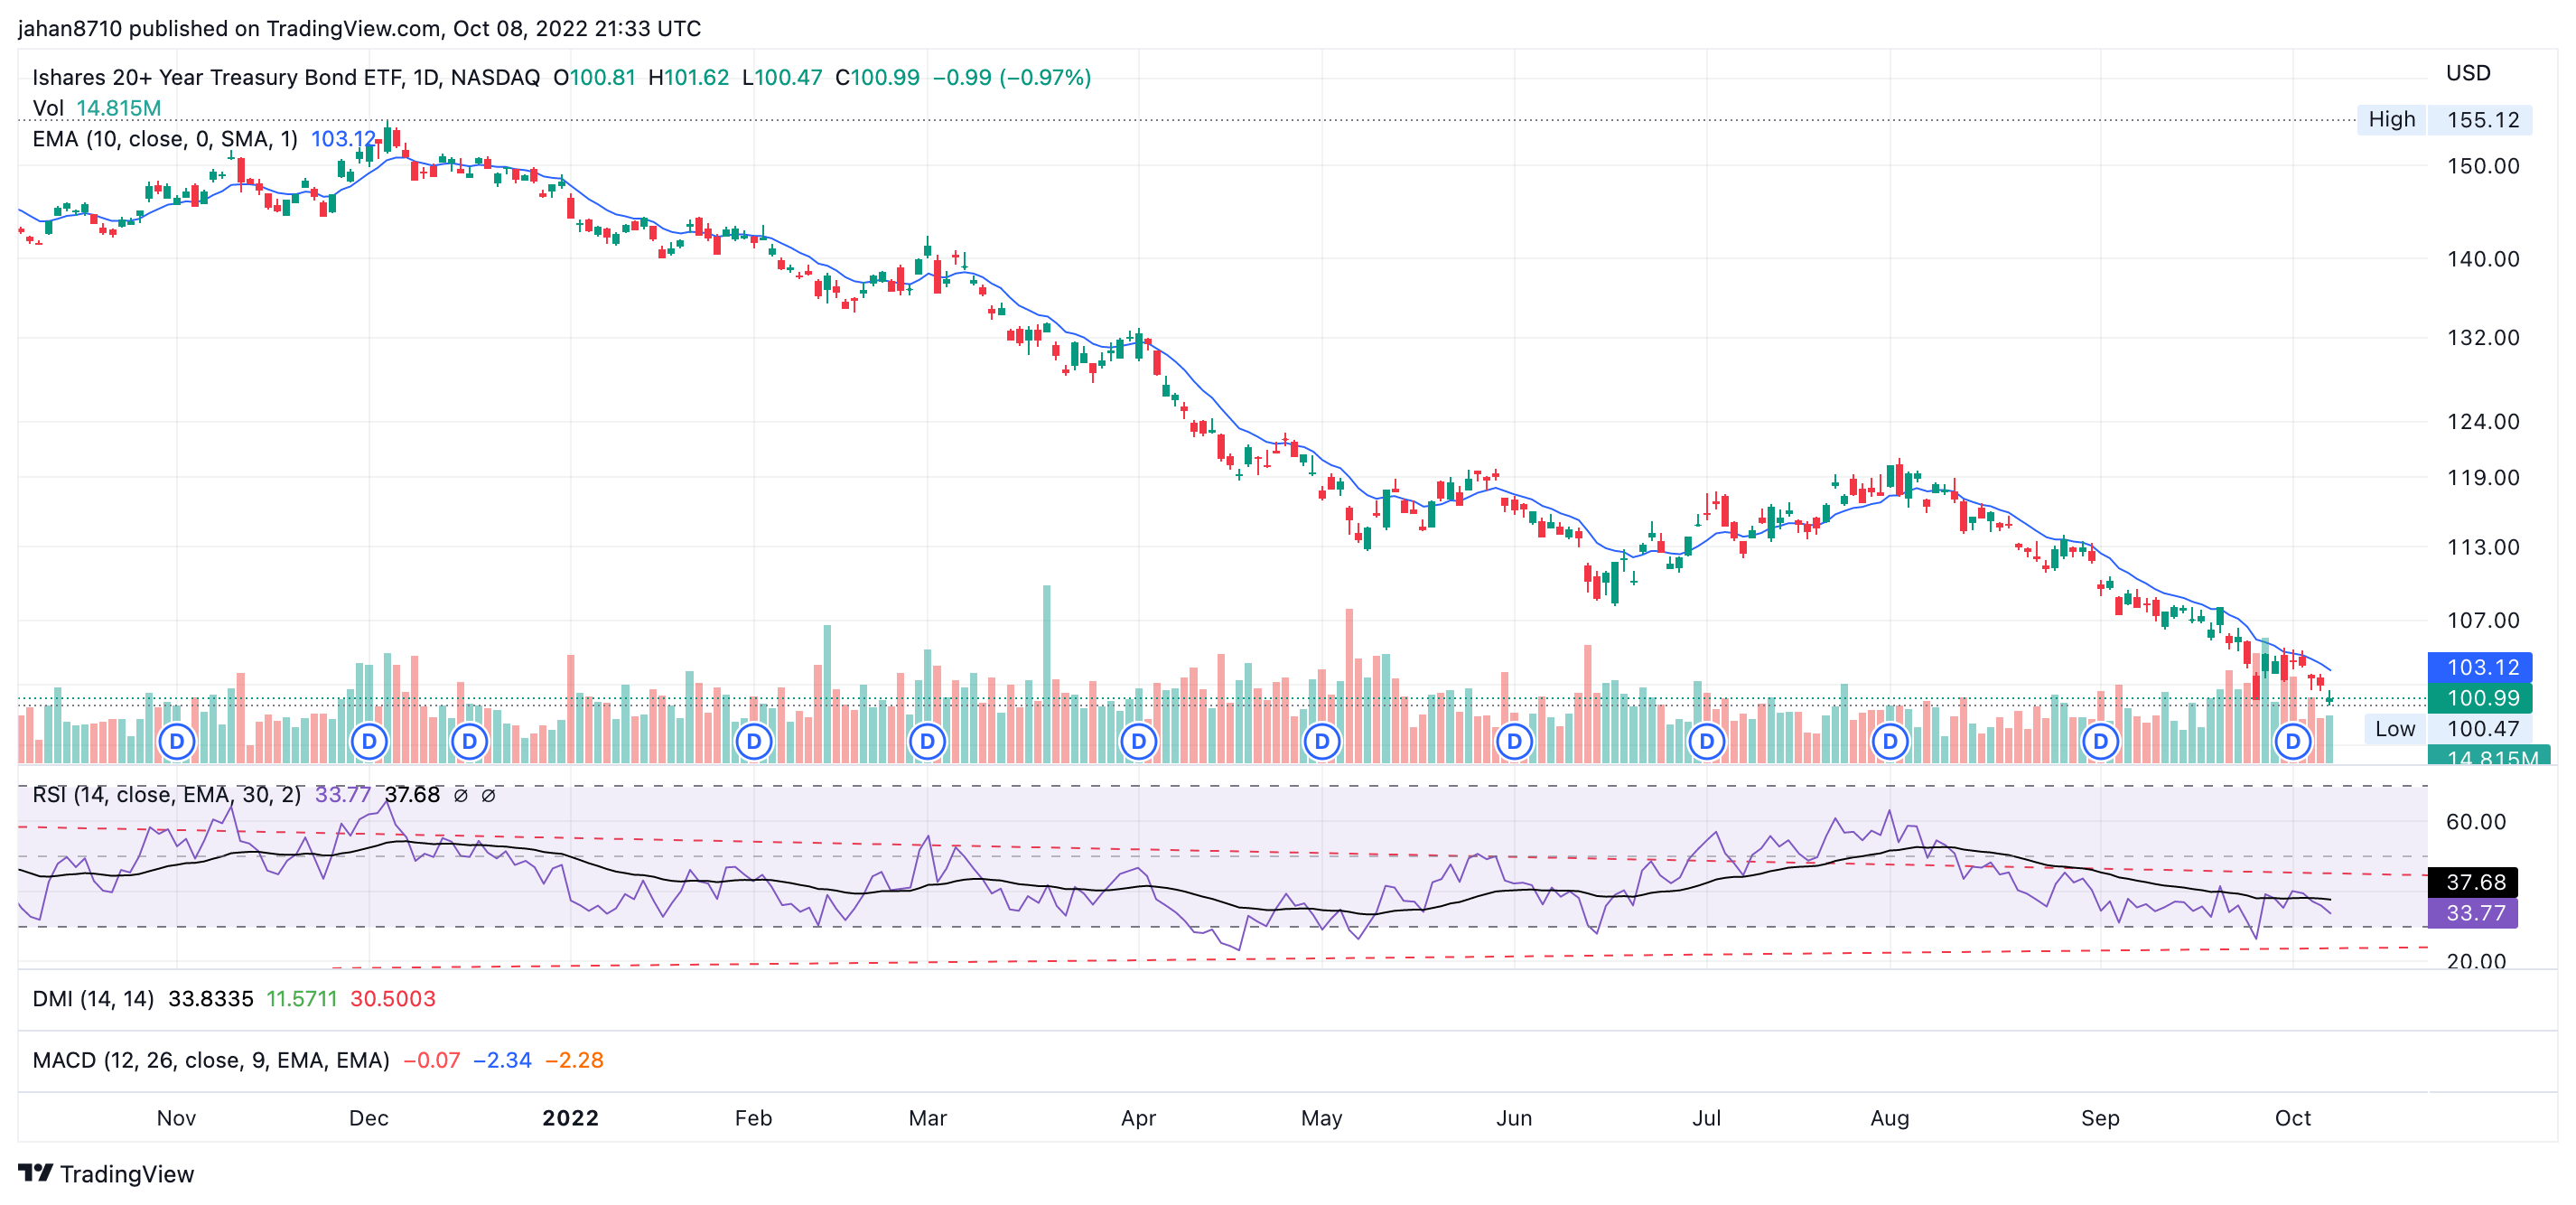
Oversold readings across multiple timeframes increase the chances that we are close to exhaustion in terms of selling pressure. This would be significantly supportive of a sharp reversal in price up to a potential resistance level.
Trade set-up
The 10-week EMA provided a strong resistance level in recent months. Investors could therefore consider placing their take-profit target just below this moving average, which is currently just under $108. A target of $107 gives $7 of profit assuming an entry price of $100.
To maintain a 1:1 risk vs. reward ratio, you could place your stop-loss no lower than $93 if your entry price is $100.
- Ideal entry price: $98-$100
- Take-profit: $107-$108
- Stop-loss: $91-93
- Timeframe: 3 to 23 days.
Normally, you should seek asymmetric risk vs. reward profiles where you can potentially make at least $2 of profit for every $1 that you risk. In this case, it is better to leave more room for your stop-loss because placing it too close to the cost price means you might get stopped out before TLT makes a big reversal. It is not uncommon for prices to spiral downwards after entering an oversold zone, so it is safer to place your stop-loss as low as possible to avoid getting stopped out prematurely.
Next CPI report is a potential catalyst for taking profit
September 2022 CPI data are scheduled to be released on Thursday, 13 October 2022. Hotter-than-expected inflation data should be beneficial for TLT as it will likely increase the chances that the Fed will raise rates by 0.75% in its November policy meeting. This would be positive for TLT because the more the Fed raises rates, the more likely it will be successful in its attempts to reverse the trend of rising inflation.
At the moment, investors are expecting the US Federal Reserve to raise interest rates by 0.75% and 0.50% in the November 1 and December 13 meetings respectively. This will leave the Federal Reserve Fund’s Rate in a range of 4.25% to 4.50%, an astonishing rise from the 0-0.25% policy rate at the start of 2022.
The potentially recessionary consequences of such a sharp and fast rise in interest rates will not affect TLT in a negative way since the primary risk for TLT is rising inflation expectations. Consistent and meaningful rises in policy rates over the next two policy meetings should help bring inflation expectations down even further, which is good for TLT.
Favorable valuation
The average real yield for the 30-year US government bond since 2010 has been approximately 0.91%.
FRED website, 8 October, 2022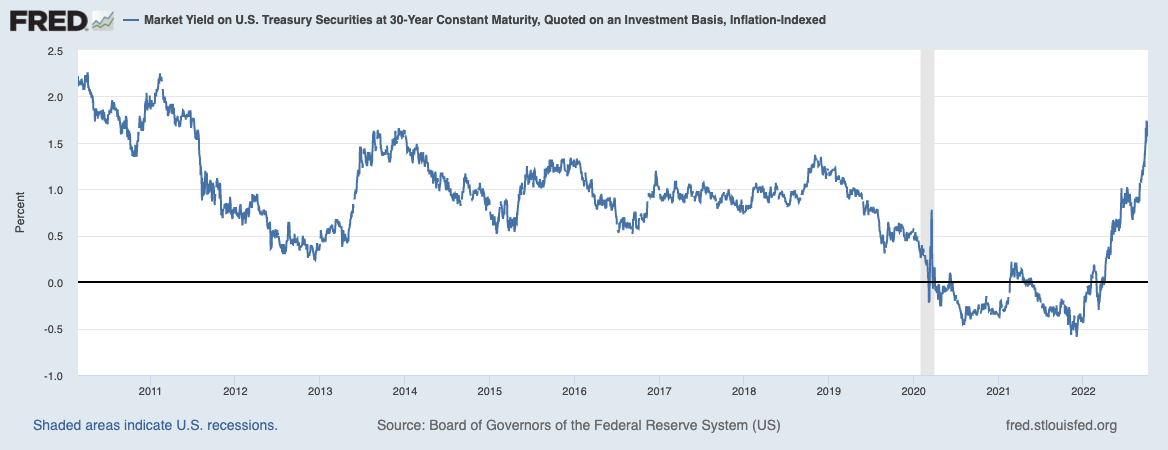
With real yields currently at 1.73%, you are getting almost twice the historical average. Furthermore, 30-year break-even inflation rates have been falling since April 2022. This increases the chances that we are approaching a peak in inflation expectations as long as the Fed continues its path of tightening monetary policy.
FRED website, 8 October, 2022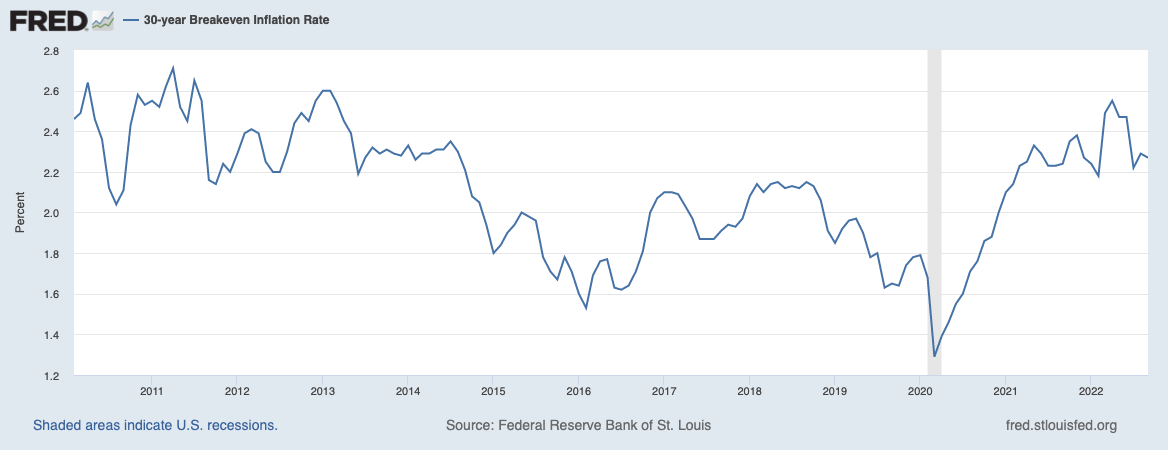
What could go wrong?
A rise in inflation expectations would cause the price of TLT to fall even further. The biggest risk to this trade could therefore be the Fed tightening less aggressively than what investors currently expect.
Despite substantial consecutive rate hikes, policy rates remain much lower than the current rate of inflation whether it’s measured by CPI or the Fed’s preferred gauge of inflation: the PCE deflator. Historically, the Fed had to raise policy rates above the rate of inflation to bring inflation down. Time will tell whether this will be necessary this time around, but the least the Fed can do is follow through with its present course.
Conclusion
TLT is close to recording oversold levels across multiple timeframes. Investors seeking an attractive short-term trading opportunity can buy TLT in the range of $98 and $100 in anticipation of a sharp bounce up to the range of $107-108. This sharp bounce could happen within a few days if the CPI report comes out hotter than expected as this would cement the Fed’s likely path of raising policy rates as aggressively as possible over the next two meetings.
Be the first to comment