

Tim Boyle/Getty Images News
It appears that recession has begun in the U.S. That was my conclusion in my previous article, Recession: I’m Calling It.
Investing is not easy during recession. But a good pair trade can hedge your position. That’s why I’m looking at Rent-A-Center, Inc. (NASDAQ:RCII) and The Aaron’s Company, Inc. (NYSE:AAN).
Household budgets are tight and getting tighter as the cost of living is outpacing growth in wages. Consumers have already begun to shift their shopping habits by cutting back on discretionary spending and increasing credit balances. This macro environment is a doubled edged sword for the lease-to-own (LTO) business model of RCII and AAN.
This pair trade is due to 3 reasons why RCII is set to outperform AAN:
- Margin Convergence
- Addressable Market Growth
- Capital Deployment.
Before we dive into each reason, let us examine the state of the consumer.
Consumer Behavior is Changing
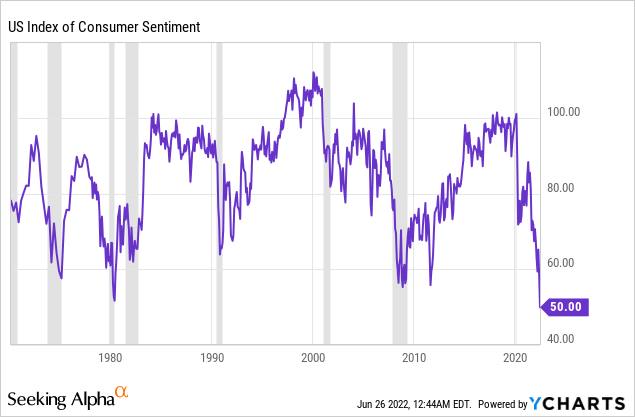
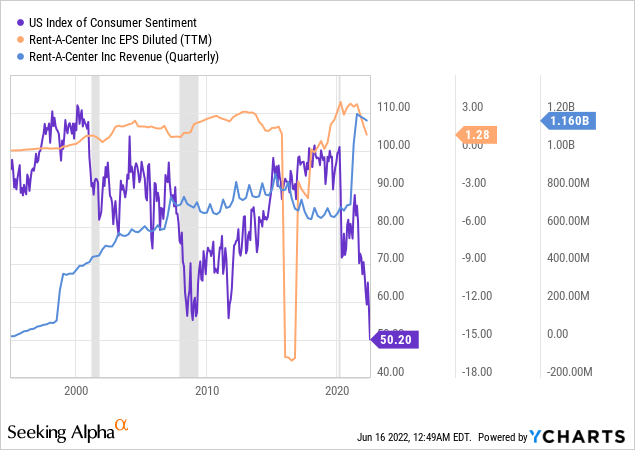
The U.S. consumer is going through a transformation. For the first time on record the University of Michigan Consumer Sentiment Index hit a low of 50. This is a result of falling real wages causing discretionary spending to decline.
The stimulus and direct payments to U.S. families following COVID lockdowns caused a spike in household disposable income and retail spending. RCII and AAN benefited from above-normal increased revenues and earnings that have proved transitory. But stimulus payments have now ended and inflation-adjusted family income has fallen.
Consumers are turning to credit to maintain their standard of living. The MoM increase in consumer credit in March of 2022 was the highest in over 20 years at $52.4 billion.
The Daily Shot (used with permission)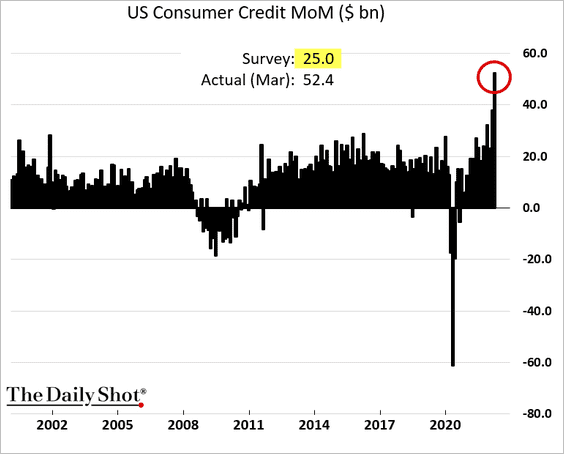
The ratio of consumer loans to personal savings has accelerated quickly from under 0.5 in 2020 to over 2.0 in 2022. These levels of debt represent a tightening in spending limits for consumers.
Federal Reserve Economic Data | FRED | St. Louis Fed
Today, the revolving consumer credit per working age person in the U.S. is near all-time highs of over $5,000 per person. This level was previously reached in 2007 and 2020.
Federal Reserve Economic Data | FRED | St. Louis Fed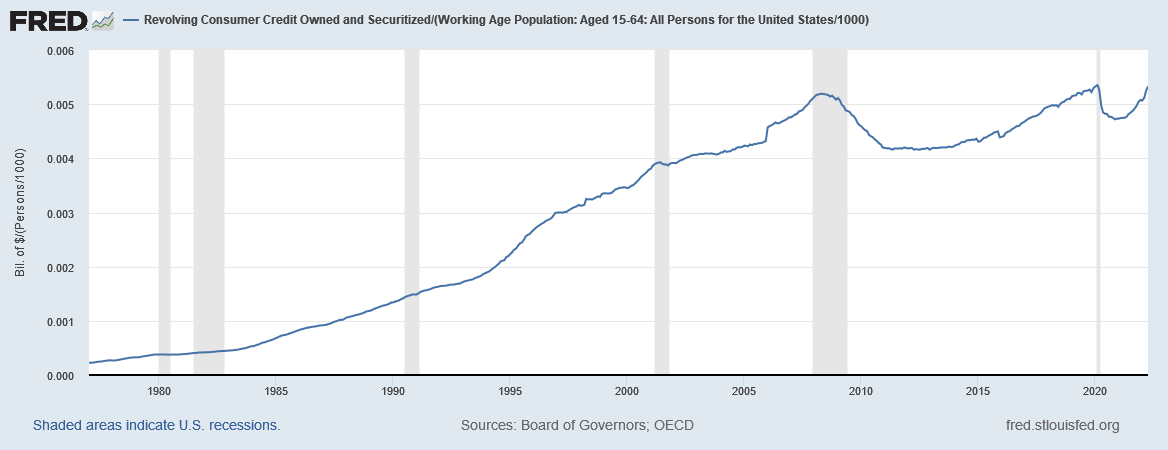
While nominal retail sales continue higher, due to inflation, real retail sales have been in decline for a year.
Federal Reserve Economic Data | FRED | St. Louis Fed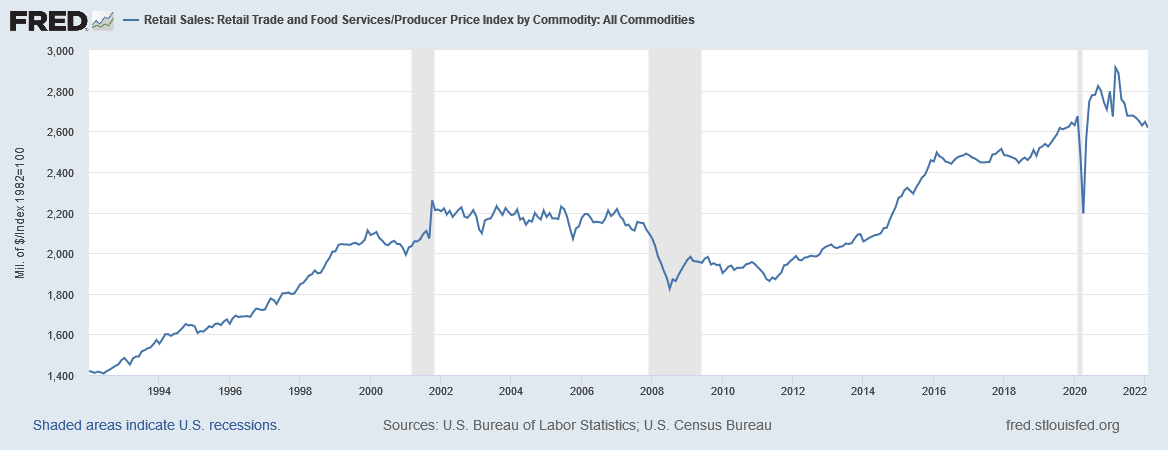
The macro environment has created a unique situation for retailers. COVID lockdowns first created a decline in consumer demand. Demand then surged higher with stimulus. Supply could not keep up, due to factory shutdowns and supply chain constraints, causing higher prices and shortages. Now, consumers are pulling back and retail inventories are piling up.
This has created an unprecedented bullwhip effect. Prices for many consumer goods, especially durables, will come down as retailers try to offload the inventory to less willing consumers. Years of durable goods purchases, such as furniture, have been pulled forward and won’t need to be replaced for some time. This condition has impacted the earnings of major retailers like Target (TGT), which reported unexpected inventory builds.
The Daily Shot (used with permission)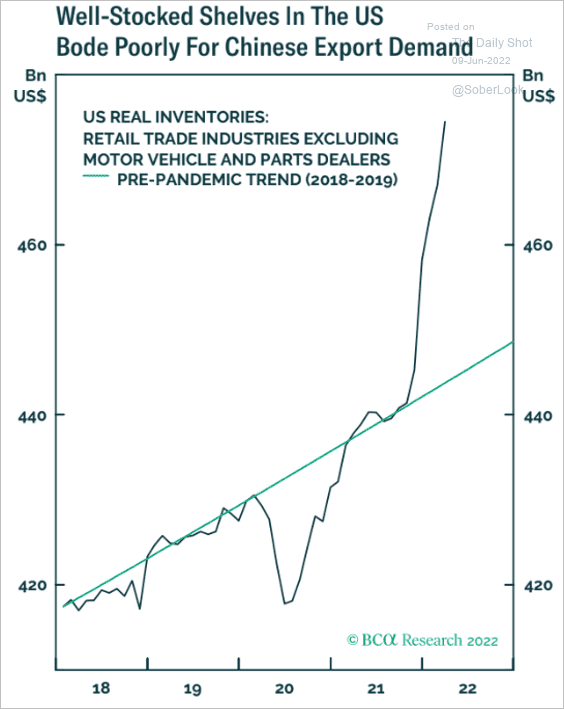
To cope with tighter budgets consumers are turning toward “Buy now, pay later” loans. This survey by LendingTree found that 35% of those polled said they were considering BNPL services in May. Unfortunately, 42% also said that they have made a late payment on these types of loans. Unsurprisingly, the percent of Americans who have used BNPL services have increased from 31% in 2021 to 43% in 2022.
I expect the U.S. consumer will be spending less on discretionary goods especially durable goods including furniture, outdoor fixtures, and exercise equipment. Retailers will entice consumers with reduced prices on overstocked inventory. Consumers will utilize credit more including LTO and BNPL services. Default rates on credit lines will increase as layoffs increase and consumers struggle to make their payments.
Rent-A-Center has exhibited relative resistance to recession in the past. While I expect LTO businesses to fare better than traditional retailers I think this recession hits LTO harder than usual because of this bullwhip effect and pulled forward demand for expensive goods.
Margin Convergence
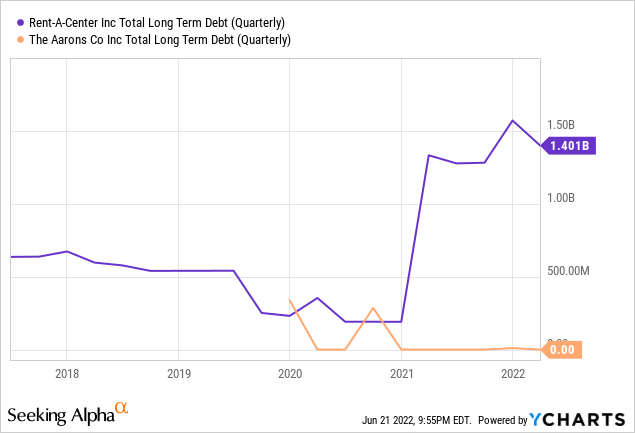
One of the most significant differences between RCII and AAN is profit margin. AAN has a profit margin of 5.2% while RCII stands at 1.8%. However, RCII had profit margins in the 4-6% range until 2021 and the company’s gross profit margin had been in line with AAN for the last 5 years around 60%. The decline in profit margins have corresponded to RCII’s acquisition of Acima Holdings for $1.65 billion.
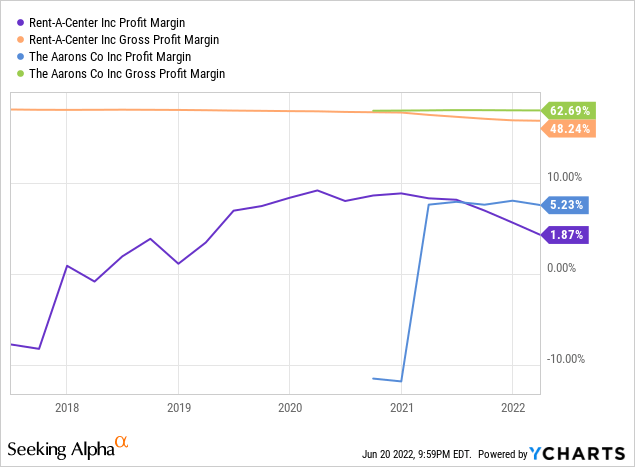
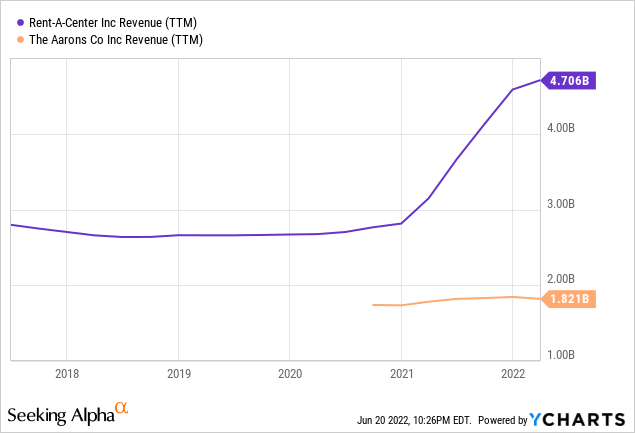
The acquisition of Acima nearly doubled RCII’s revenues to $4.7 billion compared to AAN’s $1.8 billion. However, the merger has not produced to the bottom line like management expected, mostly due to elevated loss rates from delinquent payments.
In Q4 2021, Acima was experiencing loss rates of 11.8% while loss rates at Rent-A-Center were 4%. That worsened to 12.6% in Q1 2022.
Company Presentation on Seeking Alpha
Management is committed to improving profitability of Acima and began by making changes to segment leadership. In March, it was announced that Aaron Allred has taken over as Executive Vice President for Acima. Allred is Acima’s founder and a significant shareholder.
The company is working on implementing improved underwriting and collections procedures to decrease delinquency and loss. Management has spoken about using collections staff from the Rent-A-Center segment to help recover delinquent goods from Acima. A product return policy for Acima customers is also under consideration. So far, the company is making progress, as is evident by the Acima first payment missed rate which has fallen in Q1 2022.
Company Presentation on Seeking Alpha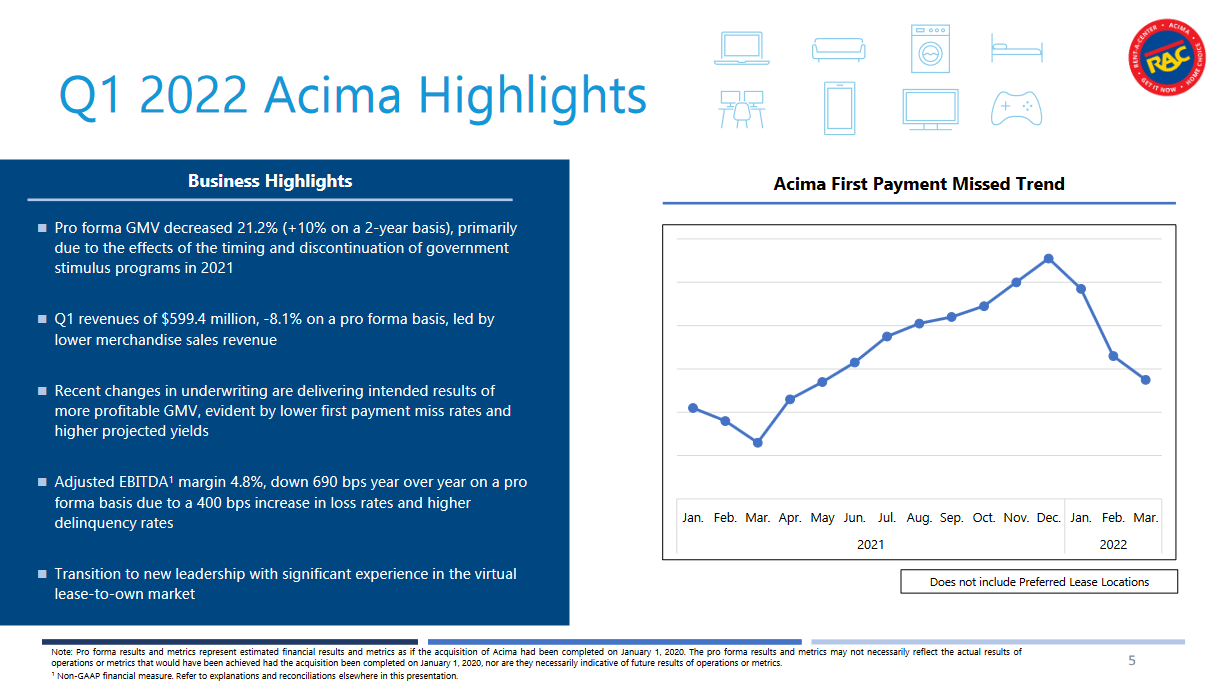
RCII CEO Mitch Fadel had this to say during the Q1 2022 Earning Conference call:
Over the past number of months, we identified issues that drove Acima’s underperformance, developed a plan of action and began implementing solutions. In addition and as previously announced, we’ve recently completed a leadership transition at Acima. So we’re encouraged with our start to the year with early indications that our adjustments are having the desired effect, and first quarter financial results coming in above the midpoint of our guidance ranges.
He went on to say:
The shift in underwriting as part of a broader set of changes at Acima to address the issues that occurred in the latter portion of 2021. As previously noted, we did not anticipate the extent or pace of the decline in customer and payment activity. Although, we made adjustments to our underwriting, the initial changes in 2021 were in hindsight not sufficient to address developments in the external environment. Because we’re a portfolio business, these earlier vintages, lease vintages take time to cycle through our results and we expect to see the impacts of those vintages through the end of the second quarter.
I expect RCII to achieve loss rates for Acima that are in line with virtual business loss rates of 6-8%. I estimate that if Acima’s loss rate was 6% company profit margin would be ~4.7%. Current EBITDA margin for Acima is 4.8% compared to 20.7% for RAC. Management is guiding for a long term EBITDA margin for Acima of 12-13%.
By comparison, AAN loss rate was 5.4% of revenues in Q1 2022 up from 3.1% last year. I think this is the beginning of a trend in payment delinquency that will continue to worsen across the LTO space.
The following are charts of 2021 revenues for AAN and RCII based on product category. I have color coded the product categories based on my expectation of how robust sales will be going forward. Red categories include furniture, appliances, and jewelry. I have poor expectations for furniture and appliances because these purchases were pulled forward as a result of lockdown home improvement and “the great relocation.” These items do not need to be replaced for years. Jewelry joins this group because it is discretionary and vulnerable to recession. The remaining categories have enough necessity and turnover rate to sustain sales volume. According to this data AAN received 74% of its 2021 revenues from red categories while RCII received 60%.
Chart by author, data from company financial statements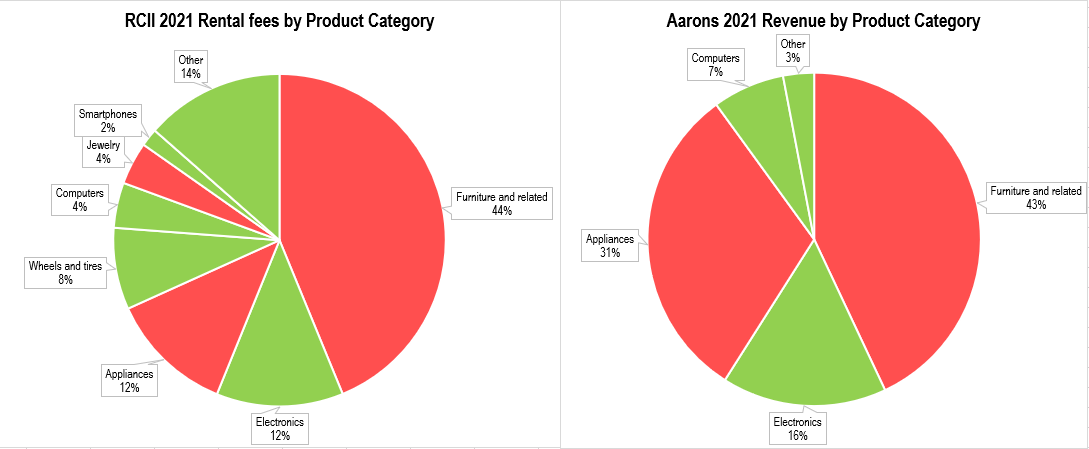
Based on these metrics I expect AAN to experience a material deterioration to profit margin while RCII experiences a marginal improvement. I expect the profit margin spread between these companies to decline from 336 basis points to under 200 basis points by 2023.
Addressable Market Growth
Rent-A-Center’s move to buy Acima prompted a buy rating from Loop Capital Markets. By acquiring this virtual LTO segment RCII is a whole different business. The Acima service expands the company’s addressable market by gaining exposure to customers through 15,000 partnering stores and 40,000 retail partners.
Company Presentation on Seeking Alpha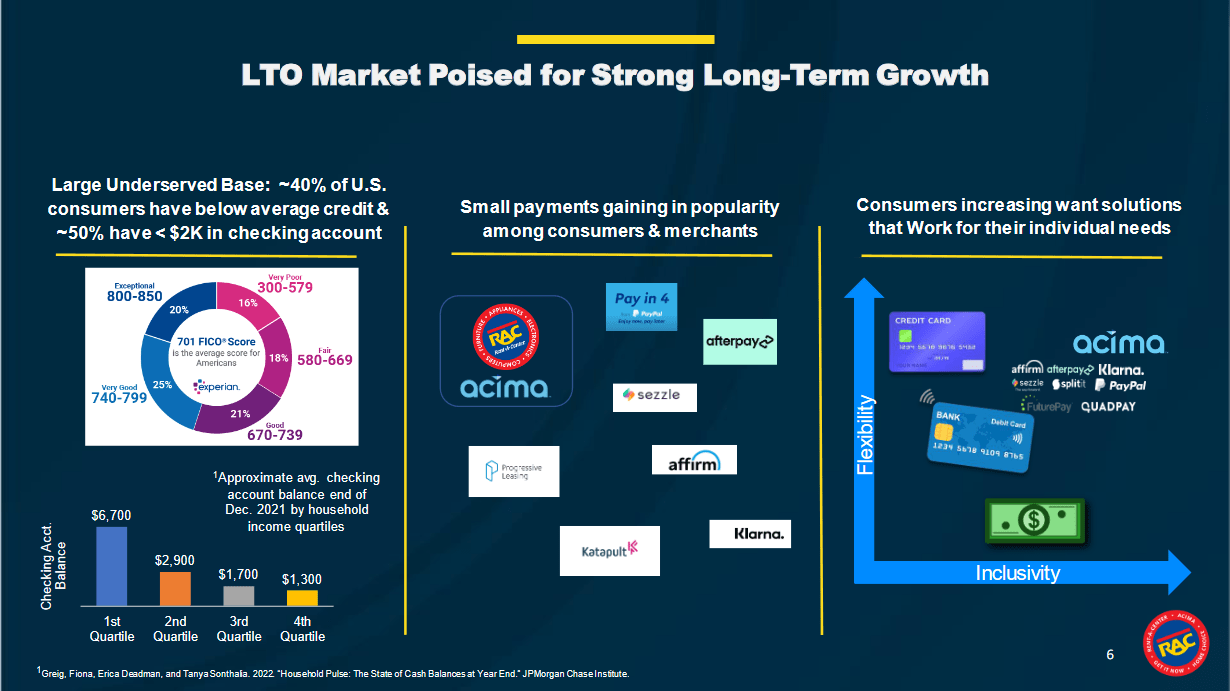
Despite challenges with payment delinquency and profitability the segment is growing strongly. The Acima mobile app had half a million downloads in 2021 and is on pace for a million downloads in 2022. In Q1 2022, the segment added 1,300 net active merchants to its network. The Acima LeasePay Card is being deployed and will provide customers with a convenient way to exercise their lease-purchase agreement on demand.
Company Presentation on Seeking Alpha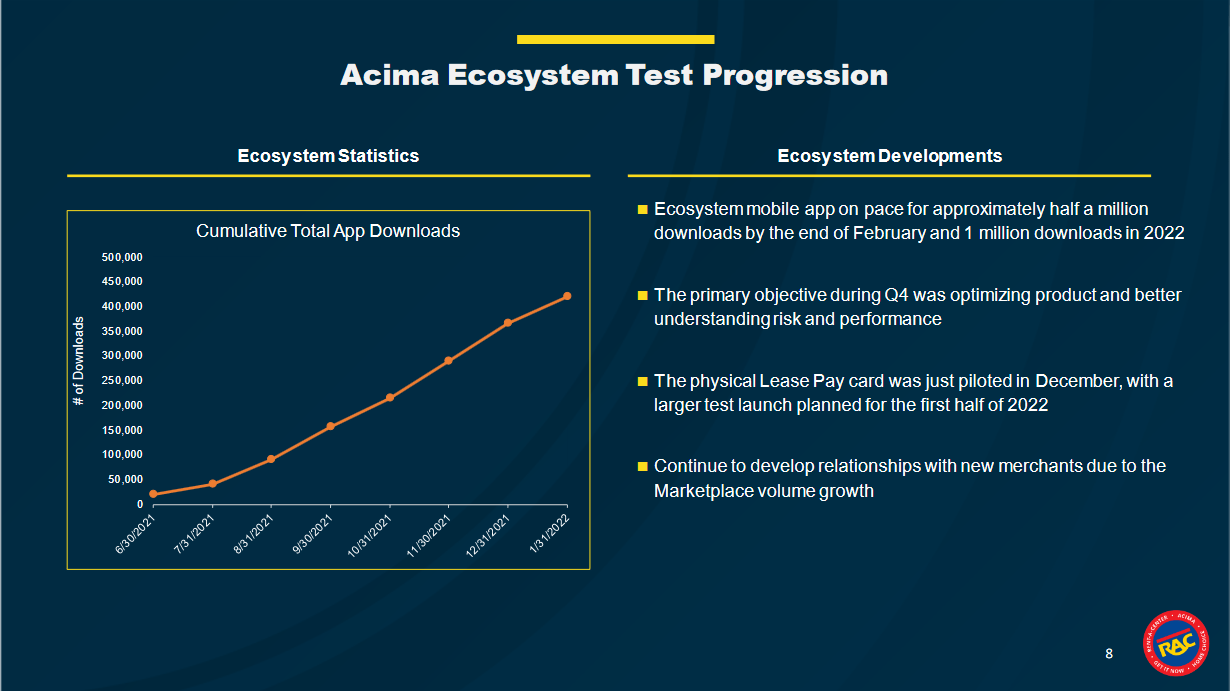
Total revenue for Acima was $2.3 billion in 2021. In Q1 2022, Acima accounted for $599 million in revenue at 51.6% of total revenue for RCII. Yet, the segment only accounted for 4.8% of company adjusted EBITDA, illustrating the scope of potential that Acima could achieve. The segment is transforming the business by expanding digital sales as a percent of company revenue from 16% in 2020 to 46% in 2021.
Same store sales for RCII grew -1.1% YoY in Q1 2022 and 22.3% over two years. In comparison, same store sales for AAN grew by -4.3% YoY and 9.6% over two years. To improve this substandard performance, AAN is employing four strategies:
- Close under-performing stores: the company expects to reduce its store count over the next five years. Store count has already decreased from 1,502 in 2019 to 1,306 in 2022.
- Expand GenNext stores: since 2020 AAN has opened 135 newly branded “GenNext” stores that have more modern appearances and design. Lease origination at these stores have grown over 20% more than original Aaron’s retail outlets. The company is expecting to open another 100 GenNext locations in 2022.
- Expand e-commerce segment: the company has been driving sales to its website in an effort to increase the customer base. For Q1 2022, e-commerce represented 15.4% of company revenues.
- Lean on BrandsMart acquisition: AAN acquired BrandsMart in April for $230 million in cash. BrandsMart earned $757 million in revenue in 2021.
The slow growth in same store sales and decision to close legacy stores demonstrates that Aaron’s is struggling to maintain its brand and customer base. Management seems to have a lot of faith in the GenNext retail model, but I’m skeptical. These stores are mostly one year old or less and opened during the height of stimulus spending and COVID reopening. I believe these stores experienced abnormally attractive growth due to a combination of customer curiosity and eagerness to go shopping. Consumers are now reducing overall spending which is showing up in real purchase card data in the chart below. I would expect GenNext store growth to decline to more realistic rates in the coming quarters.
The Daily Shot (used with permission)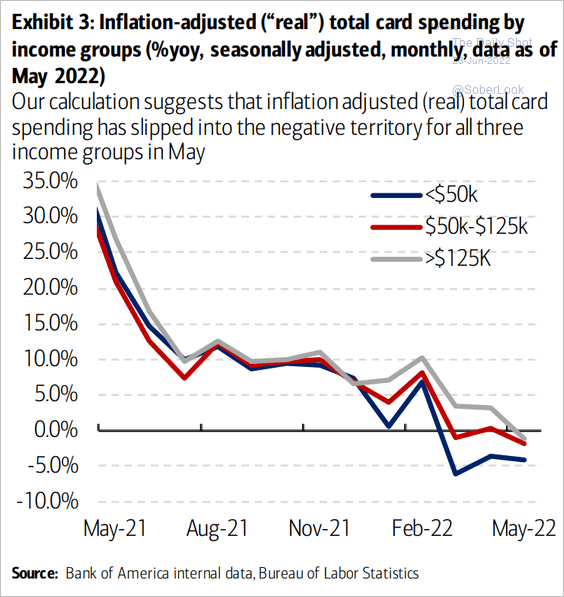
I agree it is wise for AAN to expand their e-commerce business because younger consumers with technological preference have become a major customer demographic for household goods. However, AAN is not demonstrating robust e-commerce growth. While the percent of lease revenue from e-commerce has increased steadily over the past 9 quarters, the growth rate of e-commerce revenue is slowing. Following the pandemic, YoY growth rates spiked to 53% but has since fallen to 3.9%. This is mostly attributable to base effects in 2021. However, given the macro environment I would not be surprised to see single digit growth for e-commerce going forward. Next quarter will be particularly telling.
Aaron’s Company E-commerce Growth (Company Presentation from Seeking Alpha)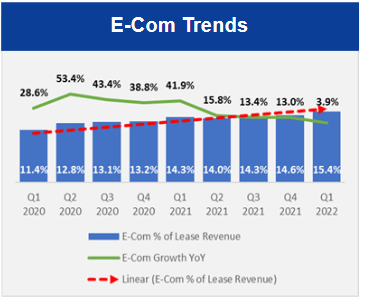
During the last quarterly earnings conference call, AAN CEO Douglas Lindsay talked about the BrandsMart acquisition:
We have already begun the work on the implementation of an in-house lease-to-own solution for BrandsMart customers, which we expect to launch in the second quarter of this year. We are also preparing to add some of the BrandsMart product catalog to aarons.com by the end of the year and are beginning to assess procurement synergies between the two businesses.
The buyout is immediately accretive to earnings and the price is not expensive at a purchase price to adjusted EBITDA multiple of 5.0x. The acquisition is expected to close in Q2 2022 and begin contributing to company financials thereafter. In my opinion the acquisition makes sense but it doesn’t make a difference. It increases AAN’s exposure to brick-and-mortar retail at a time when retail is suffering. Compared to the 15,000 partnering stores for Acima, BrandsMart only adds 10 retail locations to AAN’s network.
These conditions explain the difference in growth estimates as provided by Seeking Alpha in the screenshot below. RCII is expected to experience forward revenue and EPS growth of 19.3% and 14.5% compared to AAN’s 13.7% and 1.2%.
Seeking Alpha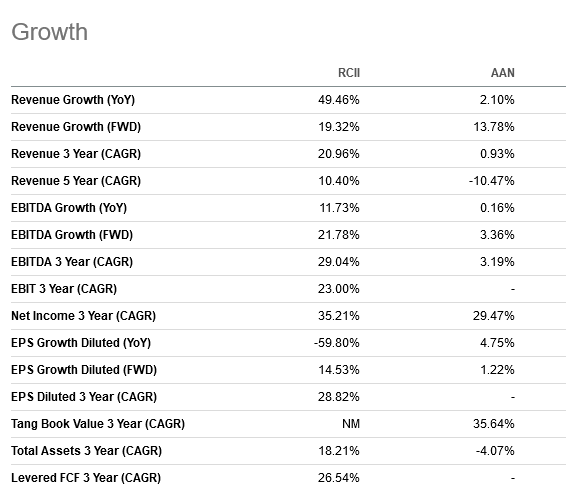
When discussing gross merchandise value growth during the last quarterly conference call RCII CEO Mitch Fadel said:
…we would still anticipate double-digit growth when you think about 2023 and beyond maybe higher than that depending on we get larger account plans and so forth.
The long-term growth potential of Acima is intriguing. The segment gives Rent-A-Center access to thousands of retailers and millions of potential customers without additional retail stores and the expenses and risk that go with them. This provides RCII the flexibility and adaptability that is necessary for navigating a consumer recession and the recovery that follows.
Capital Deployment
This economic environment necessitates that companies deploy capital efficiently. RCII is better positioned with an insider ownership of 10.4% compared to AAN at 1.6% to make shareholder friendly decisions.
Seeking Alpha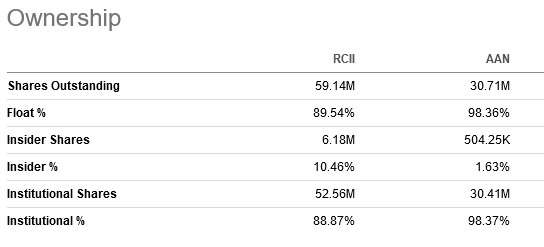
I believe that the decision to continue opening GenNext stores by AAN is a tactical error. I do not favor investing capital in unproven stores during the onset of recession. To make matters worse, they are deploying capital at a time when labor and material costs are extraordinarily high. It would be prudent to wait for the monetary tightening cycle and recession to moderate costs. Instead, my current preference is to be lean, be efficient, and return capital to shareholders.
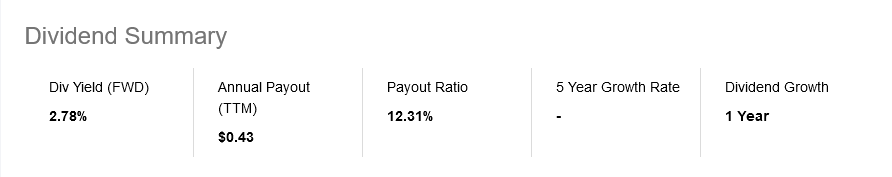
The FWD dividend yield for RCII at current share price is 5.9% at a 25.5% payout ratio. This yield is the highest since a brief time in 2016. For AAN, the FWD yield is 2.7% at a payout ratio of 12.3%. At the same payout ratio AAN would yield 5.6%.
RCII Dividend Summary (Seeking Alpha) AAN Dividend Summary (Seeking Alpha) RCII Dividend Yield History (Seeking Alpha)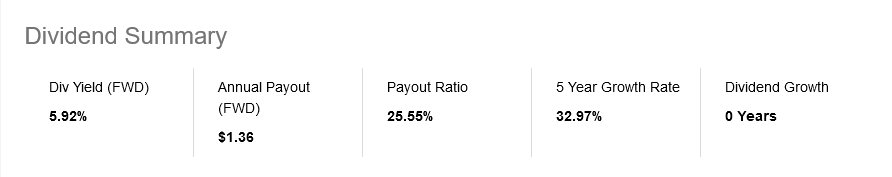
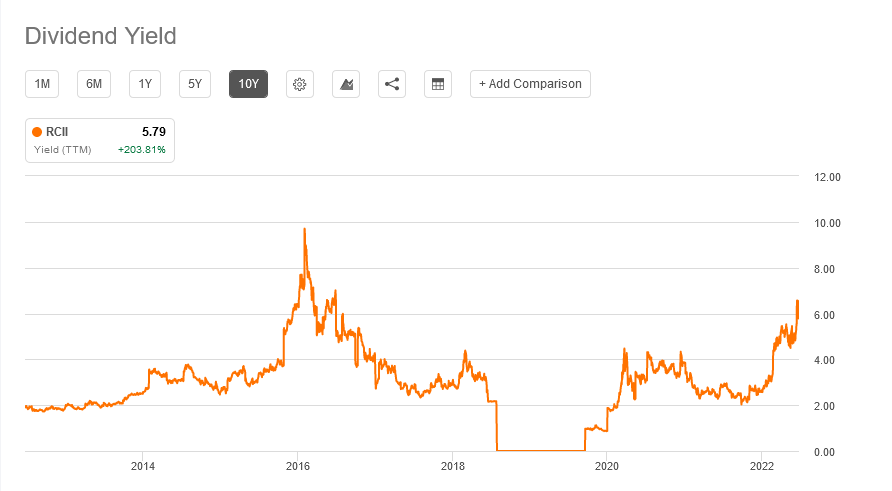
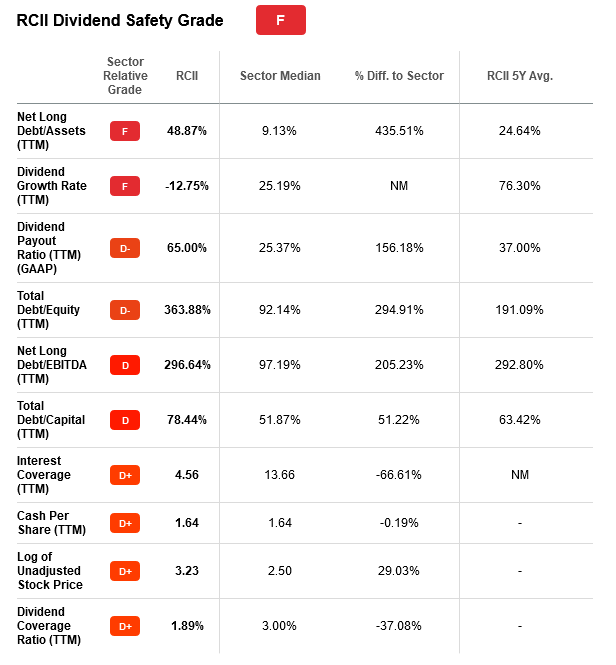
Seeking Alpha has flagged RCII at high risk of a dividend cut. This is primarily due to the heavy debt burden that the company carries as a result of the Acima acquisition. However, the company raised its dividend in Q4 2021 which I interpret as a sign of confidence from management. RCII has guided to distribute approximately $80.4 million in dividends compared to $390 to 440 million of free cash flow for 2022. Given these circumstances I am not overly concerned about a dividend cut and prefer the higher dividend which I can then decide to reinvest in the stock or deploy elsewhere.
Seeking Alpha Seeking Alpha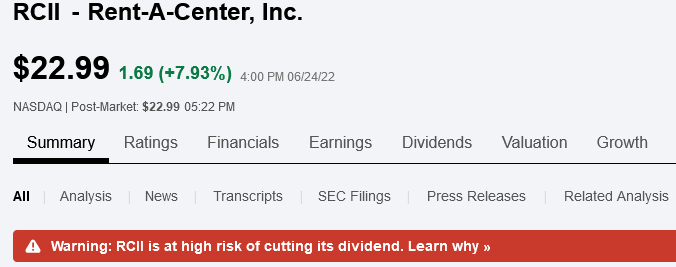
RCII has announced a $500M buyback plan to be completed through Q2 2023 with $360 million remaining. This is equal to 30% of current company market cap. Likewise, AAN approved a $250M share repurchase program through 2024 of which $135 million remains which is equal to 28% of market capitalization. The difference is that RCII is guiding for 2022 FCF of 1.1 times their remaining buyback while AAN is guiding for $45-55 million in FCF which is only 0.37x their remaining buyback.
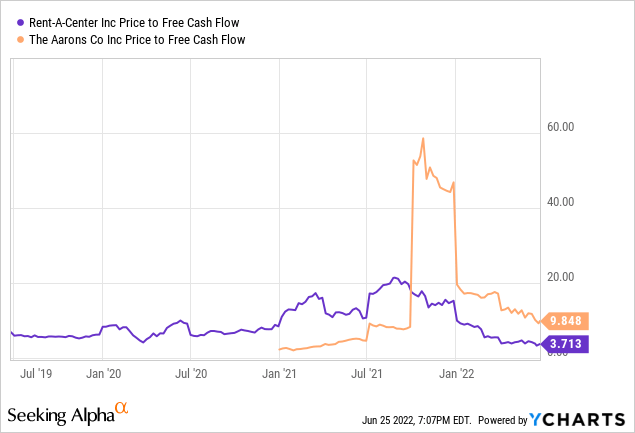
In addition, as Warren Buffett famously said, “Price is what you pay. Value is what you get.” At current share prices, RCII is getting nearly three times more value for its money than AAN according to price to free cash flow multiples.
Risk
What cannot be ignored as a high risk for RCII is the amount of net debt that the company has added to its balance sheet as a result of the acquisition of Acima. At the end of Q1 2022 RCII had $1.4 billion in debt resulting in a pro forma net debt to adjusted EBITDA leverage ratio of 2.3x which is uncomfortably high. Management is addressing the concern by using most of free cash flow to reduce the debt to a target of 1.5x leverage ratio. RCII receives a BB- S&P Rating which is below investment grade, however AAN is not rated.
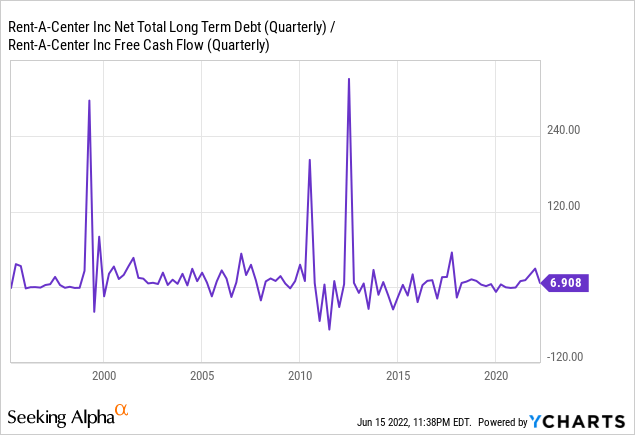
The net long term debt to FCF ratio for RCII is at 6.9 which is not uncommon for the stock. Barring a significant loss in free cash flow I expect the company to cover its debts without issue.
My primary concern with AAN is that they are not prepared for reduced consumer spending that will emerge from recession. If the company suffers losses to earnings while multiple compression progresses in equity markets the share price will decline substantially.
Both companies are exposed to payment delinquency risk which is quickly on the rise. LTO customers typically have low credit scores and limited disposable income. This demographic is experiencing a loss of income and increase in living expenses that they did not anticipate and the issues are going to worsen.
One way for LTO to cope with this risk is to be more selective in their underwriting process. During recession, the LTO customer base increases to include consumers with moderate credit scores and income that now find themselves on a tighter budget. A survey by Willis Towers Watson has found that 36% of employees making over $100,000 are living paycheck to paycheck. This poll by LendingClub found that one third of consumers earning over $250,000 are living paycheck to paycheck and have an average FICO score of 758. LTO businesses can improve profitability by focusing on these customers with the best means to pay. By its actions, Rent-A-Center appears to be pursuing that aim with more purpose than Aaron’s.
Finally, the retail bullwhip effect is going to drive durable goods sales down and prices with it. For this reason, I expect RCII and AAN to report negative revenues and earnings growth in coming quarters. The question is ‘how much?’ and I say more for AAN.
Valuation
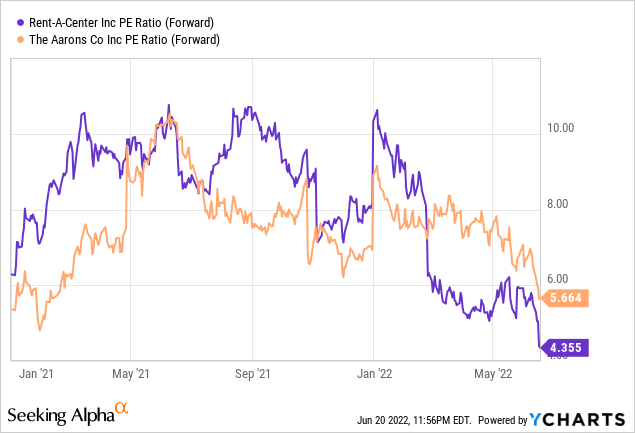
RCII is guiding for a FCF yield of 31% while AAN is guiding for a FCF yield of 10% in 2022. AAN sports a more attractive EV to EBITDA multiple FWD of 3.79 compared to RCII’s of 5.41 due to RCII’s sizeable net debt burden. If the debt were repaid the EV to EBIDTA FWD for RCII would be approximately 2.7. RCII is more appealing with a forward P/E of 4.3 compared to 5.6 for AAN.
According to the discounted cash flow model by Alpha Spread RCII is undervalued by 56% in the bear case scenario. Comparatively, AAN is undervalued by 53% in the bear case scenario.
Forecast Cloud Model
Below is my forecast cloud model for RCII and AAN. The model is based on price to earnings estimates for 2023 from FAST Graphs. The model displays the total return CAGR for potential P/E multiples while the size of the dots represents the probability of occurrence according to my assessment. This model expects a 40% probability that AAN will experience negative returns over this time period while RCII has an 85% probability of positive returns.
Forecast cloud model (Chart by Author, earnings estimates from FAST Graphs)
Summary
It’s hard to be optimistic about traditional retailers in the intermediate term with consumers struggling and recessionary forces building. The good times for LTO in 2020/2021 is over and it’s important to be efficient and flexible for the foreseeable future.
RCII CEO Mitch Fadel had this to say during the Q1 2022 Earning Conference call:
… we’ve proven in the past to be very resilient to recessionary pressures.
Mitch also spoke about recession during the Q4 2021 earnings call. Aaron’s, on the other hand, hasn’t mentioned recession in any earnings call over the past year. Clearly, one company is thinking farther ahead.
Rent-A-Center has proven it can navigate this economic environment, although it is uniquely challenging due to a bullwhip effect. Both stocks have been punished by the market but RCII has been punished more for stumbling on its Acima acquisition. That move is strategic long term and more likely to improve from here.
Pair Trade
I’m buying: lowest adjusted valuations in two decades, second highest dividend yield in two decades, extensive long term growth potential, tighter underwriting policies.
I’m selling: Building new retail stores, sluggish growth, increasing loss rates, mediocre free cash flow yield.
Be the first to comment