

andreswd
According to scientists, tortoises walk at about 1 mile per hour. Farmer Mac’s annual EPS growth actually averaged a spiffy 15% a year from 2015 through this year. Much faster than a tortoise, so my analogy doesn’t seem apt. But going forward, a more realistic EPS growth rate of 8-10% is more likely. And most damning, Farmer Mac is not “disrupting” an industry, like hare-like New Age realtor Redfin – “Our mission is to redefine real estate in the consumer’s favor”. Or like Meta Platforms – “We give people the power to build community and bring the world closer together. All of our products share the vision of helping to bring the metaverse to life.” Tortoise-like Farmer Mac just makes loans to Old Economy farmers and rural infrastructure projects.
Let’s see how the stock price race is going between the tortoise and these hares. First, Farmer Mac vs. Redfin:
Yahoo Finance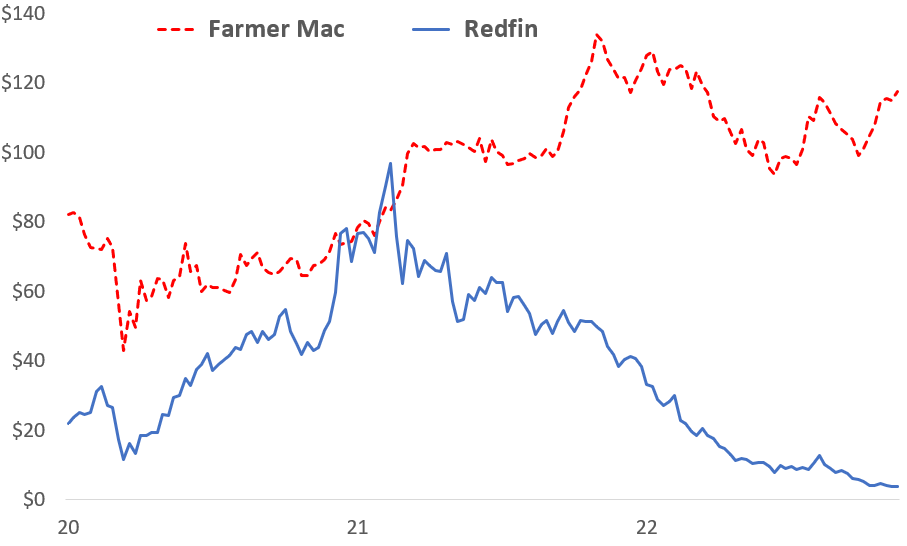
Sources: Yahoo Finance.
In December of 2020, I wrote an article for Seeking Alpha titled “Farmer Mac And Redfin: The Massive Earnings Gap”, marveling that Redfin’s stock had eclipsed Farmer Mac’s. At that point, I had price targets of $10 for Redfin and $150 for Farmer Mac. Redfin, at $3 today, has surpassed my dire expectations. Farmer Mac, at $115, is getting there.
Now Farmer Mac vs. Meta:
Yahoo Finance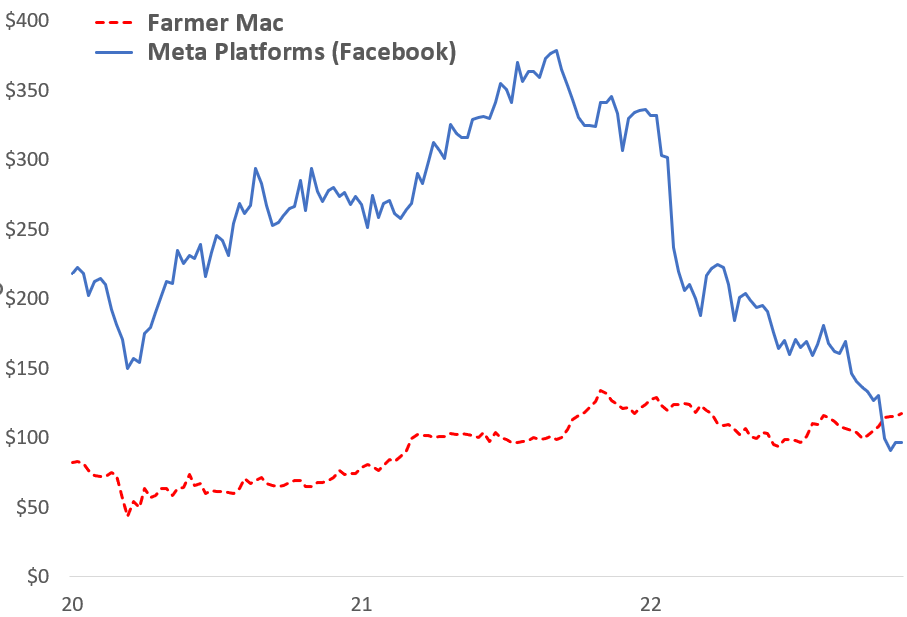
Sources: Yahoo Finance
I freely admit that I know little about Meta. But it provides another example of growth hype giving way to actual value.
Why Farmer Mac is a steady tortoise
We can thank the U.S. government. It has long been government policy, for both Republicans and Democrats, to support farming, particularly small and mid-sized farmers. Farmer Mac is one of the government’s tools to do so. Farmer Mac’s debt has the implied guarantee of the U.S. government, giving it cheaper debt costs than its competitor banks and other financial institutions. Farmer Mac has used that advantage to create a very safe and profitable business model that gradually takes market share.
I’ll give a quick update of Farmer Mac’s low risk strategy:
Low risk feature #1: Credit risk
Here is a history of Farmer Mac’s loan chargeoffs:
Farmer Mac investor presentation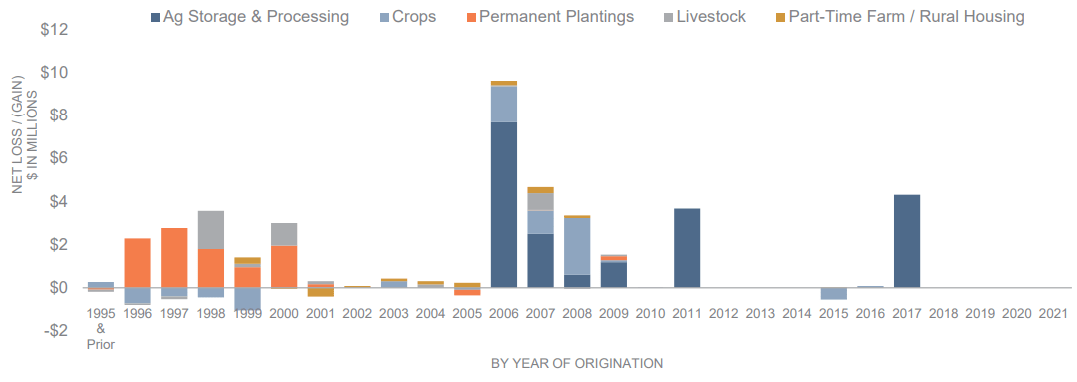
Source: Farmer Mac investor presentation
$4 million of losses over the past decade! For a company with over $20 billion of loans. A 2 bp lifetime chargeoff rate. Please let me know if you can find a lender with lower losses. I don’t know of any.
Farmer Mac achieves these results by maintaining very conservative underwriting standards, and is helped by other government subsidies to farmers when bad things arise, like droughts or trade wars.
Low risk feature #2: Interest rate risk
Here is a history of Farmer Mac’s interest margin, compared to two major banks:
Company financial reports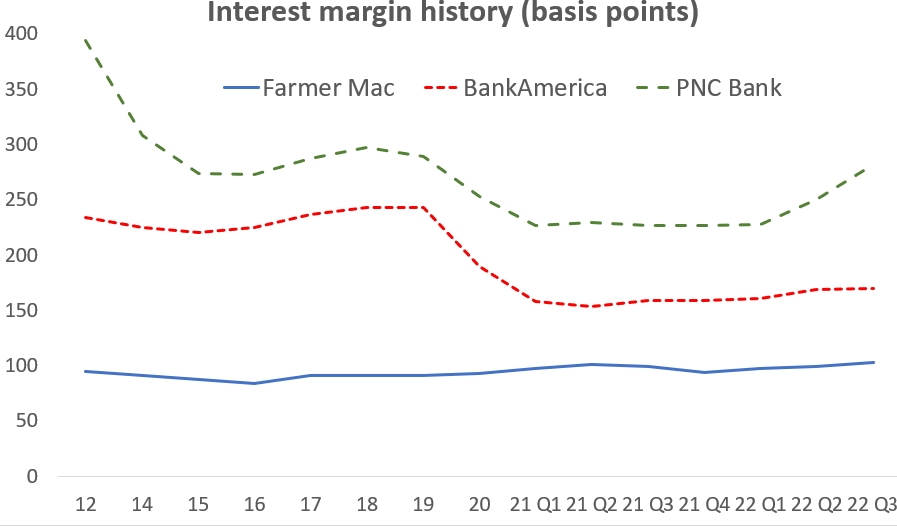
Source: Company financial statements
Yes, Farmer Mac’s interest margin is well lower than the banks. But interest rate risk is about the volatility of margins, not their level. Farmer Mac’s margin is by far the least volatile. Interest rates up, interest rates down, it barely makes a difference for Farmer Mac investors.
How does Farmer Mac do it? By careful hedging, including the rare ability to issue affordable callable debt, which is a great way to hedge against mortgage refinancing.
Low risk feature #3: Financial leverage
Regulators of financial institutions set capital requirements for those they regulate by assessing their credit, interest rate and other risks. As I discussed above, those risks are very low for Farmer Mac, and its regulatory capital requirements reflect that fact. But Farmer Mac consistently holds an increasingly large amount of capital in excess of its regulatory requirement, as this chart shows:
Farmer Mac investor presentation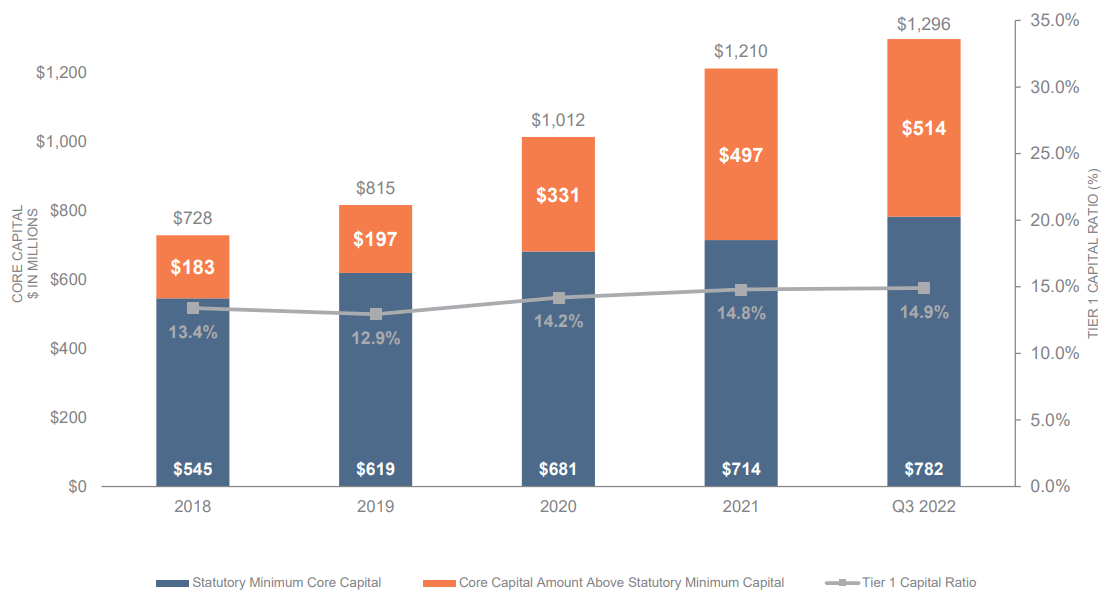
Source: Farmer Mac investor presentation
Normally, a company carrying significant excess investors’ capital generates a below-par return on shareholders’ common equity (ROE). But Farmer Mac earned an 18% annualized ROE during Q3, above the 15% returns of B of A and PNC.
Farmer Mac had an excellent Q3
Operating EPS was $3.07, 20% above the year-ago quarter. That above-normal growth was driven by:
- 13% earning asset growth year-over-year (YOY). Farmer Mac’s loan growth is volatile on a quarterly basis. But this quarter’s growth was unusually good because of a long-term and short-term driver. The long-term driver is an expanded marketing effort that Farmer Mac began several years ago. The short-term driver is greater turmoil in the bond market caused by the Fed’s rate increases. That turmoil favors more stable companies with more consistent access to the debt markets, like Farmer Mac.
- A 103 bp interest margin, compared to 99 bp a year ago. Farmer Mac is being helping by (1) more direct loans as opposed to structured securities. The loans have higher yields; (2) better loan pricing, again because of the bond market’s turmoil, and (3) higher yields on Farmer Mac’s cash reserves.
- Below-normal expenses, caused by non-recurring factors.
- Flat preferred stock interest. Management did not issue another preferred stock issue over the past year. I don’t expect another issuance for the foreseeable future.
I forecast ’23 EPS of $12.50, up 10% from this year
Here is my earnings model and assumptions.
Farmer Mac financial reports and my forecast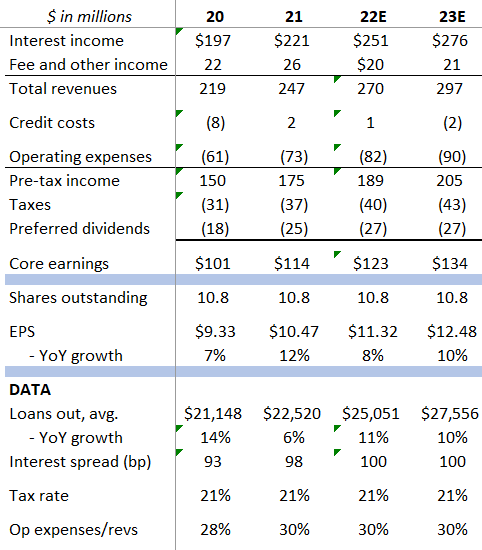
Source: Farmer Mac financial reports. Forecasts are mine.
My price target is $175. Could a catalyst be emerging?
That price target assumes a 14 P/E ratio on my $12.50 ’23 EPS estimate, up from a 10 multiple at present. In most industries, a safe 8-10% grower will command a much higher multiple. For example, McDonald’s (MCD) has a 36 P/E and Coke (KO) a 23 P/E. Both are expected to grow EPS more slowly than Farmer Mac over the next two years.
Some of you may be saying, “So Farmer Mac is cheap. So what? What’s the catalyst?”
Normally I hate that question. Catalysts are almost always difficult to identify, and supposed catalysts usually fizzle out. But another stock chart comparison has me intrigued. I’ve noted in prior Seeking Alpha notes that Farmer Mac was trading very much in line with KRE, a regional bank index. That hasn’t made much sense to me, but there it was.
But take a look at this update of the chart:
Yahoo Finance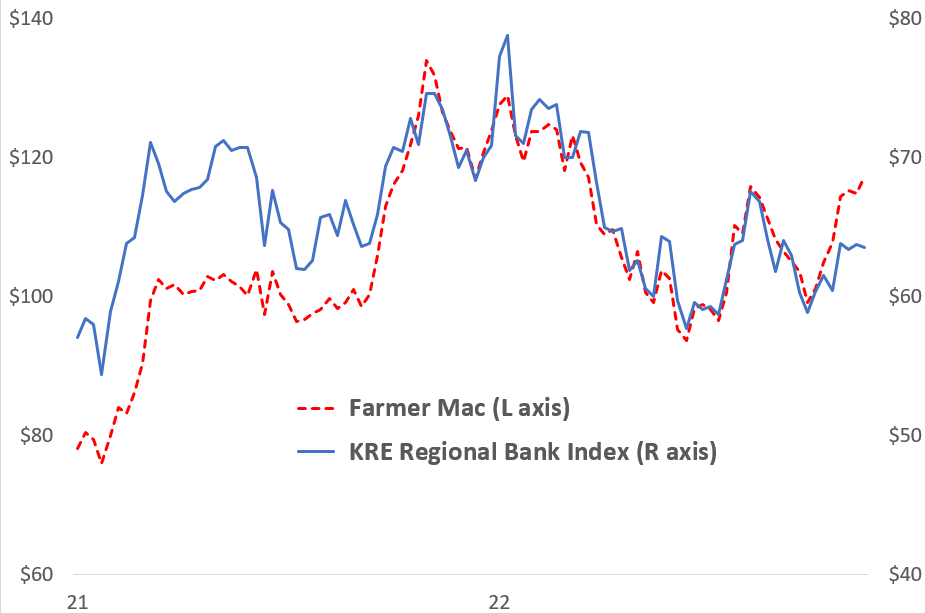
Source: Yahoo Finance
Farmer Mac has shown signs of breaking out versus the KRE. We’ll see what happens, but there is a glimmer of hope that Farmer Mac’s attributes are being recognized.
Be the first to comment