

FG Trade
Investment summary
Investors should be seeking to add a constant weight of quality and resiliency throughout cross-asset and equity focused portfolios in FY22. Portfolio construction should factor in stability of price returns as a defensive characteristic in the equity risk budget. Those names with mature growth cycles and in defensible industries such as healthcare may act as a stabilizer to equity returns on a forward looking basis.
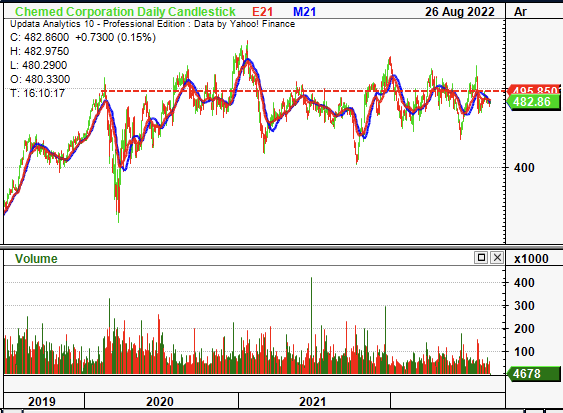
Exhibit 1. CHE 6-month price action, followed by CHE 5-year price action
Data: Updata Data: Updata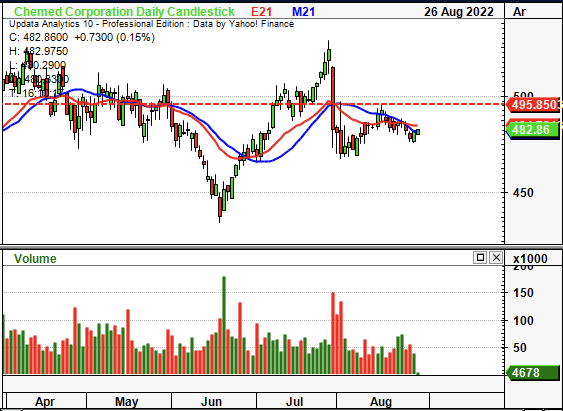
In that vein, we look to Chemed Corporation (NYSE:CHE), diversified provider of hospice and palliative care services in the US. We like the company’s ability to compound capital at 8.5% geometrically on a quarterly basis since FY15, and note that gross-to-operating margins have decompressed on a sequential basis in that time. We advocate to buy CHE if seeking to add a layer of resiliency into portfolios by clamping equity beta and smoothing equity returns. Shares look to be appropriately priced at 10.8x EV/book value and we set a forward price objective of $526.
Q2 earnings in-line with long-term trends
Second quarter earnings came in mixed with downsides relative to consensus at the top line. Consolidated revenue for CHE total was $531 million, down 20bps YoY. Segmentally, Vitas printed $298 million in net revenue ($305 million gross), down ~450bps YoY. The decline was underlined by a ~380bps YoY decrease in number of days of care, whereas acuity mix shift produced a 174bps headwind compared to the same time last year. Accounting changes to contra-revenue accounts coupled with the Medicare Cap also clamped revenue by ~10bps, with ~$2 million in billing limitations accrued during the quarter.
Meanwhile, the Roto-Rooter segment contributed $233 million to the top, up 600bps YoY. Upsides were seen from branch commercial revenue, up 750bps YoY. This carried through to aggregate commercial revenue growth across all segments, as seen in Exhibit 2.
Exhibit 2. CHE consolidated statement of revenues
Data: CHE 10-Q Q2 FY22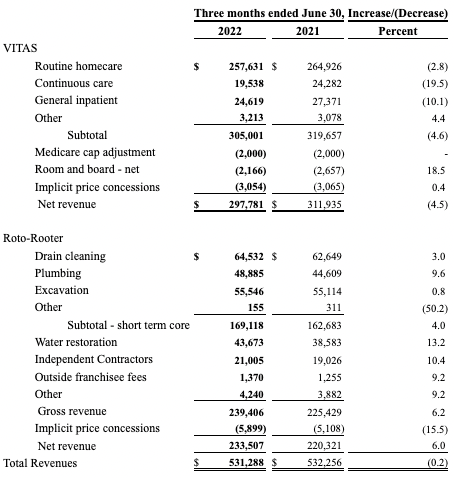
Resiliency is a key factor in CHE’s earnings quality, with seasonal trends in profitability and cash conversion. For example, operating metrics were back in range as well and remain seasonal in-line with capital budgeting cycles within the healthcare sector. As seen in Exhibit 3, gross profit and operating profit have remained resilient throughout the pandemic and came in at $88 million last quarter. Bottom-line fundamentals continue to strengthen too. It recognized GAAP EPS of $4.84, up 38% YoY. Meanwhile, the company printed $38 million in net-FCF, down 60% YoY, but in line with the seasonality in quarterly growth trends, as seen below. FCF yield also curled up to 4% in Q2 FY22, back in line with FY19 ranges.
Exhibit 3. Quarterly operating trends remain resilient and continue to lift on a seasonal basis.
Bottom-line fundamentals remain healthy
Data : HB Insights; CHE SEC Filings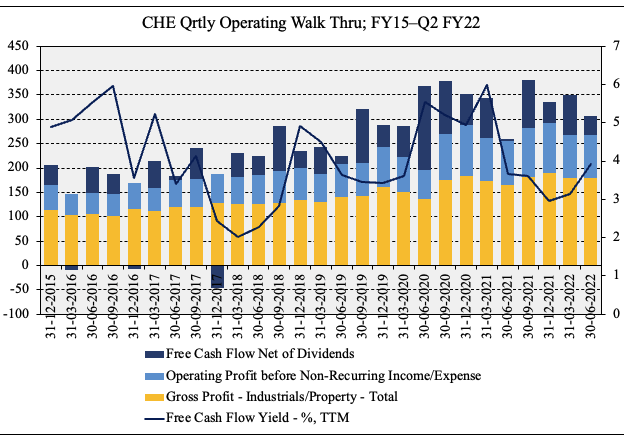
However, debt also increased $6m QoQ and $130 million YoY to that amount, whereas it also recorded ~$10.5 million in stock-based compensation and long-term incentive expenses for Q2. Furthermore, it entered into a five-year $550 million amended and restated credit agreement, built of a $100 million amortizable loan and $450 million credit revolver. It has ~$387 million remaining on this facility. In addition, it bought back ~$50 million of stock and has ~$125 million remaining under its buyback plan. Hence, quarterly FCF of ~$40 million and CFFO of $56 million are less attractive on this data.
However, the investment case for adding CHE into cross-asset and/or equity focused portfolios is centered around resiliency. We found that at least 76% of the CHE’s quarterly market cap is explained by the 8.5% CAGR in quarterly ROIC since FY15, as seen in Exhibit 4. It printed ROIC of 33% in Q2 FY22, providing greater certainty on the predictability of its future cash flows. We argue these demonstrated return on capital and profitability characteristics are inflected onto its share price, smoothing equity return.
For instance, 5-year historical standard deviation of returns is ~13% whilst 5-year beta to the benchmark is 0.51 (0.52 for 180 days).
Data: Updata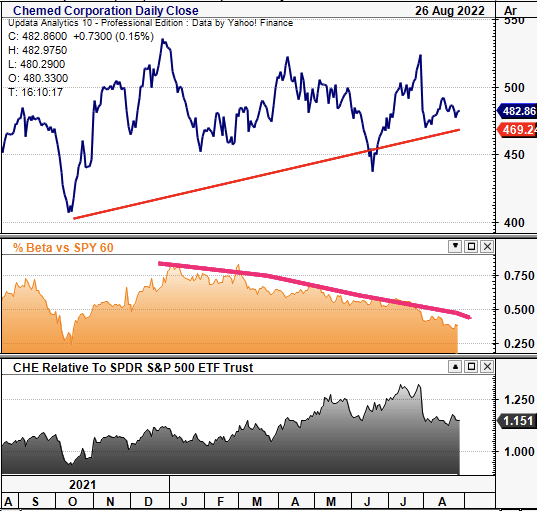
Meanwhile, 3-year price returns exhibit a Sortino ratio of 1.6, indicating the stability of returns. The down-shift in covariance structure is another attractive feature for portfolio inclusion, reducing equity bet on the tactical allocation side. In addition, the low-volatility of price returns will help to reduce portfolio variance and arguably acts as a hedge to volatility.
Exhibit 4.
Data: HB Insights, CHE SEC Filings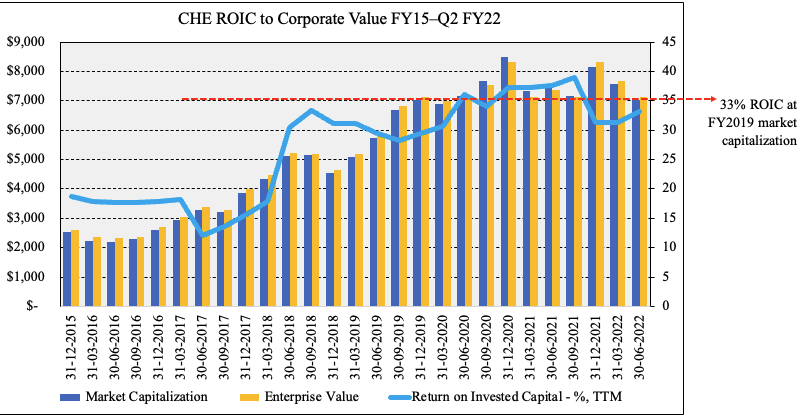
In that vein, further evidence of this ‘resiliency premium’ is noted below, where gross-operating margins have wound up sequentially since FY15. With margins expanding into a weakening economic outlook is a desirable characteristic, by estimate. It provides greater headroom to absorb cost inflation and reduces any pull or drain on liquidity from the same. With an improving revenue-cost mix in both operating segments, consolidated gross margin has hit all-time high ranges in the past 2-3 quarters, as seen below.
Exhibit 5.
Data: HB Insights, CHE SEC Filings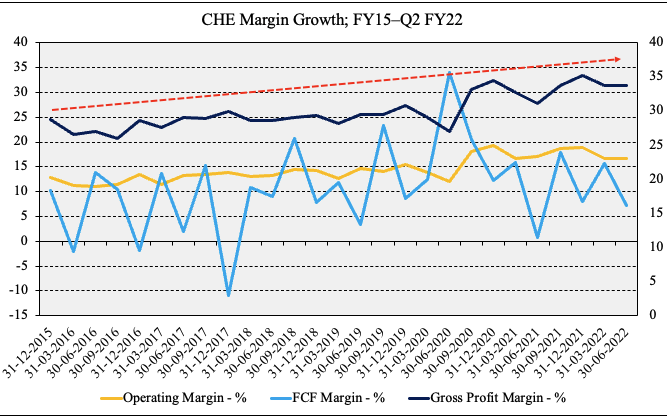
Portfolio backtesting
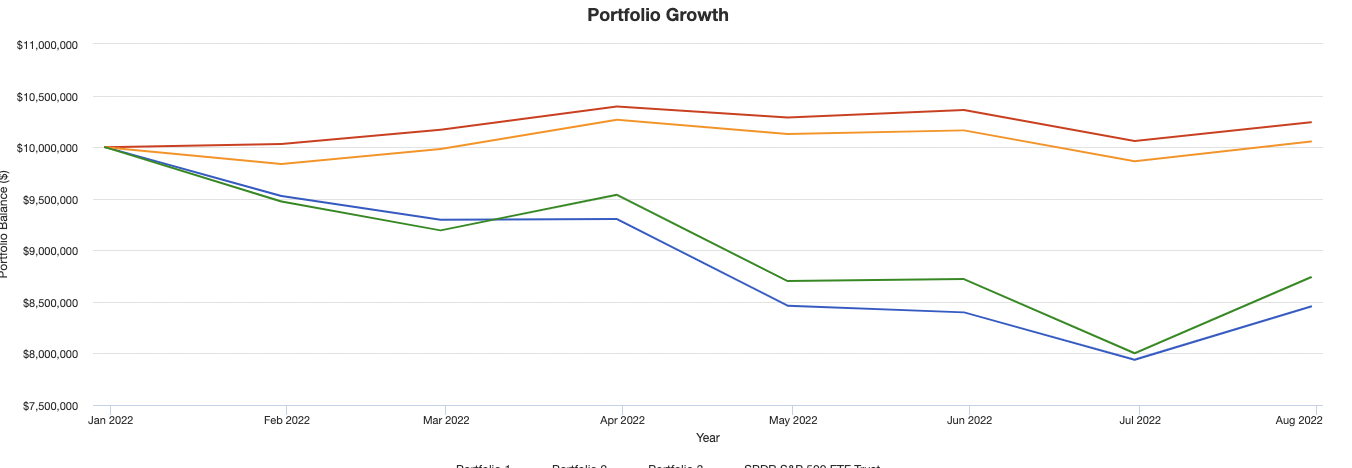
Balanced portfolios with broad asset exposure continue to outperform in FY22, as seen in Exhibit 6 (portfolio 2). Chief to the defensive nature of these setups has been exposure to commodities and alternatives with a reduced weighting to equity/bonds to reduce drawdown. CHE justifies its inclusion into this kind of setup with additional budget to equity risk.
From an equal weighted basis down to 2% weighting, a balanced portfolio with CHE in the equity bucket has seen a 0.54% return with 390bps drawdown since January FY22, as seen below in Portfolio 3. This has produced an alpha of ~12% relative to the benchmark with both positive Sharpe and Sortino ratios.
Exhibit 6. Portfolio testing results – CHE
Data: HB Insights, PortfolioVisualizer Data: HB Insights, PortfolioVisualizer Data: HB Insights, PortfolioVisualizer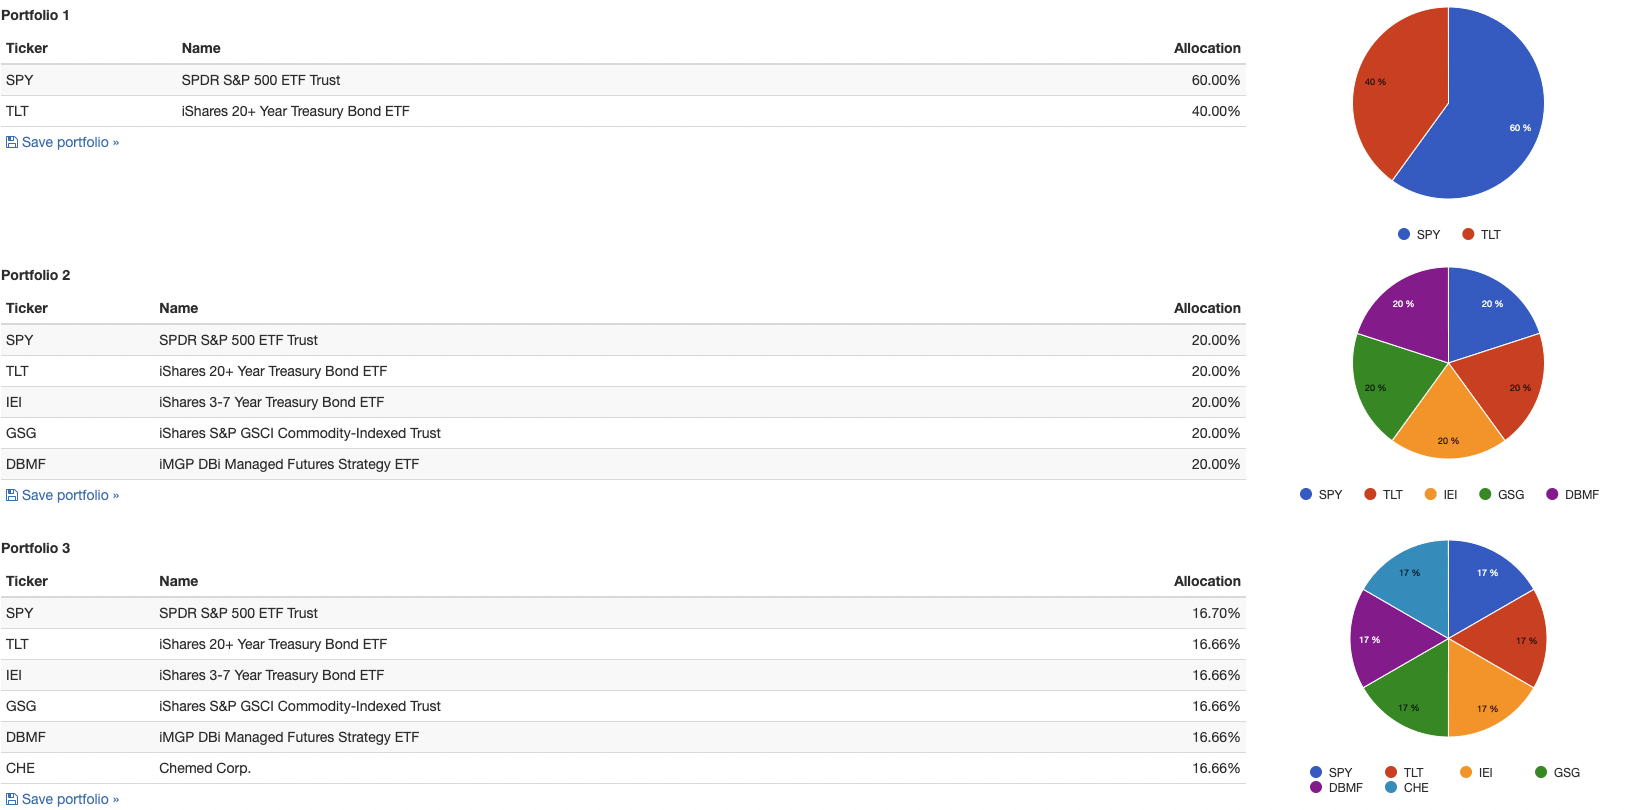

Valuation and Summary
Shares are trading at ~11.5x book value and in-line with 5-year normalized P/cash flow of 21.5x. Intangibles make up $683 million out of $1.3 billion in asset value and $685 million book value. Goodwill makes up $579 million of this, leaving tangible book value of just $105 million from this. It is also priced at ~10.8x EV/book value, whereas FCF return on equity comes to 38% for the T12M.
At 10.8x EV/book value we are theoretically paying $498.94 per share and $530 at 11.5x P/book, a premium of 3-10%. Moreover, our FCF ROE is 3.5% which brings the equity duration on the investment to 20 years on the stock. However, we note the market has priced CHE at 27x forward P/E which is ~9% ahead of the sector median, suggesting investors are expecting an above-industry result from the company.
Prescribing this 27x forward P/E to our FY22 EPS estimates of $19.51 sees a price objective of $526. Doing the same to FY23 estimates of $20.75 and discounting back at 12.5% sees a target of $498. This demonstrates that CHE might be fairly priced between ~$500-$530, and that we might be paying a fair and reasonable price at 10.8x EV/book value. We advocate CHE is a buy based on this and the culmination of other factors as a portfolio stabiliser to reduce variance of portfolio returns.
Be the first to comment