

AntonioSolano/iStock via Getty Images
Written by Nick Ackerman, co-produced by Stanford Chemist. This article was originally published to members of the CEF/ETF Income Laboratory on June 14th, 2022.
BlackRock Utilities, Infrastructure & Power Opportunities Trust (NYSE:BUI) has been having a tough year despite its energy and utility stock allocation. Energy and utilities are the only sectors left in the green for 2022. Utilities are just barely hanging onto their gains.
At the same time, the fund’s NAV performance has been stronger than the share price performance of this closed-end fund. By a significant amount too. That results in a fund getting a wider discount to its NAV per share or reducing the fund’s premium. In the case of BUI, this has meant the fund went from a strong premium to a discount. A discount has been quite rare for this fund in the last few years. The fund had traded at some deeper discounts before the last several years.
BUI Discount/Premium History (BlackRock)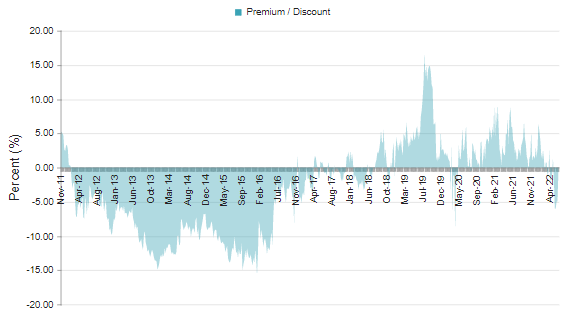
That puts it into a situation where the fund averaged a discount of around 3% over the last decade. At this time, the fund last closed at about a 1.3% discount, putting it relatively closer to its longer-term average. The fund has been swinging between a discount and premium price in this volatile market. We were at a nearly 6% discount just a few weeks ago. So these things can jump around a lot during times such as these.
Thanks to commission-free trading, it can allow an investor to take small bites into a position at a time. Dollar-cost averaging into this market appears to be a very viable option as we make new lows.
The Basics
- 1-Year Z-score: -0.93
- Discount: -1.32%
- Distribution Yield: 6.71%
- Expense Ratio: 1.08%
- Leverage: N/A
- Managed Assets: $484.35 million
- Structure: Perpetual
BUI’s investment objective is to “provide total return through a combination of current income, current gains and long-term capital appreciation.”
To achieve this objective, they have quite a bit of flexibility. They will invest “primarily in equity securities issued by companies that are engaged in the Utilities, Infrastructure, and Power Opportunities business segments anywhere in the world and by utilizing an option writing (selling) strategy in an effort to enhance current gains.”
From their website, they then continue to list every single thing under the sun that is at all related to utilities or infrastructure. Suffice it to say, it is a long description, and they leave almost nothing out, such as “producers of industrial and specialty chemicals” or even “semiconductor and equipment companies (such as solar panel manufacturers.).”
The fund’s managed assets have been falling this year, but not too dramatically, as it is holding up better than the broader market. However, due to the fund falling into a discount, they can no longer utilize the at-the-market offering. This helped grow the fund’s size, as we’ve explored in the past.
An ATM offering is a positive for shareholders. As it is done at a premium to NAV, it is accretive.
Performance – Solid Performance
Over the longer run, the fund has delivered solid results to shareholders. That is despite the allocation the fund has to energy, which would have been a detriment to performance in most years over the last decade.
BUI Annualized Returns (BlackRock)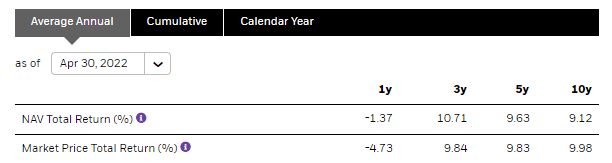
We can compare BUI to the SPDR S&P 500 (SPY) on a YTD basis. SPY isn’t an appropriate benchmark, but it can give us a better idea of where the fund is trading relative to the market.
As we can see, the fund’s share price is almost tied perfectly to what we see in the broader market. The fund’s total NAV return has clearly been holding up better. Again, this has opened up the current discount in the fund and the potential buying opportunity for a long-term investor.
YCharts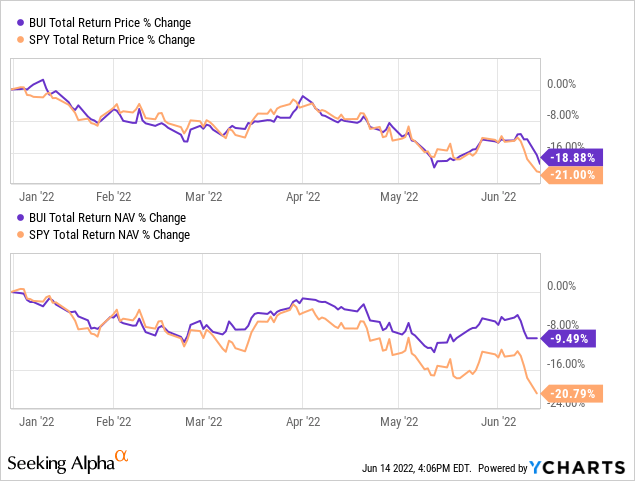
Utilities will likely continue holding up relatively well as we enter into a recession because it is a defensive play. That’s why that area of the market has been performing well up until this point, too. On the other hand, this has pushed the sector up to some premium valuations. That could explain some investors being hesitant to jump into BUI at this time. Still, I believe this premium will be given to utilities during this period of uncertainty. As a long-term focused investor, I don’t plan to reduce any utility exposure.
Distribution – Steady And Attractive
The latest declines have pushed the fund’s distribution yield to 6.71%. That’s higher than where the fund had been trading but certainly isn’t at an unreasonable level. BUI has never cut its distribution either since the fund’s inception, though the fund has only been around in a bull market. They initiated the distribution with a quarterly schedule before switching to the more attractive monthly payout.
BUI Distribution History (CEFConnect)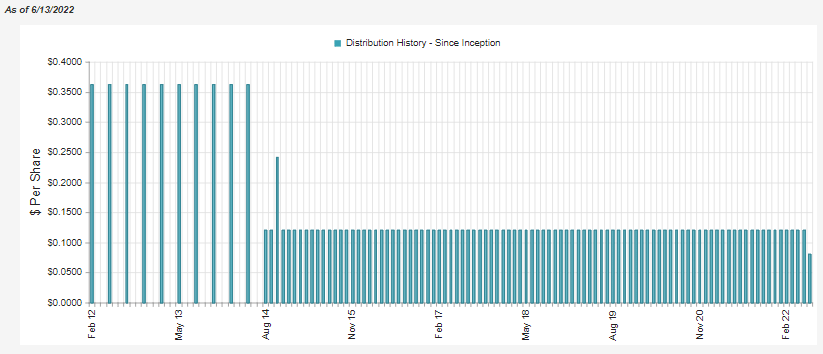
Note: The chart above is incorrectly showing a lower distribution. It has been maintained.
The fund utilizes an options writing strategy on individual stocks in its portfolio. That resulted in realized losses for the year, as it appears they had bought back positions not to have them called away. These losses were offset with realized and unrealized gains in the underlying portfolio.
Besides gains to fund the distribution to shareholders, the fund also generated a fair bit of net investment income. NII is simply the dividends and interest paid in the portfolio, then subtracting out the fund’s expenses. With the relatively lower expense ratio of BlackRock funds, there is more income left over for shareholders. NII coverage came into around 16.7%, a decline from the NII coverage of 22.9% in the prior year.
BUI Annual Report (BlackRock)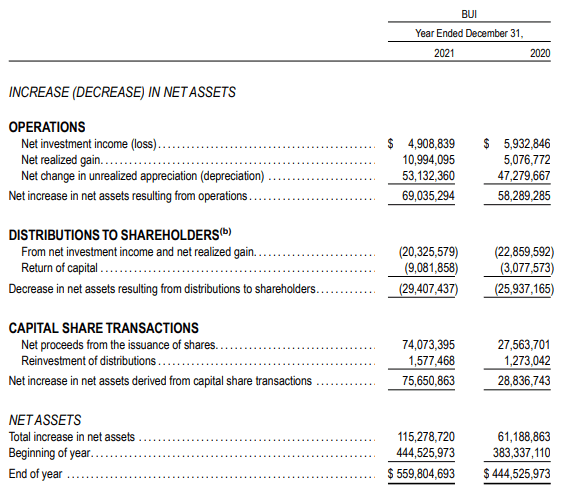
Now that we’ve been experiencing losses this year, I would expect to see that the options strategy is generating some capital gains. They shouldn’t be buying back these positions to close them to avoid having shares called away.
For tax purposes, BUI had identified the distribution contained a bit of every category in 2021. We have qualified dividend income, non-qualified income, long-term capital gains and return of capital. The return of capital appears to be for two reasons. One, the fund holds energy exposure, so some of the distributions can be classified as ROC itself. Second, the fund didn’t realize enough gains but still had plenty of unrealized gains. That meant that the ROC hadn’t been destructive.
BUI Tax Classifications (BlackRock (highlight from author))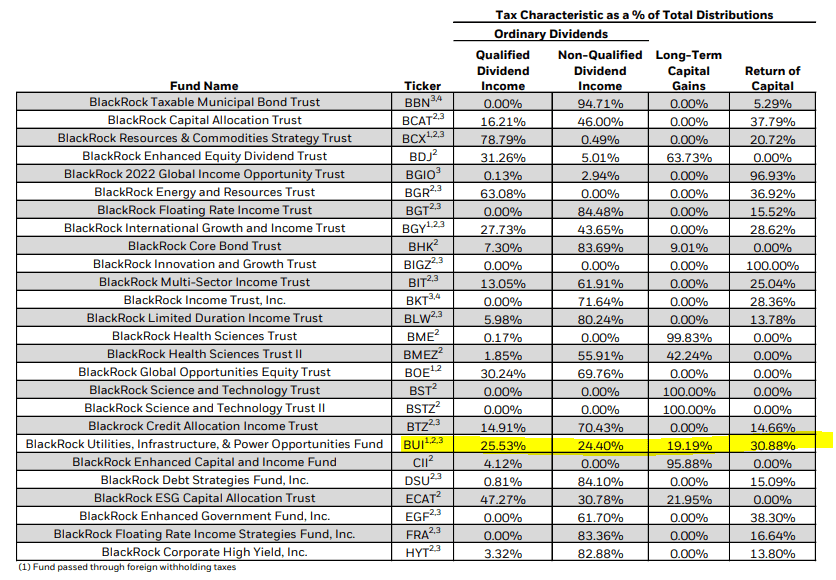
BUI’s Portfolio
One thing to note with the fund’s portfolio is that it is rather narrowly focused. At the end of March 2022, they listed just 57 positions. Other CEFs can have hundreds, even a thousand plus positions. That isn’t necessarily good or bad, but it does mean they are a bit less diversified. Each individual pick of the portfolio manager becomes more important. It can also mean that each buy and sell of the portfolio can generate a fair bit of turnover. Last year, they reported just a 20% turnover rate on the portfolio.
The portfolio is dominated by large-cap companies, primarily in the utility space. However, capital goods (industrials) and energy also have some meaningful allocations for the fund.
BUI Sector Breakdown (BlackRock)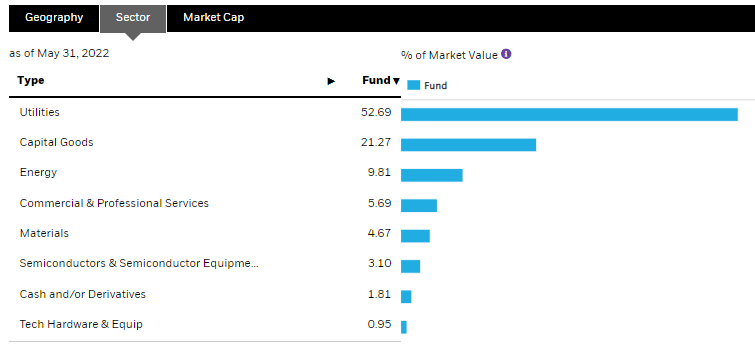
The portfolio isn’t just isolated to U.S. stocks, but it is the dominant geography of the portfolio.
BUI Geographic Allocations (BlackRock)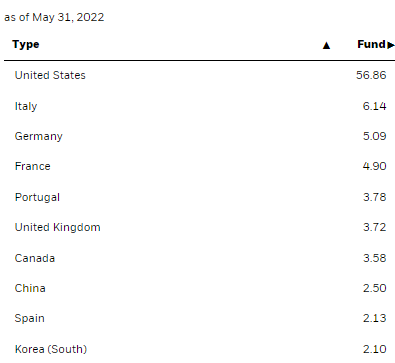
Neither the sector nor geographic exposure has shifted too much from our previous update on BUI. This tends to be the case with these lower turnover funds. Additionally, that would translate into the actual top ten of the portfolio being fairly static as well. In this case, the normal market gyrations likely play the largest role in shifts of allocations rather than the active management.
BUI Top Ten (BlackRock)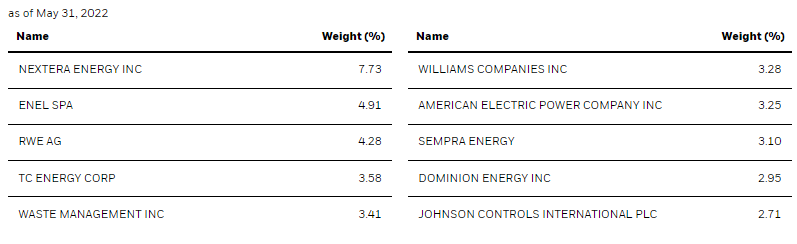
NextEra Energy (NEE) is still in the largest position in the fund. However, the weighting has come down from 8.27% to 7.73%. This still puts a strong emphasis on how BUI will perform with such a large allocation. BUI has been holding up relatively better than NEE this year. When comparing the correlation of BUI’s NAV and NEE’s price, there is a high correlation. In fact, it has become very correlated as we’ve traded through the year to become even closer.
YCharts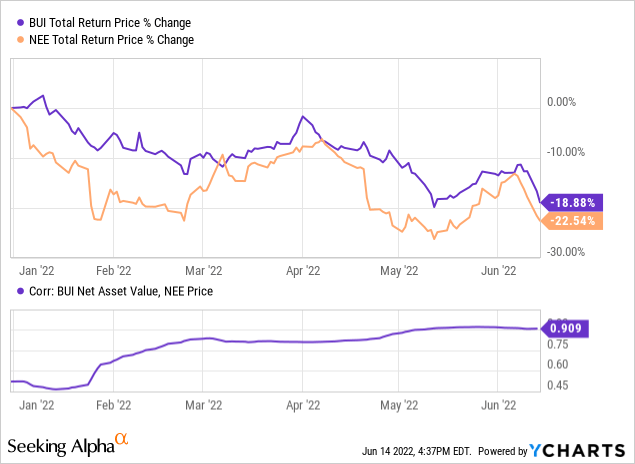
NEE is a richly traded utility position, as it is given a premium for its renewable energy focus. This is a position in my own personal portfolio too, so this is a name I watch quite closely. They had recently upped their EPS expectations for the next few years. They also expect that the dividend will grow around 10% through 2025. Despite this announcement, the stock still dropped for the day.
TC Energy Corp. (TRP) and The Williams Companies (WMB) have made their way into the top ten of BUI. TRP is a position that they had actively added to from the end of 2021 to the end of March 31st, 2022. They had owned 271,400 shares and then increased it to 335,000.
For WMB, they had 497,255 shares and, at the end of Q1, had upped it to a grand total of 499,055 shares. The relative appreciation of these names on a YTD basis has also likely increased the weighting in the fund. However, many of these gains have been given up lately as even energy has fallen victim to the bear.
YCharts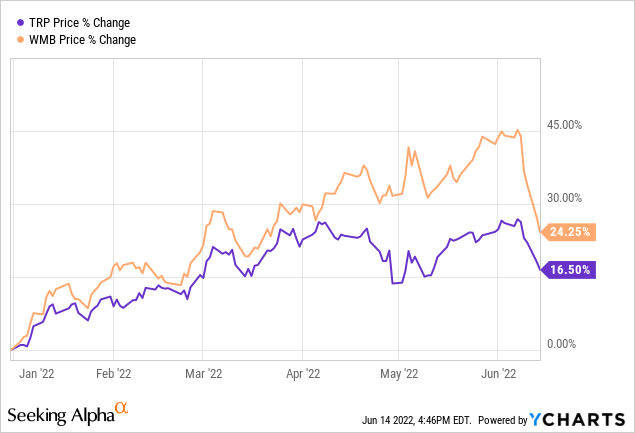
Conclusion
BUI is a non-leveraged fund that can be exactly what some investors want in this volatile environment. The fund’s exposure to energy and utilities has meant the NAV has held up relatively well, but the share price hasn’t held up any better than the overall market. Now that a discount has opened up on the fund, it could be considered more attractive. In this environment, it only seems that dollar-cost averaging makes sense. As you think you are getting a good deal one day, the market rewards you with an even lower one the next.
Be the first to comment