

cemagraphics
Written by Nick Ackerman, co-produced by Stanford Chemist. This article was originally published to members of the CEF/ETF Income Laboratory on November 24th, 2022.
Saba Capital Income and Opportunities Fund (NYSE:BRW) is now more than a year into its transition. As a quick reminder, BRW was the old Voya Prime Rate Trust that Saba took over last year. This was effective as of June 22nd, 2021, when Saba Capital Management took over as the advisor. Stanford Chemist has an article discussing the transition more in-depth. Any performance or reporting prior to this period was for a wholly different fund.
Since then, the fund has transitioned heavily into SPACs, which I found quite interesting and saw as a bit of a negative. Since that update, they’ve been transitioning more into other areas of the market. Albeit, the fund is still heavily weighted into SPACs as of their last reporting. So far, SPAC exposure through 2022 has meant better relative results – at least when compared to the broader market.
To facilitate that takeover, the activist team at Saba had built up a large position in what has now become BRW. At one point, the 13D filing heading into the takeover of the fund showed a 21.43% ownership in the fund, or nearly 26.1 million shares.
With the latest 13D filing, the ownership is down to around 9.6% or 4.082 million shares. This still represents a significant weighting, but they’ve also been selling quite regularly. In November, they sold four separate times.
BRW Saba Ownership (13D Filing)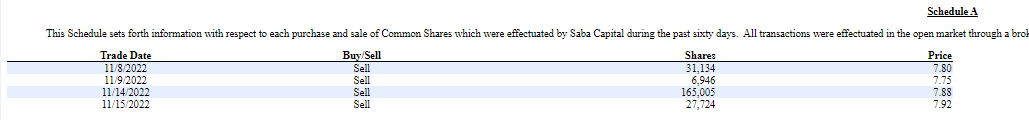
Overall, I don’t view this as a negative, even though some view insider selling as just that. The reason is that they are an activist group of investors, they’ve already conquered this fund, and it’s time for them to move on to better opportunities. That’s despite their own fund representing a fairly attractive opportunity at a large discount. One also gets exposure to some of their activist activities, too.
The Basics
- 1-Year Z-score: -1.09
- Discount: 10.02%
- Distribution Yield: 12.73%
- Expense Ratio: 1.38%
- Leverage: 41.27%
- Managed Assets: $387 million
- Structure: Perpetual
BRW has an investment objective to “provide investors with a high level of current income, with a secondary goal of capital appreciation.” Their website highlights that they will “invest in high yield credit.” They will also “opportunistically invest in other products, such as, closed-end funds and special purpose acquisition companies.” Then, finally, they will “also use derivatives where it believes it can achieve attractive risk-adjusted returns as a way to reduce portfolio risk.”
Since our previous update, they’ve also taken up more leverage through their credit facility. At the end of April 30th, 2022, they listed $112.5 million in outstanding borrowings. At the end of July 2022, this is now sitting closer to $160 million in borrowings.
BRW Leverage (Saba)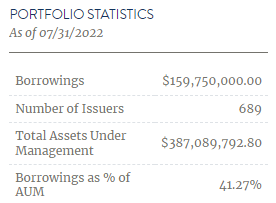
Their leverage is based on a spread above LIBOR. With LIBOR being discontinued, this will presumably transition to another benchmark interest rate, such as SOFR. Either way, the borrowings are based on a floating rate, which means that leverage expenses rise as interest rates head higher.
With significant SPAC exposure, this can be somewhat helpful. This would be because until SPACs find a potential business to combine with, they are in cash or cash-like securities such as Treasury Bills. With rising risk-free rates, the SPACs can return more than their usual $10 issue price or a couple of pennies when it potentially liquidates.
Performance – Holding Up Well
Another benefit to SPACs during this time is that they should hold around $10 until a deal is potentially found. Although, they can trade at a discount or premium similar to CEFs themselves. The discount/premium on the SPACs can become more volatile when a deal is announced.
However, just like a SPAC holder will benefit from higher rates to earn something while they wait for a potential deal, it also means one is holding a relatively stable asset. That has meant positive results on a YTD basis for BRW on a total NAV return basis. Compared to the broader market as measured by the S&P 500 ETF (SPY), it’s done incredibly well.
SPY isn’t an appropriate benchmark, as BRW is pretty free to invest where they see fit. That means across various asset classes, sectors and investment vehicles. It can provide us with some context, though.
YCharts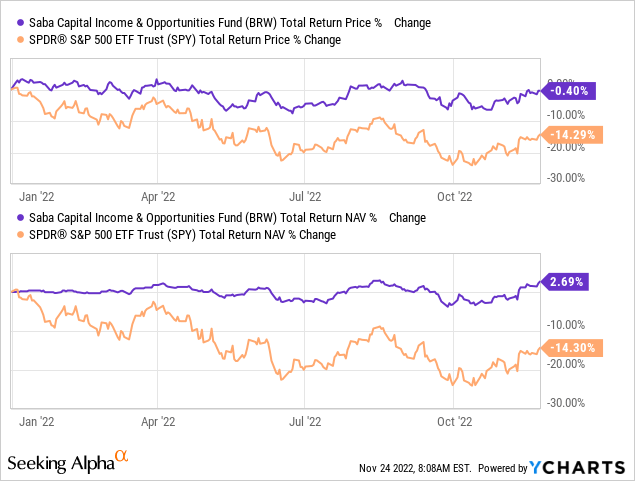
The fund has also done significantly better on a total share price basis. Still, even the minor underperformance means the discount has expanded YTD. It has actually expanded from around the 5% discount it was previously this year in the prior update to just over 10% now. I believe that’s what represents an interesting opportunity at this time.
YCharts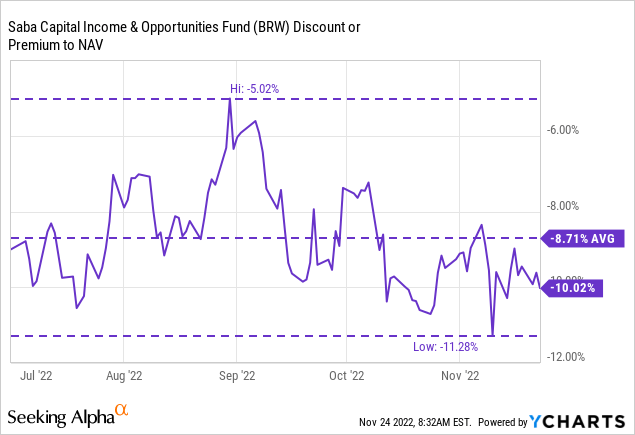
Distribution – 12% Managed Plan
The fund had implemented an 8% managed distribution plan initially; they then brought it up to 12%. This is adjusted monthly, and since the NAV level has declined somewhat through the year, it has generally meant a lower payout as each month passes.
BRW Distribution (CEFConnect)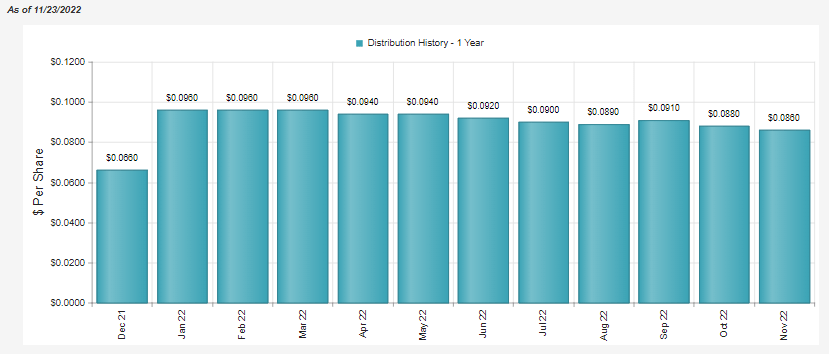
I expect this trend of lower payouts to continue. SPACs have meant a relatively more stable fund for this year, as we saw with the total return figures above. However, they aren’t likely to start generating the 12% returns required to maintain the same distribution.
At the same time, the managed distribution can bring predictability. If the NAV rises, you know the monthly distribution will also rise and vice versa. There should be little surprise in the direction of the payouts.
As they continue to invest capital, it should also lead to a better chance of covering their payout. In their last report, while quite dated, we saw net investment income increase relative to the prior fiscal year if we annualized the figure. The next annual report should be available sometime in early 2023, showing an updated look at the underlying earnings.
BRW Semi-Annual Report (Saba)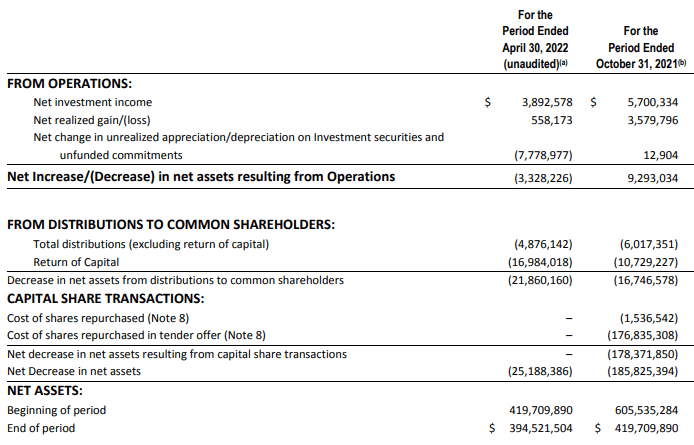
As a fund that is expected to invest in a hybrid portfolio, we should generally see NII and capital gains to fund the distribution. It will also remove some of the noise from the tender offer and share repurchases they conducted in the 2021 fiscal year.
BRW’s Portfolio
As I mentioned, the fund is still heavily invested in SPACs – at least according to the last data provided by the fund. Since it was from the end of July, considerable changes could have occurred during this time.
BRW Asset Allocation (Saba)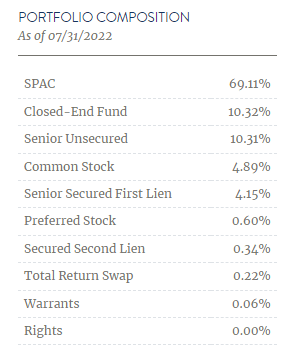
The nearly 70% SPAC exposure is a decline from the almost 80% it was carrying at the end of January. Since they’ve increased leverage during this time, some of the change is reflected in the ‘dilution’ of the SPAC weighting. It wouldn’t necessarily be that they reduced the number of SPAC holdings overall.
Since then, exposure has increased a bit more in CEF exposure, a higher amount of senior unsecured exposure and common stock exposure. Senior Secured First Lien exposure had ticked down a bit. The other values are of relatively limited impact and can be mostly disregarded at sub-1% weightings.
The top ten have seen some material changes.
BRW Top Ten Holdings (Saba)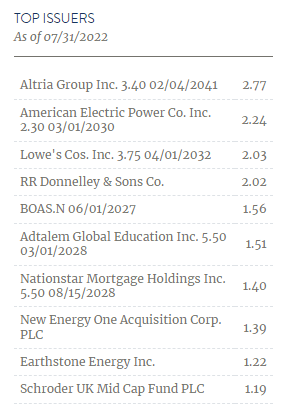
Previously, the top ten showed several SPAC holdings. Now, only New Energy One Acquisition Corp as a SPAC makes it to the top of the list. The top holdings now go to a 3.40% bond from Altria Group (MO) and a 2.30% bond from American Electric Power (AEP).
Despite the small increase in CEF exposure, the three CEFs that made the list last time are no longer here. One of them, the Salient Midstream & MLP Fund (SMM), was absorbed into the Salient MLP & Energy Infrastructure Fund (SMLPX). They were prodded along by Saba themselves.
That officially took place on September 13th, 2022, so it would have still shown up on this top ten but had slid down in weighting relative to these other holdings. Both N-PORT filings as of April 30th and July 31st show the same number of 528,128 shares of SMM being held at the time.
They also held the same number of PIMCO Energy & Tactical Credit Opportunities Fund (NRGX) shares at 254,162 in each filing. The other CEF position was the Miller/Howard High Dividend Fund (HIE), which again shows the same number of shares held in each period at 333,513. Therefore, the holdings would have still been there at the time, but differences in weighting mean they haven’t shown up in the top ten.
Conclusion
BRW is attractively valued at a deep discount. The fund carries significant exposure to SPACs, which has helped the fund through 2022. In fact, with higher interest rates, SPACs that liquidate can provide somewhat of a return at this point.
The other main reason to invest in BRW is for Saba exposure. The fund can benefit from the activist trades that the Saba Capital Management team undertakes. BRW was an example of one of those activist moves; SMM is a more recent move from the team that investors in BRW had exposure to, even if they didn’t directly hold SMM.
Be the first to comment