

kuppa_rock/iStock via Getty Images
As I documented in a previous article, BRT Apartments (NYSE:BRT) has been the 6th best performing REIT investment of the past 5 years.
In January, I expected Apartment REITs to outperform the REIT average.
Hoya Capital Income Builder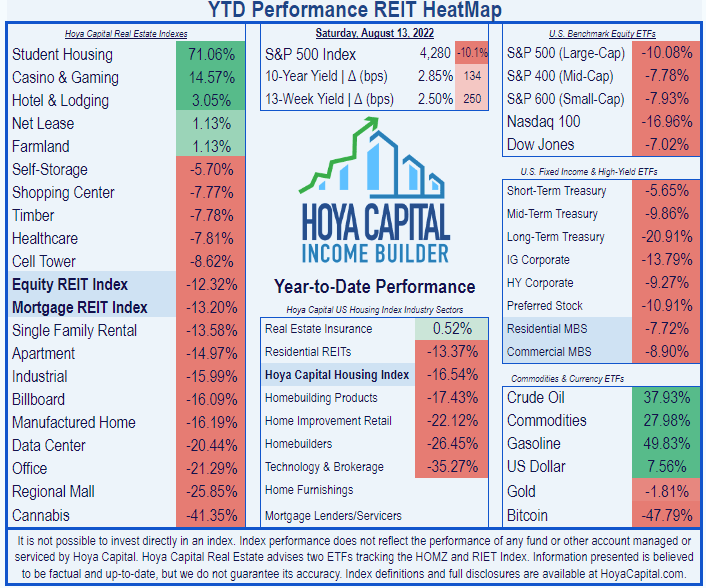
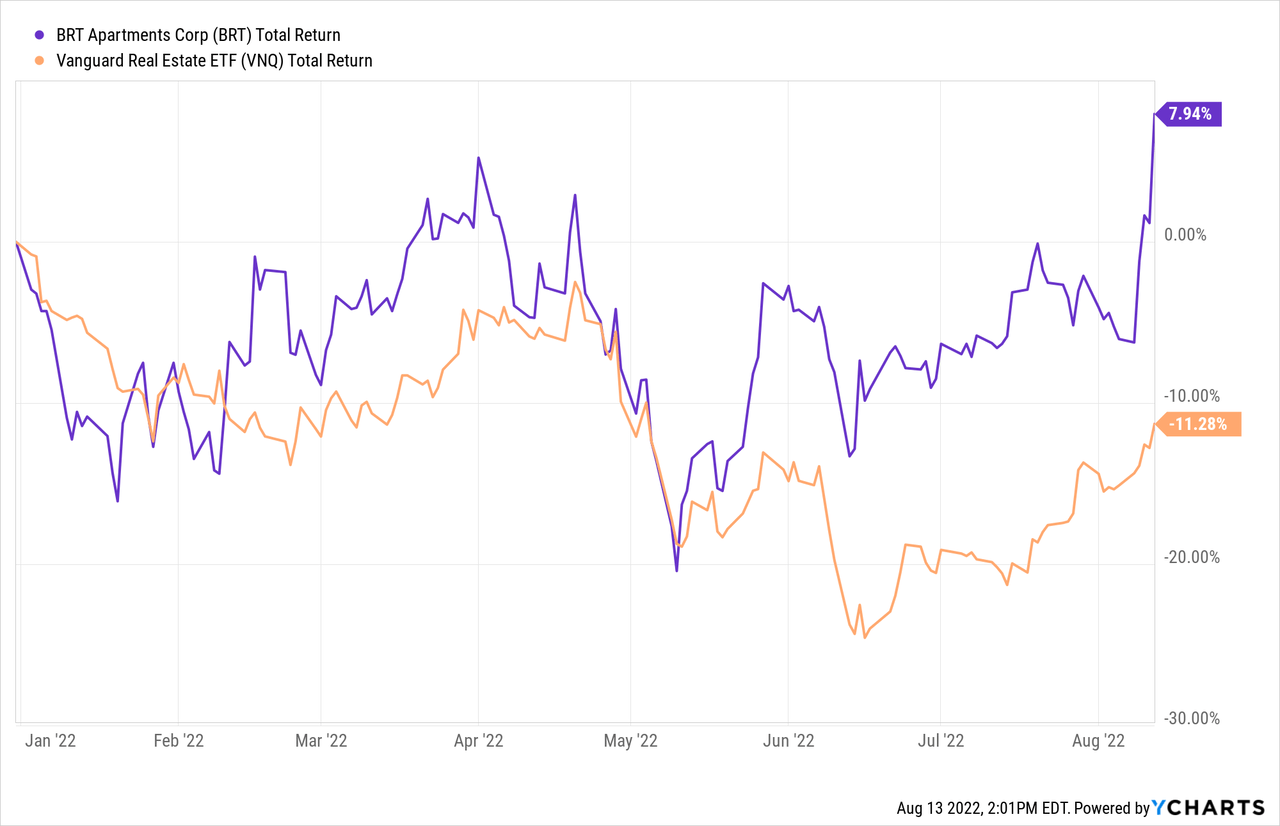
Although Apartment REITs, with a total return of (-14.97)% have slightly lagged the REIT average of (-12.32)% thus far, BRT is outperforming both, with a +7.94% return. Here is how it looks, compared to the Vanguard Real Estate ETF (VNQ), year-to-date.
Meet the company
BRT Apartments
Founded in 1972, and headquartered in Great Neck, New York, BRT Apartments shifted its focus to multifamily housing in 2011. Two things set this company apart from other apartment REITs:
- Their geographic focus, which has been on the Sunbelt from the start.
-
Their preference for joint ventures, rather than go-it-alone investments. According to the company’s website, they seek assets with 3 defining characteristics:
- Stabilized, undermanaged, or “value add” multi-family opportunities which would benefit from a capital improvement program and better hands-on management,
- Well located in areas showing positive indications of growth and which contain catalysts that promote employment and housing demand (e.g. universities, new commercial developments, airports, hospitals, and business centers), and
- In need of equity investment ranging from $2 million to $20 million.
Company investor presentation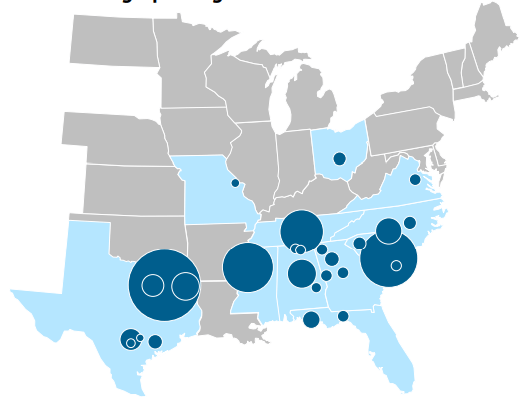
BRT owns interests in 33 properties in 11 states, with average rent of $1252 per month, and occupancy of 96.4%. Management has considerable skin in the game, owning 37% of shares as of April 21.
This company prefers to acquire class B or B+ properties and upgrade them, so the average building in their portfolio is 20 years old. This company is also adept at remodeling units to increase rent, at high cap rates.
Also, they have made a concerted effort to simplify their capital structure by buying out joint venture partners. As a result, their wholly-owned portfolio now includes 21 properties consisting of 5,420 units, approximately 3,800 units more than this time last year.
Quarterly results
From a revenue standpoint, BRT had a very strong Q2 2022. FFO of $0.37 and revenue of $14.58 million beat expectations by a wide margin. As CEO Jeffrey Gould put it on the earnings call,
We continue to benefit from strong fundamentals in most of our markets driven by ongoing population and job growth as well as the significant shortage of quality housing in many of these areas.
Highlights were as follows:
- Net income totaled $35.6 million, up from $6 million YoY (year over year). Most of this improvement resulted from BRT’s $40.1 million share of the gains from the sale of two properties owned by unconsolidated subsidiaries.
- Net income per share came in at $1.91 up from $0.34 YoY
- AFFO was $6.9 million, up from $5.5 million YoY
- AFFO per share came in at $0.37, up from $0.31 YoY
- Average occupancy for the entire portfolio was 96.1%, up 80 bps YoY
- Average rents came in at $1,252 per month, up 10.9% YoY
- Spreads on new leases registered 15.1%, and renewal spreads 10.7%, resulting in blended spreads averaging 12.6%
- Same-store NOI (net operating income) increased 9.4% YoY
- Bought out joint venture partners in 5 properties totaling 984 units for $34.2 million
- Sold two properties totaling 580 units for $159.6 million, and used some of the proceeds to retire $61.5 million in mortgage debt
- Reached agreement to sell a 204-unit property for $32.4 million in Q3, which will help retire another $12.1 million in debt
- Remodeled 107 units at an average investment of approximately $7,000 per unit, yielding an estimated annualized return on investment of approximately 46% (800 units still in value-add pipeline)
- Increased the share count by 137,000, which is less than 1%
Since June 30, BRT bought the remaining interest in joint ventures that owned five multifamily properties totaling 1,572 units, for an aggregate purchase price of $63 million, bringing the amount invested in buying out JV partners since March 31 to $97.2 million.
Growth metrics
Here are the 3-year growth figures for FFO (funds from operations), TCFO (total cash from operations), and market cap.
| Metric | 2019 | 2020 | 2021 | 2022* | 3-year CAGR |
| FFO (millions) | $12.0 | $17.0 | $17.4 | $20.5 | — |
| FFO Growth % | — | 41.67 | 2.4 | 17.8 | 14.05% |
| FFO per share | $0.74 | $0.99 | $0.97 | $1.24 | — |
| FFO per share growth % | — | 33.8 | (-2.0) | 27.8 | 18.78% |
| TCFO (millions) | $8.65 | $(-1.76) | $(-0.53) | $5.56 | — |
| TCFO Growth % | — | NA | NA | NA | (-13.70)% |
*Projected, based on H1 2022 results
Source: TD Ameritrade, CompaniesMarketCap.com, and author calculations
As you can see, the pandemic dealt BRT’s cash flow a serious blow, and slowed FFO growth to a crawl, but both FFO and TCFO are recovering nicely this year. FFO and FFO per share have grown by double digits over the past 3 years.
Yet despite its rapid growth, BRT remains a small-cap REIT, with a market cap of $0.48 billion.
Meanwhile, here is how the stock price has done over the past 3 twelve-month periods, compared to the REIT average as represented by the Vanguard Real Estate ETF, VNQ.
| Metric | 2019 | 2020 | 2021 | 2022 | 3-yr CAGR |
| BRT share price Aug. 12 | $14.28 | $11.14 | $17.77 | $25.25 | — |
| BRT share price Gain % | — | (-22.0) | 59.5 | 42.1 | 20.92% |
| VNQ share price Aug.12 | $90.61 | $82.15 | $106.18 | $101.72 | — |
| VNQ share price Gain % | — | (-9.3) | 29.3 | (-4.2) | 3.93% |
Source: MarketWatch.com and author calculations
Like most Apartment REITs, COVID hit BRT hard, and likewise, BRT came roaring back in 2021, and as noted before, has outperformed in 2022 YTD. Over the past 3 years, BRT has delivered a whopping 20.92% average annual share price gain, compared to the VNQ’s paltry 3.93%. And as we shall see below, BRT also out-yields the VNQ.
Balance sheet metrics
Here are the key balance sheet metrics.
| Company | Liquidity Ratio | Debt Ratio | Debt/EBITDA | Bond Rating |
| BRT | 1.70 | 38% | 30.8 | — |
Source: Hoya Capital Income Builder, TD Ameritrade, and author calculations
This is the main area of concern for BRT investors. The debt ratio is far above both the sector and overall REIT averages, and the Debt/EBITDA of 30.8 is downright absurd. Yet figures like this are common for this company, and have not prevent it from growing rapidly and gaining in share price. After all, BRT’s Debt/EBITDA at the close of 2021 was much worse, at 41.5
Available liquidity as of June 30 included $57 million in cash and equivalents, restricted cash of $4.8 million, and $35 million in available credit.
This company took on an additional net $85 million in debt in Q2, increasing their debt load by 34%. Total debt now amounts to $536.6 million, with a weighted average interest rate of 3.95%, and a weighted average remaining term to maturity of 7.8 years.
According CEO Jeffrey Gould on the Q2 2022 earnings call, BRT’s debt to enterprise value as of June 30 stood at 63%, up from 59.9% on March 31, but down from 75% at the close of pandemic-stricken 2020.
Dividend metrics
BRT outshines the average REIT in yield, and even more so the average Apartment REIT. Its daring 80% payout ratio earns it a grade of D for Dividend Safety, according to Seeking Alpha Premium.
| Company | Div. Yield | 3-yr Div. Growth | Div. Score | Payout | Div. Safety |
| BRT | 3.94% | 6.0% | 4.69 | 80% | D |
Source: Hoya Capital Income Builder, TD Ameritrade, Seeking Alpha Premium
So BRT’s payout appears to be a little bit too risky, yet the company never cut nor delayed its dividend during the COVID scare, and has raised the dividend twice since then.
—- Too Safe —————- Safe ———— Ideal ———— Too Risky
| A+ | A | A- | B+ | B | B- | C+ | C | C- | D+ | D | D- | F |
Dividend Score projects the Yield three years from now, on shares bought today, assuming the Dividend Growth rate remains unchanged, and BRT weighs in with a hefty 4.69.
Valuation metrics
Growth and dividend outperformance like this usually comes at a premium price, but BRT is priced as if it were a dead-average REIT, and slightly cheaper than the average Apartment REIT. This company is attractive, both to the value investor and the growth investor.
| Company | Div. Score | Price/FFO ’22 | Premium to NAV |
| BRT | 4.69 | 20.5 | (-9.5) |
Source: Hoya Capital Income Builder, TD Ameritrade, and author calculations
What could go wrong?
BRT Apartments is depending on continued rapid growth in revenue, to cover its burgeoning debt and its daring dividend. That, coupled with its small size, makes it vulnerable to unexpected shocks to the economy or to the REIT world.
BRT is a small fish in a big pond. Most apartment REITs have greater financial resources, making it tougher for BRT to compete for acquisitions.
BRT’s concentration of assets in the Southeastern U.S. and Texas creates risk as well as reward, in case that area takes an economic downturn in the future.
Joint venture partners may have competing interests, may fail to carry out their end of the bargain, may develop friction with BRT, and could go bankrupt.
Ironically, the better a joint venture performs, the greater the risk that profits over and above a negotiated threshold will be allocated disproportionately in favor of the joint venture partner.
Increases in taxes, utilities, and insurance premiums can affect the bottom line. BRT’s value-add strategy means the company has construction costs and time frames that may be overrun or delayed.
Investor’s bottom line
BRT is very good at what they do, and positioned for further rapid growth, with its Sunbelt-focused portfolio. Despite its indebtedness and its slightly risky dividend payout, this company has continued to grow and gain in share price. Insiders have bought $140,400 worth of shares in the past 3 months, according to TipRanks. BRT has earned a 34.43% return on equity and 72.31% asset growth in the past 12 months. I maintain a Buy rating on this company, but with a small allocation, due to its small size, vulnerability, and volatility.
Seeking Alpha Premium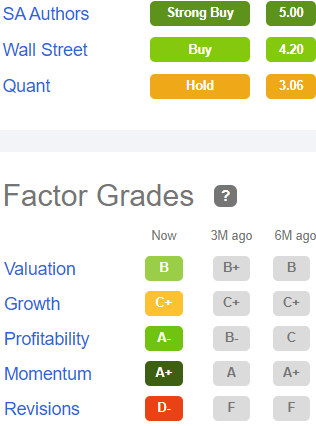
That puts me in company with 4 out of 5 Wall Street analysts, whose average price target for BRT is $28.25, implying only 12% upside. The Seeking Alpha Quant ratings system rates BRT a Hold, mostly due to unfavorable revisions.
The Street calls BRT a buy, and TipRanks thinks it will Outperform. Zacks maintains a Strong Buy. Your move.
Be the first to comment