

metamorworks/iStock via Getty Images Brookfield Asset Management
In this analysis of Brookfield Asset Management Inc (NYSE:BAM), we examined the company’s asset management business and analyzed its business relative to the industry in terms of financial metrics. Based on the industry metrics, we determined if Brookfield derives an advantage in the asset management industry.
Moreover, we have broken down its business into the different asset management markets based on its revenue streams and looked into its private equity business to determine its private equity capabilities in terms of its geographic reach and workforce around the world.
Lastly, we examined its hedge funds with the acquisition of Oaktree Capital and examined its investment strategies to determine its competitiveness compared to normal asset managers.
High Asset Management Revenue Growth at a Cost
The company is an asset management and buy-side firm with an AUM of $690bln and 2,100 institutional investors according to its annual report. We analyzed 27 companies within the asset management subindustry consisting of asset managers, private equity, and hedge fund companies to obtain the average 5-year net profit margin, employees and average revenue per employee to compare against Brookfield’s metrics.
|
Industry |
Net Margins (5-yr) |
Employees |
Revenue Per Employee ($ mln) |
Revenue Growth 5-year |
|
Asset Management |
16.32% |
13848 |
1.86 |
15.0% |
|
Brookfield Asset Management |
5.03% |
180000 |
0.45 |
26% |
Source: Brookfield Asset Management, Khaveen Investments
Based on the table, the company’s profitability is shown to be poor compared to the industry as its net margins are lower than the asset management industry average. This is because the company has a significantly higher 14 times the number of employees compared to the asset management average. According to its annual report, it has 180,000 operating staff which includes 1,000 investment professionals with a wide global reach in 30 countries across 5 continents. This is up from just 150,000 a year ago. As a private equity company, it requires employees to conduct due diligence to identify and verify investment opportunities and manage its portfolio. According to its annual report, it states the importance of its in-house expertise in the quote below. Overall, we believe its large workforce is a positive for its ability to carry out its business as its revenue growth is higher than the asset management subindustry average.
This in-house operating expertise developed through our heritage as an owner-operator is invaluable in underwriting acquisitions and executing value-creating development and capital projects. – Brookfield Asset Management Annual Report
Notwithstanding, while the company has superior revenue growth than average, the company incurs higher costs than its competitors (5.03%) with a lower net margin than average (16.32%). Additionally, we believe another weakness of the company is in terms of efficiency as its revenue per employee ($0.45 mln) is also lower than the industry average ($1.86 mln). Based on the industry average revenue per employee, we calculated its implied revenue with its number of employees to compare it against its actual revenue in 2021
|
Industry |
Employees |
Revenue Per Employee |
Implied Revenue ($ mln) |
Actual Revenue ($ mln) |
|
Asset Management |
13,848 |
1.86 |
||
|
Brookfield Asset Management |
180,000 |
0.45 |
334,379 |
78,182 |
Source: Khaveen Investments
Based on the table, its actual revenue ($78 bln) is significantly lower than its implied revenue ($334 bln) based on the industry average revenue per employee ($1.86 mln). We believe this shows its disadvantage relative to the industry with a lower revenue generation despite its higher employee count. In addition, we believe that although its revenue growth (26%) had been higher than the industry average, its lower actual revenue than the implied revenue shows a disadvantage for the company.
We calculated how much its revenue would be through 2031 based on its 5-year historical CAGR in the table below. Assuming its growth based on its 5-year CAGR, the company is expected to only reach its implied revenue in 2028. Additionally, we calculated the required growth rate for it to reach its implied growth in a 5-year and 10-year scenario. To reach its implied revenue by 2026, the required growth rate is 33.7% which is higher than its past 5-year CAGR. Though, in the 10-year period, its required growth rate is actually lower at 15.6%. Thus we believe the company may be setting itself up for the longer term through its human capital expansion.
|
Revenue ($ bln) |
2021 |
2022F |
2023F |
2024F |
2025F |
2026F |
2027F |
2028F |
2029F |
2030F |
2031F |
|
Brookfield Revenue |
78.2 |
98.4 |
123.9 |
156.0 |
196.4 |
247.2 |
311.2 |
391.8 |
493.2 |
620.9 |
781.7 |
|
Growth % |
25.9% |
25.9% |
25.9% |
25.9% |
25.9% |
25.9% |
25.9% |
25.9% |
25.9% |
25.9% |
|
|
Implied Revenue |
78.2 |
104.6 |
139.8 |
187.0 |
250.0 |
334.4 |
– |
– |
– |
– |
– |
|
Required 5yr Growth |
33.7% |
33.7% |
33.7% |
33.7% |
33.7% |
– |
– |
– |
– |
– |
|
|
Implied Revenue |
78.2 |
90.4 |
104.6 |
120.9 |
139.8 |
161.7 |
187.0 |
216.2 |
250.0 |
289.2 |
334.4 |
|
Required 10yr Growth |
15.6% |
15.6% |
15.6% |
15.6% |
15.6% |
15.6% |
15.6% |
15.6% |
15.6% |
15.6% |
Source: Khaveen Investments
Large Private Equity Business but Better Competitors
Brookfield Asset Management, Khaveen Investments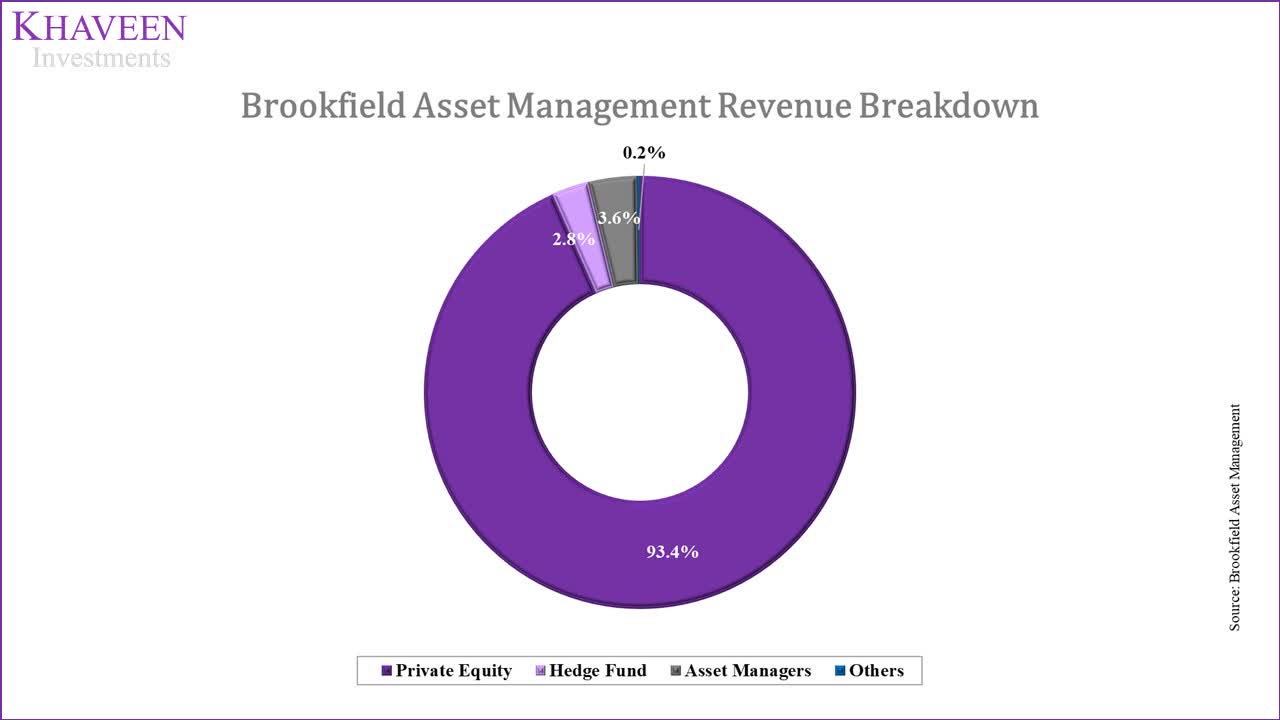
Based on the company’s annual report, we classified its reported revenue streams into the different categories within the asset management subindustry. Its private equity revenue contributions are the largest which we included its Renewable Power and Transition, Infrastructure, Private Equity, Real Estate and Residential Development segments. This is because the company’s funds acquire private assets and operate them. Its investors of the funds are institutional and accredited. For example, the Brookfield Real Estate Finance Fund VI with “50 limited partners such as pensions, financial institutions and labor organizations.”
According to its website, its operations span 30 countries and 5 continents which enables it to capitalize on attractive opportunities. As highlighted by the managing director of its Renewable Power & Transition Group, the company has capabilities and M&A teams to identify investment opportunities across the globe.
We have operating and development capabilities as well as local M&A teams sourcing and identifying decarbonization investments across every continent. – Natalie Adomait, Managing Director, Renewable Power & Transition Group
In relation to its PE capabilities, we believe the company’s wide global reach supports the need for a strong workforce to conduct the diligence process for its investments to reduce risk. According to DealRoom CEO Kison Patel, there is generally less information for the target company as it is usually private investments instead of publicly listed companies where verified information is more readily available such as through SEC filings. Also, the private equity process may involve professional services such as accounting, tax and legal advisors to analyze the investment. For example, according to its annual report, a risk it faces is during the due diligence process where it may fail to identify liabilities prior to an acquisition which could lead to future liabilities for the company.
Furthermore, we compared the company against other private equity companies including Carlyle Group, Ares Management, Blackstone and StepStone in terms of their revenue, margins, employees, and revenue per employee to determine if Brookfield has an advantage over its competitors.
|
Company |
Revenue ($ mln) 2021 |
Net Margins (5-yr) |
Employees |
Revenue Per Employee |
5-yr CAGR |
|
Carlyle Group Inc (CG) |
8,782 |
7.52% |
1,850 |
4.75 |
31.02% |
|
Ares Management Corporation (ARES) |
4,212 |
7.54% |
2,100 |
2.01 |
27.41% |
|
KKR & Co. Inc. (KKR) |
25,009 |
21.63% |
3,238 |
7.72 |
57.39% |
|
Blackstone Inc. (BX) |
22,176 |
23.60% |
3,795 |
5.84 |
34.74% |
|
StepStone Group Inc. (STEP) |
1,360 |
25.71% |
758 |
1.79 |
|
|
Brookfield Asset Management |
81,281 |
5.03% |
180,000 |
0.45 |
25.89% |
|
Softbank (OTCPK:SFTBY) |
52,747 |
20.76% |
58,786 |
0.90 |
-7.84% |
|
3i (OTCPK:TGOPF) |
3,954 |
89.04% |
234 |
16.90 |
12.3% |
|
TPG Inc (TPG) |
4,976 |
– |
1,013 |
4.91 |
|
|
Average |
22,722 |
25.1% |
27,975 |
5.03 |
25.8% |
Source: Company Data, Khaveen Investments
Based on the table, Brookfield is the largest by size with the highest revenue compared to the other private equity competitors. Despite its larger size, its profitability is disappointing with the lowest net margins compared to the others. Additionally, its revenue growth in the past 5 years (25.89%) is also the second-lowest and only ahead of Softbank and 3i. However, 3i has the best profitability among the rest (89%) followed by StepStone (25.71%) and Blackstone (23.6%). Impressively, Blackstone also had the highest revenue growth. StepStone has the lowest number of employees which shows its lean structure while Blackstone has the highest revenue per employee which we believe highlights its high efficiency as it is the highest among the competitors. For Brookfield, its revenue per employee is the lowest as its employee count is the highest which we believe shows its disadvantage compared to competitors.
Positive Hedge Fund Business but Insignificant Contribution
Besides private equity, the company has expanded into hedge funds with the acquisition of a 61.2% stake in Oaktree Capital Group in 2019 in a $4.8 bln deal. According to the website, “the firm emphasizes an opportunistic, value-oriented and risk-controlled approach to investments in credit, private equity, real assets and listed equities.” The firm, as a hedge fund, utilizes complex strategies in its investment process. We believe this differentiates hedge funds and other asset management firms due to the relative greater difficulties of replicating such strategies. According to TIME, there are around 12,000 hedge funds in the world. The total AUM for hedge funds was $4.5 tln which is lower than the total of $119.5 tln for the top 500 largest asset managers.
For example, the following excerpt from its annual report describes its complex investment strategies for its credit portfolio which represented 53% of its total AUMs in 2021.
Oaktree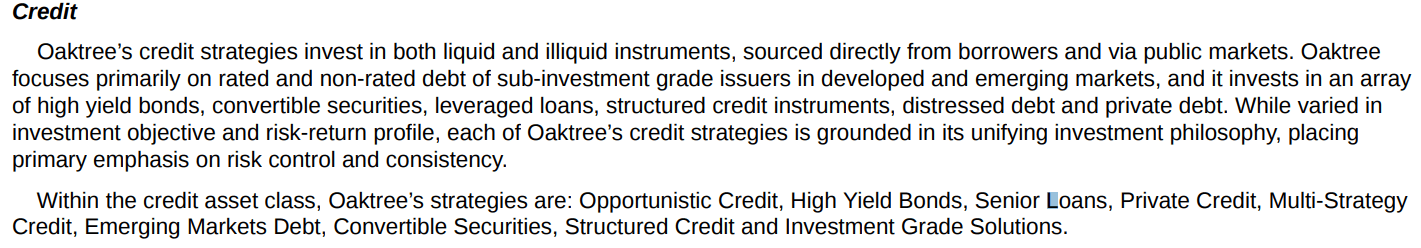
Source: Oaktree
We compared 27 companies within the asset management industry to further break down into 3 markets which are asset managers, private equity and hedge funds to compare and determine the benefit of Brookfield to expanding into the hedge fund market.
|
Markets |
Net Margins (5-yr) |
Employees |
Revenue Per Employee |
|
Asset Managers |
17.86% |
7804 |
1.19 |
|
Private Equity |
15.97% |
35790 |
3.35 |
|
Hedge Fund |
10.40% |
1141 |
2.08 |
Source: Khaveen Investments
Based on the table, we see that hedge funds have the lowest net margins among the 3 markets but are close compared to private equity while asset managers have the best net margins. In terms of employees, hedge funds appear to have the leanest business structure with the lowest number of employees and highest revenue per employee. Relative to hedge funds, asset managers cater to the larger retail mass market which we believe may require greater administration costs for those investors while hedge funds’ investor base is comprised of larger accredited investors. Moreover, another factor could be the larger number of funds for asset managers compared to hedge funds, which also leads to higher administration costs.
Overall, we believe the company’s hedge fund segment could be a positive driver for its revenue growth and increase its revenue per employee. However, as it only represents 2.8% of its revenue, we believe it is too small to bring a significant impact to the overall company.
Risk: Increasing Costs
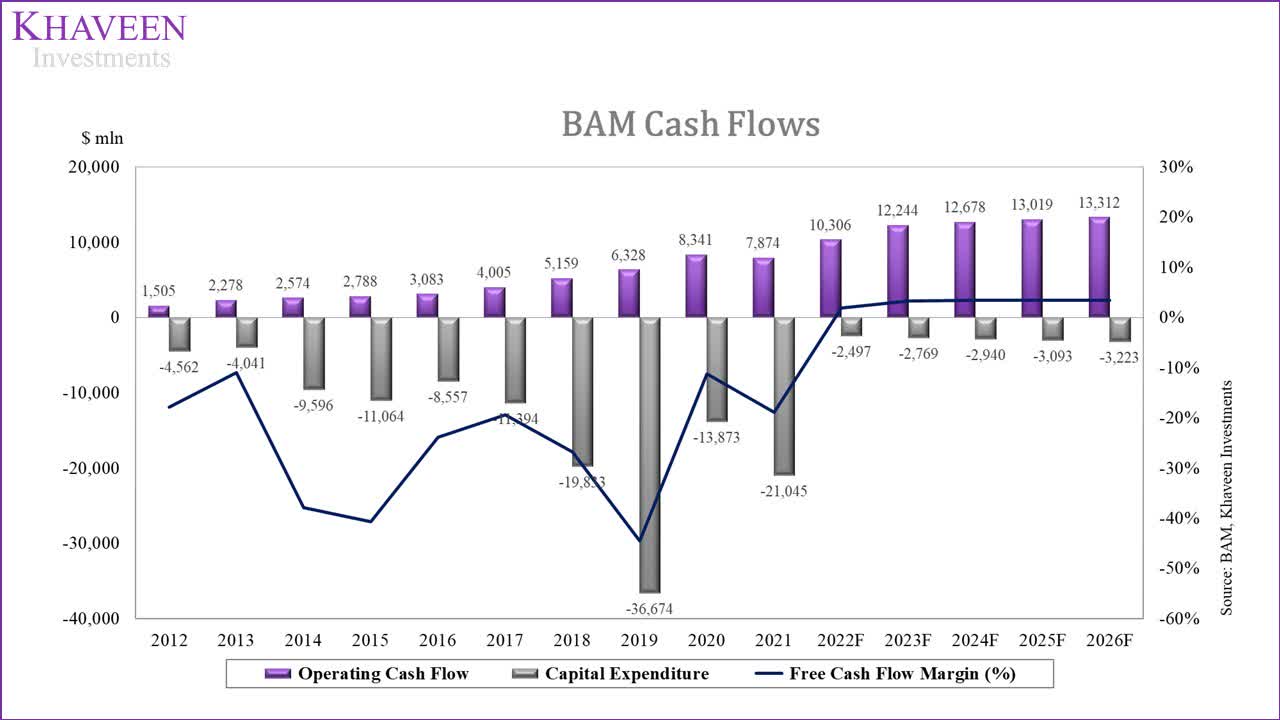
Brookfield Asset Management, Khaveen Investments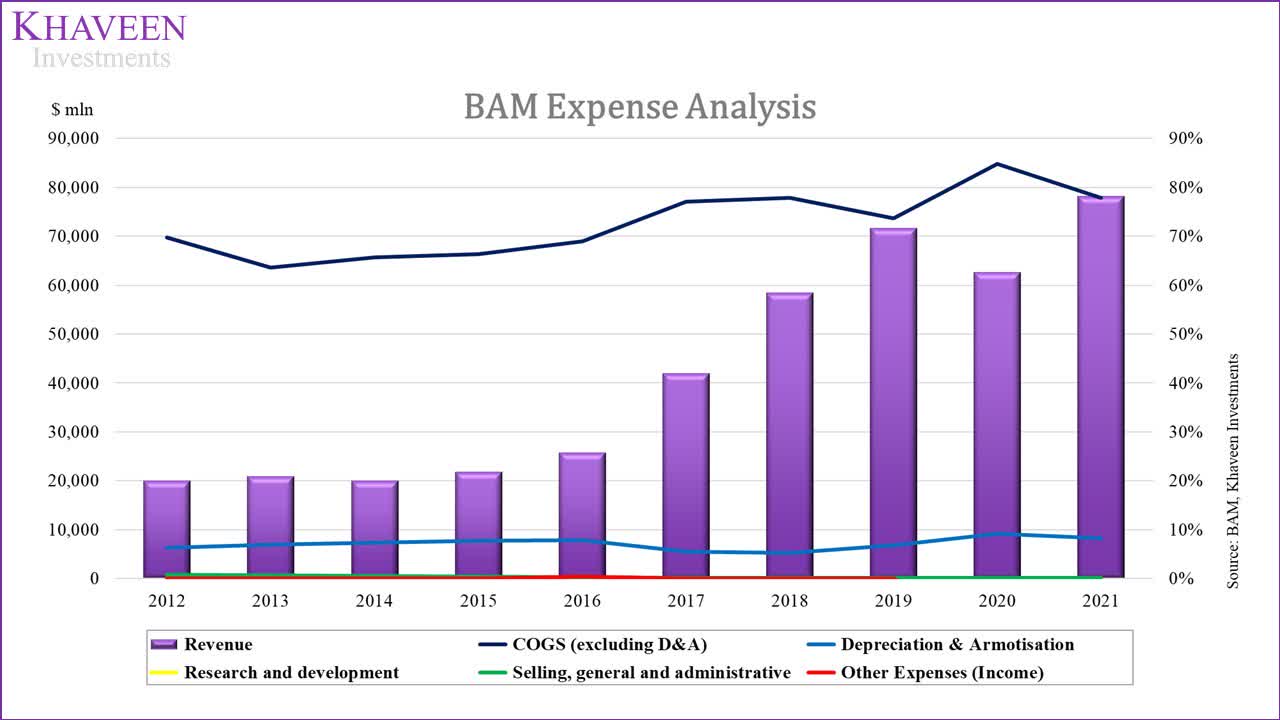
In terms of its expense analysis, the company’s largest expense is represented by its cost of sales which accounted for 77.9% of its total revenue. In the past 10 years, its cost of sales has increased from 70% of revenue in 2012. With its rising cost, its net margins declined from 6.9% in 2012 to 5.07% in 2021. Its average 10-year net margin of 6.8% is also lower than its 5-year margin of 3.68%. Overall, we expect its rising cost could pose a threat to its profitability which is already considerably lower than its competitors as mentioned in the points above which could be a disadvantage for the company relative to competitors.
Valuation
To project its revenue, we based its revenue growth on the asset management forecast historical CAGR of 14.88% in 2022 but tapered down to the asset management forecast CAGR in 2023.
|
Brookfield Asset Management Revenue Forecast ($ mln) |
2020 |
2021 |
2022F |
2023F |
2024F |
2025F |
2026F |
|
Revenue |
78,182 |
89,816 |
99,588 |
105,763 |
111,262 |
115,935 |
78,182 |
|
Growth % |
14.88% |
10.88% |
6.20% |
5.20% |
4.20% |
Source: Brookfield Asset Management, Khaveen Investments
To value the company, we used a DCF analysis as we expect it to have positive free cash flow going forward. In our cash flow forecast, we accounted for its capex projection based on the average PE company capex as a % of sales of 2.8% based on a 5-year average instead of the company’s capex as a % of sales which we could not identify as its financial statements include cash flows associated with the investment activities of its funds under the acquisitions and dispositions items from its cash flow statement which we consider it as its core business activity.
Brookfield Asset Management Brookfield Asset Management, Khaveen Investments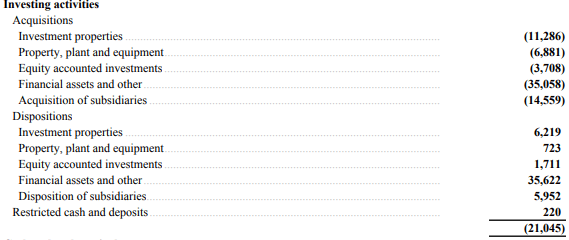
We based the terminal value on the industry average EV/EBITDA of selected private equity companies of 13.75x.
SeekingAlpha, Khaveen Investments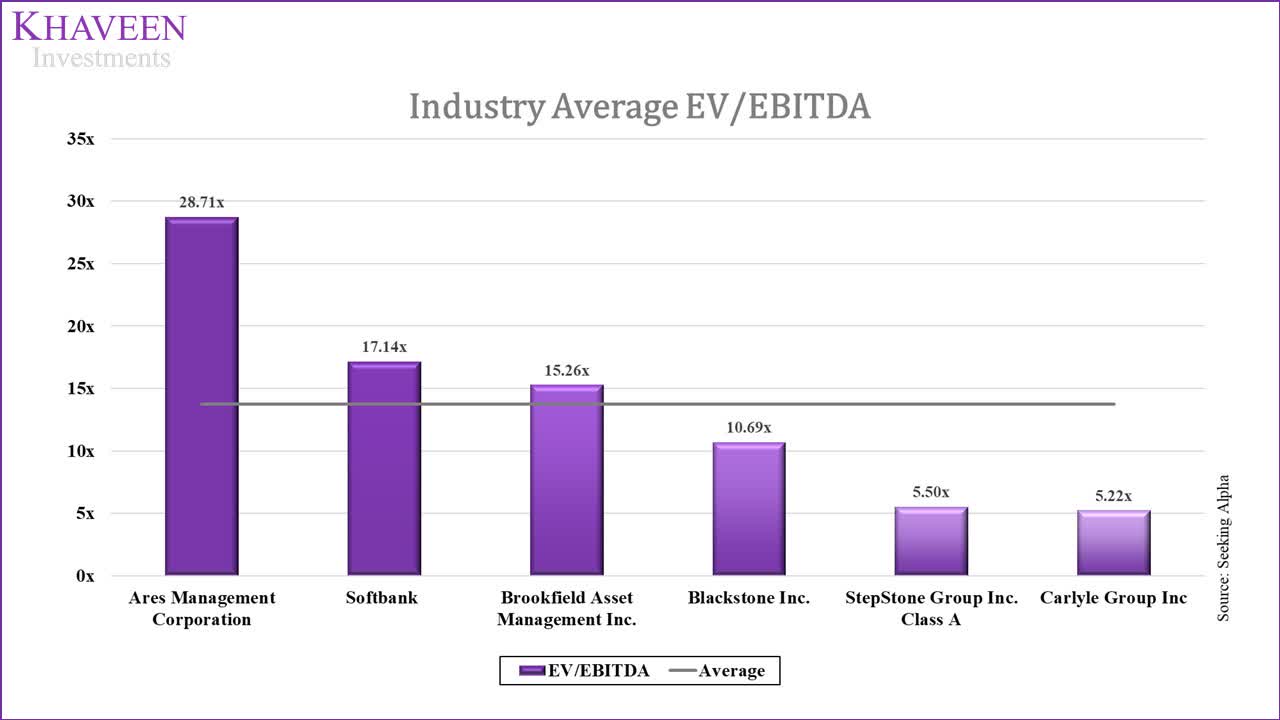
Furthermore, to obtain its debt, we excluded its non-recourse borrowings of managed entities and only accounted for its debt associated with the main company which includes corporate borrowings and deferred liabilities. Based on a discount rate of 11.6% (company’s WACC), our model shows its shares are undervalued by 27%.
Khaveen Investments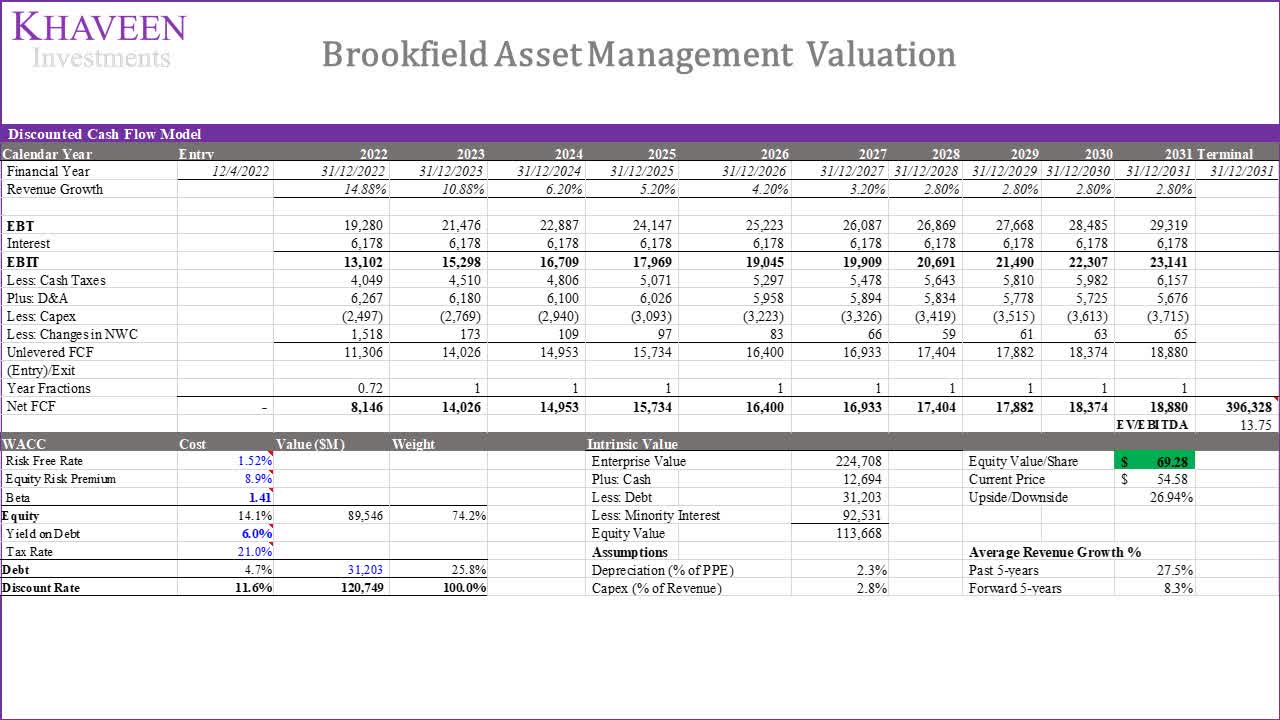
Verdict
To sum it up, we believe the company derives an advantage with its massive workforce to support its revenue growth as its 5-year CAGR of 26% is higher than the industry average of 15%. Notwithstanding, despite its high revenue growth, we believe its profitability and efficiency are weaker than competitors with lower net margins (5%) and revenue per employee ($0.45 mln) than the industry average. Moreover, we analyzed its private equity business which we believe its strong workforce could be an advantage for it to support its expansion and PE capabilities for due diligence. However, as its revenue growth and net margins are weaker than its private equity competitors with an average of 22% and 13.9% respectively, we believe this places it at a disadvantage. Lastly, while we believe its hedge fund business expansion through the acquisition of Oaktree to provide a benefit to it as we determined the hedge fund’s average revenue per employee ($3.21 mln) to be higher than private equity ($2.62 mln), we expect it to be insignificant to the overall company as it only accounted for 2.8% of revenue in 2021. Overall, we rate the company as a Buy with a target price of $69.28.
Be the first to comment