

carebott
Broadstone Net Lease (NYSE:BNL) owns and manages a diversified portfolio of single-tenant commercial real estate properties that are net leased on a long-term basis to tenants in the industrial, healthcare, and restaurant industries, and to a lesser extent, to tenants in the retail and office sectors.
The company continues to benefit from favorable portfolio metrics, which include strong cash collection rates that have consistently been at or around 100% over the last two years. In addition, occupancy is effectively maxed out with average lease terms (“WALTs”) in excess of ten years.
These prime metrics result in predictable and stable cash flows. Elevated exposure to the healthcare sector also provides an additional defensive buffer against unfavorable economic conditions.
And even during challenging periods, such as through the COVID-19 pandemic, battle-tested tenants in their restaurant sector have provided further credence to the portfolio’s durability and resilience.
Increasing exposure to industrials, which are among the most in-demand property types, serves as a counterbalance to the more defensive aspects of their portfolio.
Despite strong portfolio metrics, shares are down over 30% YTD and almost 40% over the past year. Lower volumes and general investor apathy in the stock are a few contributors to this. And given the limited opportunities for internal growth, this is understandable; But only if shares were trading at higher multiples than where they are currently.
At just 11.3x forward funds from operations (“FFO”), it appears shares have pulled back too far, given continued strength in quarterly earnings results. For investors seeking a low-cost addition to their net leased real estate holdings, BNL offers an attractive entry point at current pricing.
Portfolio Size Continues To Expand Despite The Challenging Acquisition Environment
At the end of September 30, 2022, BNL’s total portfolio consisted of 790 properties, seven of which are in Canada, with the remainder in the U.S. Overall, this is up from 764 properties at the end of the second quarter. And YTD, their property count is up 69 across 22 U.S. states and four Canadian provinces.
Q3FY22 Investor Supplement – Quarterly Summary Of Key Portfolio Statistics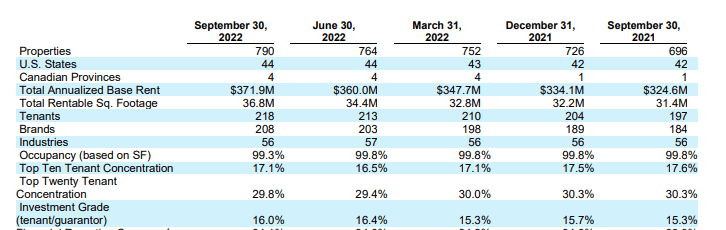
In the current quarter, the company acquired a total of 27 properties at an initial cap rate of 6.5%. This is slightly better pricing than Q2, where acquisitions came in at a 6.4% rate. In addition, the WALT on their current period signings was 20.9 years versus 19.9 years. Annual escalators on base rents, however, were down slightly to 2% from 2.1%.
Among the tenant mix, the focal point continues to be directed towards the industrial sector, with the property type accounting for over 95% of the square footage signed during the current period. This would be a build to their Q2 signings in the sector and a further realignment from Q1, which was more heavily weighted to signings in the restaurant sector.
Increasing Exposure To Industrials, Though Restaurants Still Account For A Top Share Of Rents
Overall, their current tenant representation includes a diversified mix from five primary industries, though exposure continues to be heavily weighted towards the industrial and healthcare sectors, who together account for nearly 70% of total annualized base rents (“ABR”), with industrial exposure, itself, at about 50% of ABR.
Still, even with the outsized exposure to industrials, their top two individual industries as a percentage of total ABR are healthcare facilities and restaurants, who account for a combined 30% of total ABR. This presents some concentration risk in an otherwise diversified portfolio, mainly due to the higher risks associated with restaurants.
Q3FY22 Investor Supplement – Summary Of Top Five Industries By ABR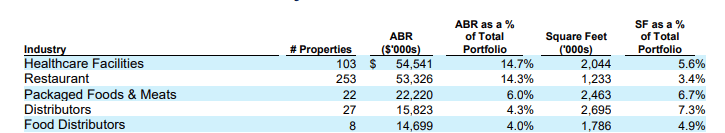
Some Risks Relating To Their Comparatively Weaker Tenant Base
While the restaurant industry has held up better than expected over the last two years, as supported by BNL’s consistent 100% cash collection rate, it does face labor-related challenges, which can ultimately feed into operator performance if inadequately managed. As it is, the industry already operates on low margins. As wage pressures further eat into these margins, less could be available to meet reoccurring rental obligations.
The risks are further amplified by the fact that over 75% of their exposure to restaurants is via master leases, which are leases of multiple properties to a single tenant. As such, a tenant failure or default under one of these arrangements could reduce or eliminate rental revenue from multiple properties, resulting in the impairment of such properties.
In addition, the portfolio has a low composition of investment grade (“IG”) tenancy, at just 16% of the total portfolio. For comparative purposes, Netstreit (NTST), another single-tenant net lease REIT, boasts of an IG tenancy of over 60%. Though BNL hasn’t experienced any significant challenges due to operator failure, the risks are inherently higher.
In fact, in the current period, management noted a changeover in operators in one of their top twenty tenants, the Santa Cruz Valley Hospital. While there were no materially significant negative ramifications other than the build-in of a period of free rent relating to the restructuring of the lease to the new operator, the topic did serve as one of the primary discussion points during their conference call.
As part of the questioning, management commented on other tenants that may be on the credit watch list, as well as their impacts on overall rents. Though there are a handful of names that are being watched, they don’t add up to a material percentage of rent. But nevertheless, wage inflation and labor availability were cited as one current risk factor that is pressuring weaker operators.
An Adequate Level Of Counterbalancing Strengths
BNL’s overall portfolio continues to be well-diversified, despite their concentration to comparatively weaker tenants. No single tenant or brand, for example, represented more than 2.5% of total ABR at period end. At 2.4% of ABR, AHF LLC, which is a distribution and warehouse company, accounted for the largest share of ABR at period end.
Q3FY22 Investor Supplement – Summary Of Top 10 Tenants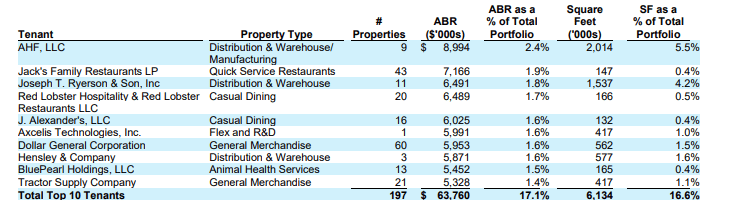
In addition, the company consistently generates positive cash from operations and maintains a solid balance sheet with moderate leverage amounting to just 4.8x adjusted EBITDAre on a pro forma net debt basis.
The debt ladder is also significantly weighted towards later years. And in the interim, coverage of fixed charges remains adequate at about 3.9x.
Q3FY22 Investor Supplement – Debt Maturity Schedule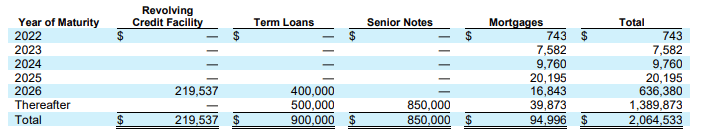
And for income investors, BNL provides a quarterly dividend payout of $0.27/share, which is up about 1.9% from the last payment made in October. Though the payout is fully covered by adjusted FFO, the payout ratio is on the high side at over 90%.
In later periods, continued earnings dilution through share issuances could result in stagnant AFFO growth, which ultimately will affect dividend coverage if the payout is further increased. But presently, that is not yet an issue. Investors should, however, be cognizant of the limited upside in the payout from current levels.
Shares Have Pulled Back Too Far
BNL’s full occupancy, 100% cash collection rates, and extended WALTs are a few key portfolio attributes that should provide investors with a high degree of confidence of the company’s staying power in a highly competitive landscape.
Current operating results continue to reflect a stable rate of YOY growth, led by further additions to their portfolio of properties. Given limitations to organic growth due to near-perfect portfolio metrics, external expansion is still their primary means of increasing revenues.
Sure, internal opportunities for improvement do exist. A greater number of rated tenants, for example, would be one area that could prove accretive. Limited near-term expirations, however, inhibit the company from turning over candidates with weaker financial profiles. In a more prolonged economic downturn, this could result in a greater risk of loss to the company.
Already, the company is dealing with a changeover in operators from one of their larger properties, the Santa Cruz Hospital. In later periods, other operators, particularly in the restaurant space, could also come under strain, especially if ongoing labor issues continue to pressure already-low margins. Their significant exposure to master lease arrangements only amplifies this risk.
Despite the concerns relating to their lower-quality tenant base, there has been little indication to date that any of their major operators are at financial risk. The current compression in their pricing multiple, however, perhaps says otherwise. On a prior analysis, shares were trading at about 14.5x, which was a reasonable multiple at the time.
But since then, the stock has fallen to a forward multiple of 11.3x. This appears to be overdone, considering positive earnings results that were paired with the reaffirmation of their acquisition targets and little in the way of immediate negative catalysts.
At a 15x multiple, shares would have implied upside of at least 30%, not including the returns from their dividend payout, which is currently yielding over 6.5%. For both income and share price-focused investors, BNL offers an attractive entry point at its current trading levels.
Be the first to comment