

anyaberkut
Broadridge Financial Solutions (NYSE:BR) is a leader in the investor communications industry as well as other technology driven solutions for the financial services industry. Broadridge has a healthy share of recurring revenue that allows management to have large revenue and profit base with which to count on each year.
BR Recurring Revenue (BR Q4 2022 Investor Presentation)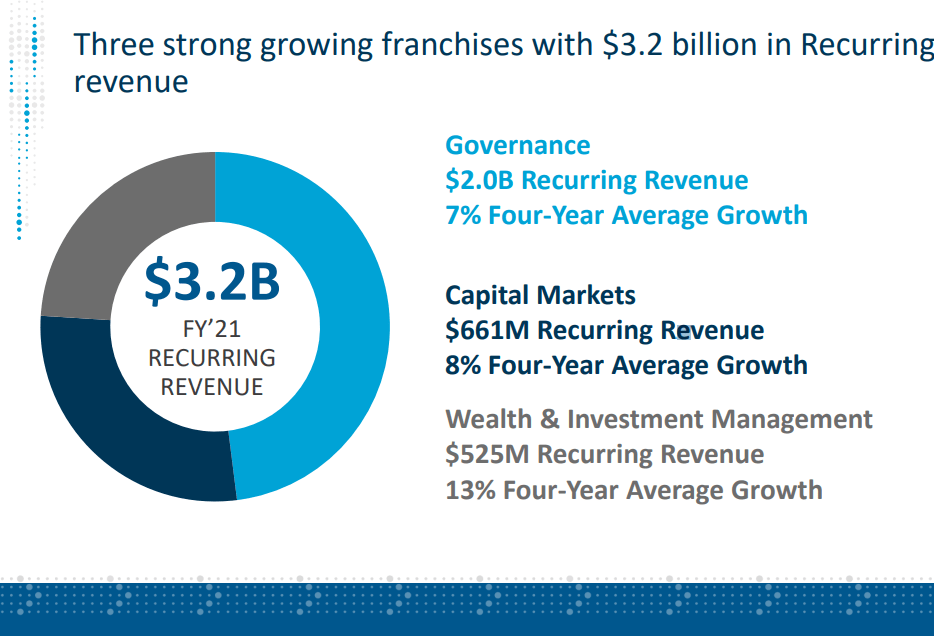
Recurring revenues represented ~65% of FY 2021 total revenues. On top of that recurring revenues have been growing at a healthy pace.
The Investor Communications Solutions is a wonderful boring segment that has little competition. Think delivering proxy materials and handing proxy voting for mutual funds, ETFs and equities. They help client companies ensure they are meeting regulatory requirements regarding investor communications.
The other segment is Global Technology & Operations which handles trade processing as well as wealth management functions.
Broadridge’s share price currently sits roughly 13% off it’s high from late 2021. Although shares were in the midst of nearly a 30% drawdown as of late June having since rebounded with the markets.
Dividend History
In my opinion a history of paying and growing dividends over time is one of the best ways to narrow down the list of potential investments. Companies that have consistently grown their dividend over time have proven themselves through both good times and bad and are likely also mature enough that they can afford to send some of their cash back to owners while still investing for the future. It’s not an end all, be all metric; however, I do believe it’s a good starting point.
Broadridge Financial Solutions Dividend History (BR Investor Relations)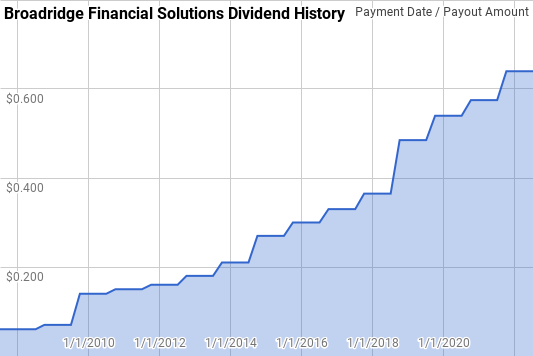
Broadridge has increased dividends to shareholders every year since being spun out of Automatic Data Processing (ADP) in 2007. Their dividend growth streak is up to 15 years which gives them the title of Dividend Contender.
Since 2007 Broadridge’s year over year dividend growth has ranged from 6.5% to 300.0% with an average of 38.8% and a median of 11.3%.
There’s been 11 rolling 5-year periods during that time with annualized dividend growth ranging from 13.9% to 60.6% with an average of 21.0% and a median of 15.2%.
The rolling 1-, 3-, 5-, and 10-year annualized dividend growth rates from Broadridge since 2007 can be found in the following table.
| Year | Annual Dividend | 1 Year | 3 Year | 5 Year | 10 Year |
| 2007 | $0.060 | ||||
| 2008 | $0.240 | 300.00% | |||
| 2009 | $0.280 | 16.67% | |||
| 2010 | $0.560 | 100.00% | 110.55% | ||
| 2011 | $0.600 | 7.14% | 35.72% | ||
| 2012 | $0.640 | 6.67% | 31.73% | 60.55% | |
| 2013 | $0.720 | 12.50% | 8.74% | 24.57% | |
| 2014 | $0.840 | 16.67% | 11.87% | 24.57% | |
| 2015 | $1.080 | 28.57% | 19.06% | 14.04% | |
| 2016 | $1.200 | 11.11% | 18.56% | 14.87% | |
| 2017 | $1.320 | 10.00% | 16.26% | 15.58% | 36.22% |
| 2018 | $1.460 | 10.61% | 10.57% | 15.19% | 19.79% |
| 2019 | $1.940 | 32.88% | 17.37% | 18.22% | 21.36% |
| 2020 | $2.160 | 11.34% | 17.84% | 14.87% | 14.45% |
| 2021 | $2.300 | 6.48% | 16.36% | 13.90% | 14.38% |
| 2022 | $2.560 | 11.30% | 9.68% | 14.17% | 14.87% |
Source: Author; Data Source: Broadridge Financial Solutions Investor Relations
For dividend growth investors, the dividend payout ratio is one of the most useful metrics on which to quickly judge a business. The payout ratio lets you know if dividends have been growing faster than earnings or cash flow. The payout ratio also lets you know how well insulated a dividend is from a temporary setback.
BR Dividend Payout Ratios (BR SEC filings)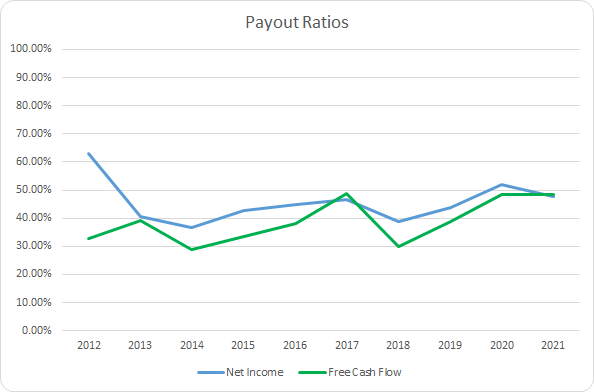
Broadridge’s payout ratios have been on a slight upward trend during the last decade; however, they still both appear to adequately cover the dividend payment. The 10-year average net income payout ratio is 45.7% with the 5-year average at 45.8%. Similarly, the average free cash flow payout ratios are 38.7% and 42.8%, respectively.
Quantitative Quality
While I’d love to be a trading wizard taking advantage of the short term swings in the market, I also know myself well enough that my temperament, and focus, wouldn’t allow me to be successful. Never mind the rich history of most traders losing over time.
As such I try to take the slow approach to building wealth by identifying what I believe are good companies that should continue to do well in the future. Over time it’s the performance of the business that drives the bulk of the investment returns.
BR Revenue Profits and Cash Flow (BR SEC filings)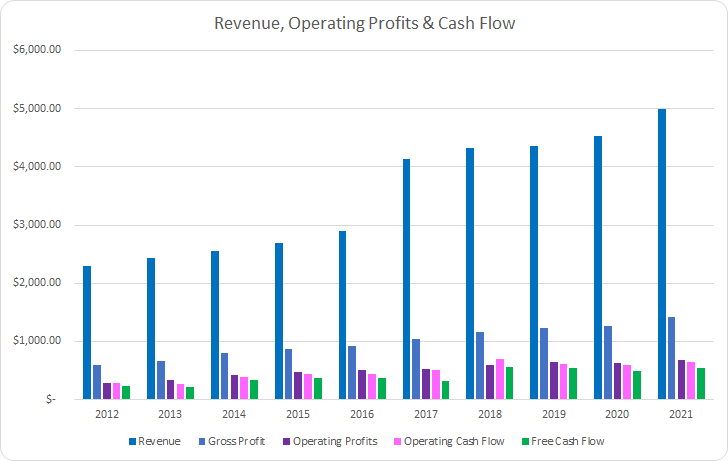
Broadridge has shown very strong growth over the last decade that has been aided by acquisitions. In total sales are up 116.8% or 9.0% annualized. Gross profits rose 142.0% or 10.3% annualized during that same time.
Operating profits are up an impressive 134.9% or 10.0% annualized with operating cash flow improving 125.2% or 9.4% annualized. Free cash flow generation has tracked with the operating cash flow increase growing by 127.1% in total or 9.5% annualized.
My expectation is that a good business will be able to maintain or improve its margins over time. A strong business with a defensible position against competition should be able to flex its businesses comparative strengths. I typically want to target businesses that are able to routinely maintain 10% or greater free cash flow margins.
BR Margins (BR SEC filings)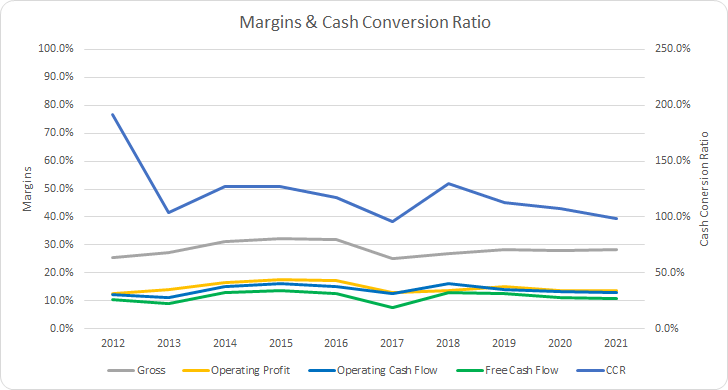
Broadridge’s gross profit margins have generally been stable over time. The 10-year average gross margin is 28.4% with the 5-year average coming to 27.3%.
Similarly, Broadridge’s free cash flow margins have fluctuated around the 10% level. The 10-year average works out to 11.3% with the 5-year average at 10.9%.
Additionally I want to see how efficient Broadridge is in terms of generating free cash flow compared to some measure of asset or capital base. The primary metric that I follow is the free cash flow return on invested capital, FCF ROIC; however, I also track the FCF ROA and FCF ROCE. My expectation is to see a FCF ROIC greater than 10% that is at least stable and preferably rising over time.
BR Free Cash Flow Returns (BR SEC filings)
Except for FY 2021, Broadridge had achieved a 10% or greater FCF ROIC each year of the last decade. Broadridge hasn’t shown the most stable FCF return profile; however, I would expect a normalized FCF ROIC for Broadridge to be trending higher. The 10-year average FCF ROIC is a very strong 18.2% with the 5-year average at 17.1%.
To understand how Broadridge uses its free cash flow I calculate three variations of the metric, defined below:
- Free Cash Flow, FCF: Operating cash flow less capital expenditures
- Free Cash Flow after Dividend, FCFaD: FCF less total cash dividend payments
- Free Cash Flow after Dividend and Buybacks, FCFaDB: FCFaD less net cash used on share repurchases
BR Free Cash Flows (BR SEC filings)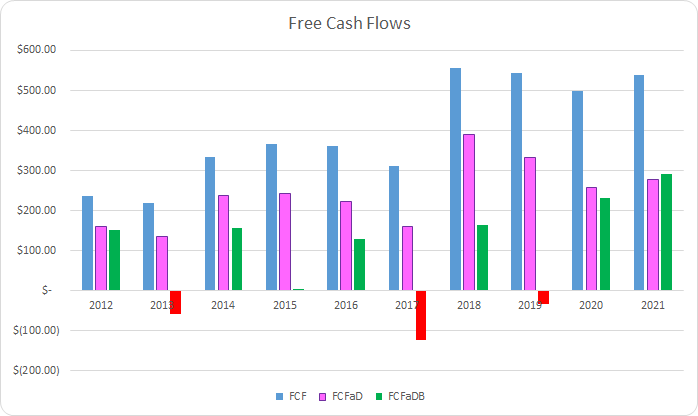
Across the last decade Broadridge has generated a total of $4.0 B in FCF. That’s very impressive considering they traded for less than a $4.0 B market cap 10 years ago. Broadridge has paid out a total of $1.6 B in dividends to shareholders over that time putting the cumulative FCFaD at $2.4 B. Broadridge has also spent a net total of $1.5 B repurchasing shares during that time which brings the cumulative FCFaDB at $0.9 B.
While I would prefer to see more companies implement special dividends rather than share repurchases, tax efficiency be damned, I realize that most management teams will be incentivized to repurchase shares with excess cash. For remaining shareholders buybacks can be a big boon if they are done at reasonable valuations.
BR Shares Outstanding (BR SEC filings)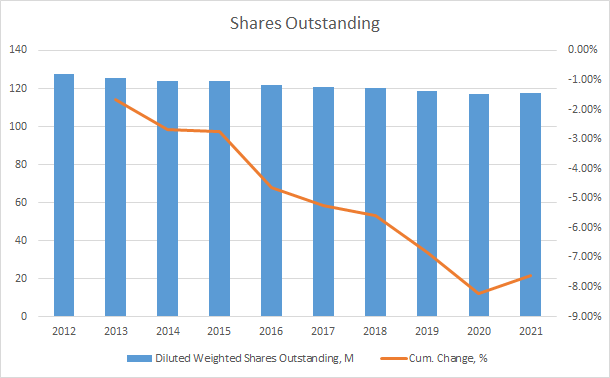
Across the last decade, Broadridge’s share count has fallen by 7.6% good for roughly a 0.9% annual decline.
My goal is to invest in a business for the long-term and as such I want to make sure my equity stake is insulated from potential risks from excessive leverage. Two metrics that I track are the debt-to-capitalization ratio as well as the long term debt-to-equity ratio.
BR Debt to capital (BR SEC filings)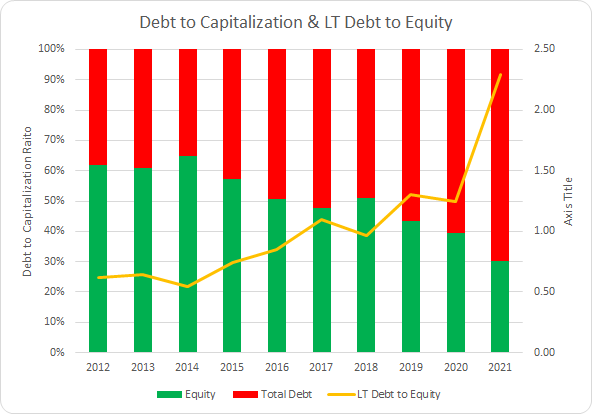
Debt has become a bigger part of Broadridge’s capitalization over the last decade. The 10-year average debt-to-capitalization ratio is 49% with the 5-year average at 58%.
I also track the net debt ratios as I believe they paint a better picture of the leverage and ensuing claims on the future profits or cash flows of the business. The net debt ratios examine the total debt less cash compared to some measure of profits or cash flow.
BR Debt Ratios and ICR (BR SEC filings)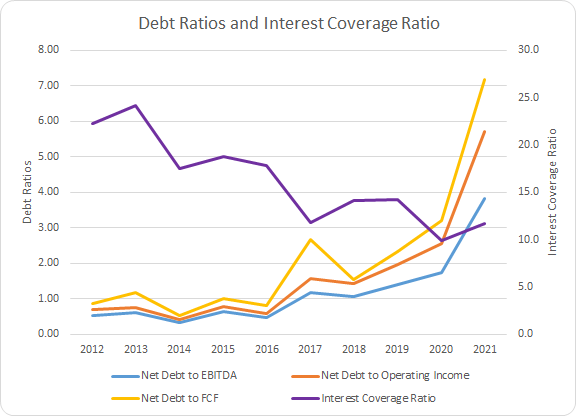
As Broadridge’s net debt levels have risen their leverage has been rising as well. The 10-year average net debt-to-EBITDA, net debt-to-operating income, and net debt-to-FCF ratios are 1.2x, 1.7x, and 2.1x, respectively. Accordingly, the 5-year averages are 1.8x, 2.6x, and 3.4x.
Similarly, Broadridge’s interest coverage ratio has been on the decline as the leverage has increased. The 10-year average interest coverage ratio comes to 16.2x with the 5-year average at 12.4x.
Valuation
When valuing potential investments I aim to value the business from multiple viewpoints with a goal of homing in on a fair price to pay for the business. The valuation methods that I employ are dividend yield theory, a reverse discounted cash flow analysis, and a minimum acceptable rate of return, “MARR”, analysis.
Dividend yield theory is a valuation method that is best suited for businesses that have a history of paying dividends to shareholders. DYT is a play on a reversion to the mean based methodology and operates under the assumption that investors will generally value a business around a normal dividend yield level over time. For Broadridge, I’ll use the 3-year average forward dividend yield as a proxy for fair value.
Broadridge Financial Dividend Yield Theory (BR Investor Relations and Google Finance)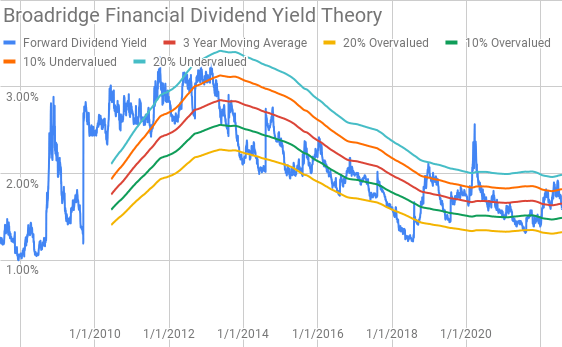
Historically the 3-year average forward dividend yield bands have been fairly good predictors of share price performance over the short to intermediate term timeframes. Broadridge shares currently offer a forward dividend yield of 1.59% compared to the 3-year average forward dividend yield of 1.65%.
A reverse discounted cash flow analysis can be used as a reality check on what the business must generate in terms of future cash flow in order to justify the current market valuation. I use a simplified DCF model built on revenue growth, an initial free cash flow margin of 10.0% that improves to 13% during the forecast period. I’ve assumed that Broadridge will have a terminal growth rate of 3.5%.
In order to determine the WACC I’ve used an after-tax cost of debt that works out to 2.38% and a cost of equity of 10% and 8.0%. That yields a WACC of 8.6% and 7.0%, respectively, to use for discounting the cash flows back to the present value.
Under the 10% CoE / 8.6% WACC scenario Broadridge needs to grow revenues 10.9% annually during the forecast period to justify the current market valuation. With an 8% CoE / 7.0% WACC the required revenue growth drops to just 5.2% annually during the forecast period.
On average analysts expect Broadridge to report FY 2022 EPS of $6.46 and FY 2023 EPS of $7.07. Analysts also expect Broadridge to be able to grow EPS at an 11.8% rate over the next 5 years. I then assumed that Broadridge’s EPS growth would slow to 4.5% annually for the following 5 years. Dividends are assumed to target a 40% payout ratio.
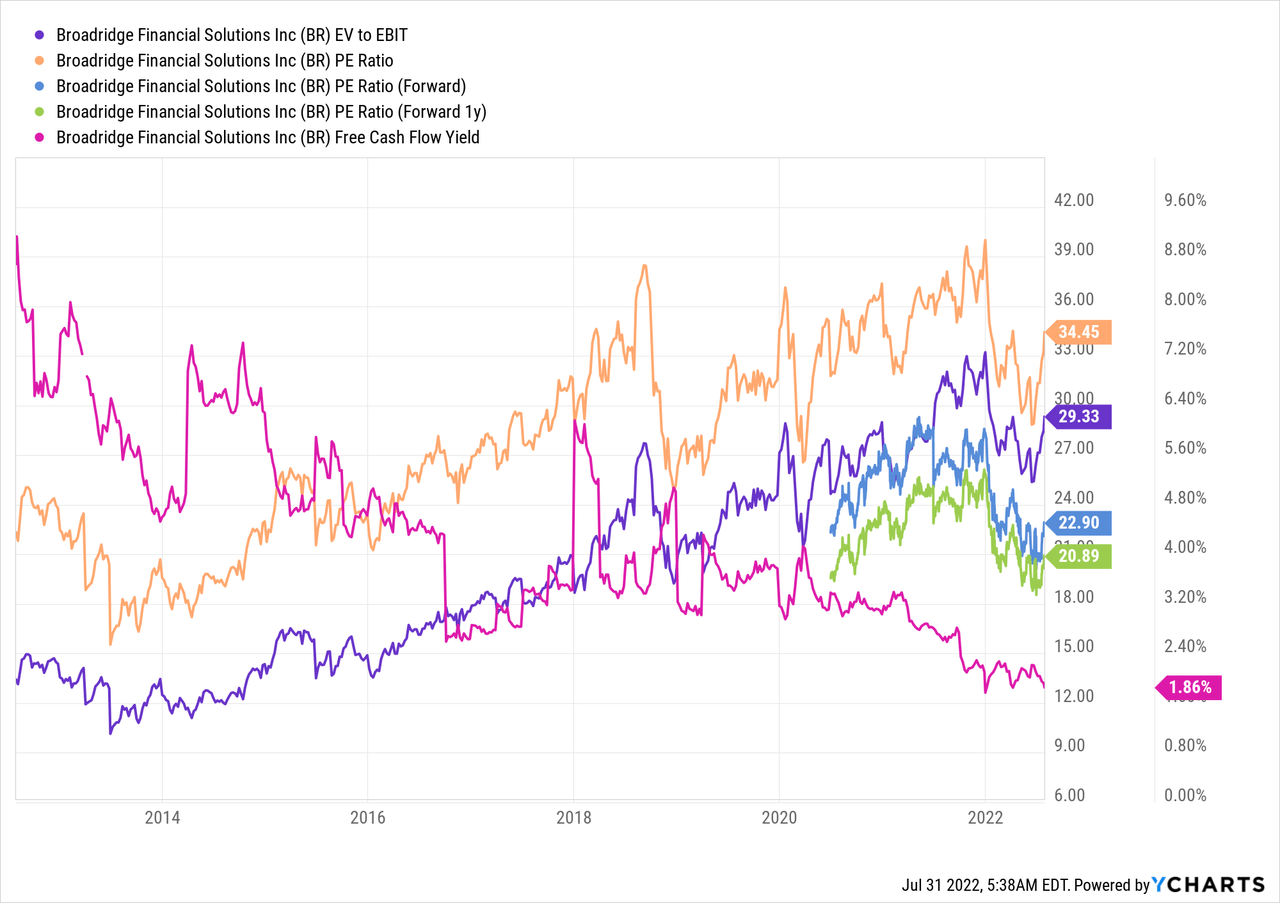
To determine the future terminal multiple I look at how investors has historically valued Broadridge to get a sense of the potential range they might do so in the future. As you can see in the following YChart, Broadridge has typically been valued between approximately 15x and 35x TTM EPS.
The following table shows the internal rates of return that Broadridge could provide if the growth assumptions prove to be realistic forecasts for how the future plays out. Dividends are assumed to be taken in cash and paid, as well as increased, along the timeline that Broadridge has followed. Shares are assumed to be purchased at $160.55.
| IRR | ||
| P/E Level | 5 Year | 10 Year |
| 30 | 17.8% | 11.6% |
| 25 | 13.3% | 9.6% |
| 22.5 | 10.7% | 8.5% |
| 20 | 7.9% | 7.3% |
| 17.5 | 4.8% | 5.9% |
| 15 | 1.4% | 4.4% |
Source: Author
Additionally I use the MARR analysis framework to work backwards in order to determine the maximum price I could pay today in order to generate the returns that I desire from my investments at varying terminal multiples. My base hurdle rate is a 10% IRR and I’ll also examine 12% and 8% return thresholds.
| Purchase Price Targets | ||||||
| 10% Return Target | 12% Return Target | 8% Return Target | ||||
| P/E Level | 5 Year | 10 Year | 5 Year | 10 Year | 5 Year | 10 Year |
| 30 | $218 | $184 | $202 | $158 | $236 | $216 |
| 25 | $184 | $158 | $171 | $135 | $199 | $184 |
| 22.5 | $167 | $144 | $155 | $124 | $180 | $169 |
| 20 | $150 | $131 | $139 | $113 | $161 | $153 |
| 17.5 | $133 | $118 | $123 | $102 | $143 | $137 |
| 15 | $115 | $104 | $107 | $90 | $123 | $121 |
Source: Author
Conclusion
While Broadridge isn’t widely discussed on Seeking Alpha, that’s primarily for it’s under the radar status rather than business performance. Over the last decade Broadridge has seen its revenues grow 9.0% annualized. Broadridge doesn’t carry quite as strong of margins as I would have expected; however, they are fairly capital light in their business and free cash flow margins have routinely been greater than 10%, pushing as high at 13.6% in FY 2015.
Similarly, Broadridge maintains strong free cash flow ROICs that are regularly in the upper teen to low twenties range. All signs point to Broadridge being an excellent business.
Dividend yield theory suggests a fair value range between $141 and $172 and accordingly that shares are fairly valued at current market prices. Broadridge should be announcing a dividend increase in August. At a $0.70 per share quarterly payout, a 9.4% increase, the fair value range would rise to between $154 and $188 which puts Broadridge on the lower end of the fair value range.
The reverse DCF analysis suggests that 10% returns are not as likely as the required revenue growth and margin growth is quite optimistic, in my opinion. However, 8% returns appear to be very achievable with share repurchases potentially providing roughly a 1% boost to per share returns. The reverse DCF doesn’t appear to be overly optimistic with returns likely in the 8-10% range. That being said Broadridge appears fairly valued and not necessarily cheap.
The MARR analysis also appears to show that Broadridge is trading on the upper end of fair value if you believe the roughly 7.4% forecast annual EPS growth over the next decade is achievable. For a 10% return target with a fair exit multiple between 20x and 25x, the fair value range for Broadridge is $131 to $158. However, with an 8% return target the fair value range rises to $161 to $199.
Broadridge is an under the radar dividend growth prospect. While the dividend yield isn’t much at just 1.59%, dividend growth and in turn total return has been solid. I expect plenty more of both going forward.
While Broadridge’s margins are solid, I expect them to improve over time as the business reaches further scale efficiencies.
At the start of their FY 4Q Broadridge maintained strong guidance for FY 2022. Management even increased their EPS growth guidance from an already strong 11-15% forecast to 13-15%.
BR FY 2022 Guidance (BR Q4 2022 Presentation)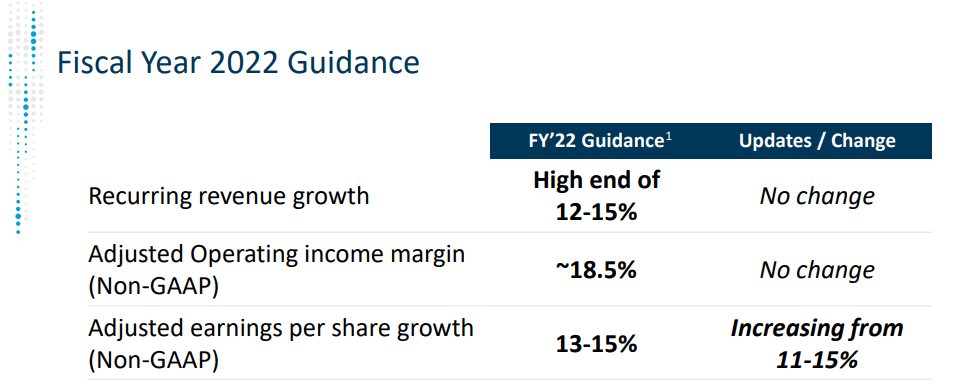
Broadridge appears to be trading on the upper end of fair value with a current price near $160. While I like the business, I’m trying to focus on building up my position sizes rather than building out the number of positions. As such I’ll hold off on adding Broadridge to my portfolio with aims of starting to build out the position should the share price retreat to the mid-$140s and continue to add on further weakness.
Be the first to comment