

British Pound Outlook:
- Sterling continues to post gains against the battered commodity currencies as delta variant concerns hamper growth assets.
- GBP/AUD is nearing its yearly high as is GBP/NZD, but GBP/CAD rates are contained with an evolving triangle.
- According to the IG Client Sentiment Index, the British Pound has a mixed trading bias.
Commodity Currency GBP-crosses Running Higher
The British Pound isn’t having a great month of August. Down against all but two of the major currencies, the past few days have brought a small change in fortune as delta variant concerns hamper growth assets. The trio of commodity currencies have been sluggish the past few days, thanks in part to receding rate hike odds among the BOC, RBA, and RBNZ.
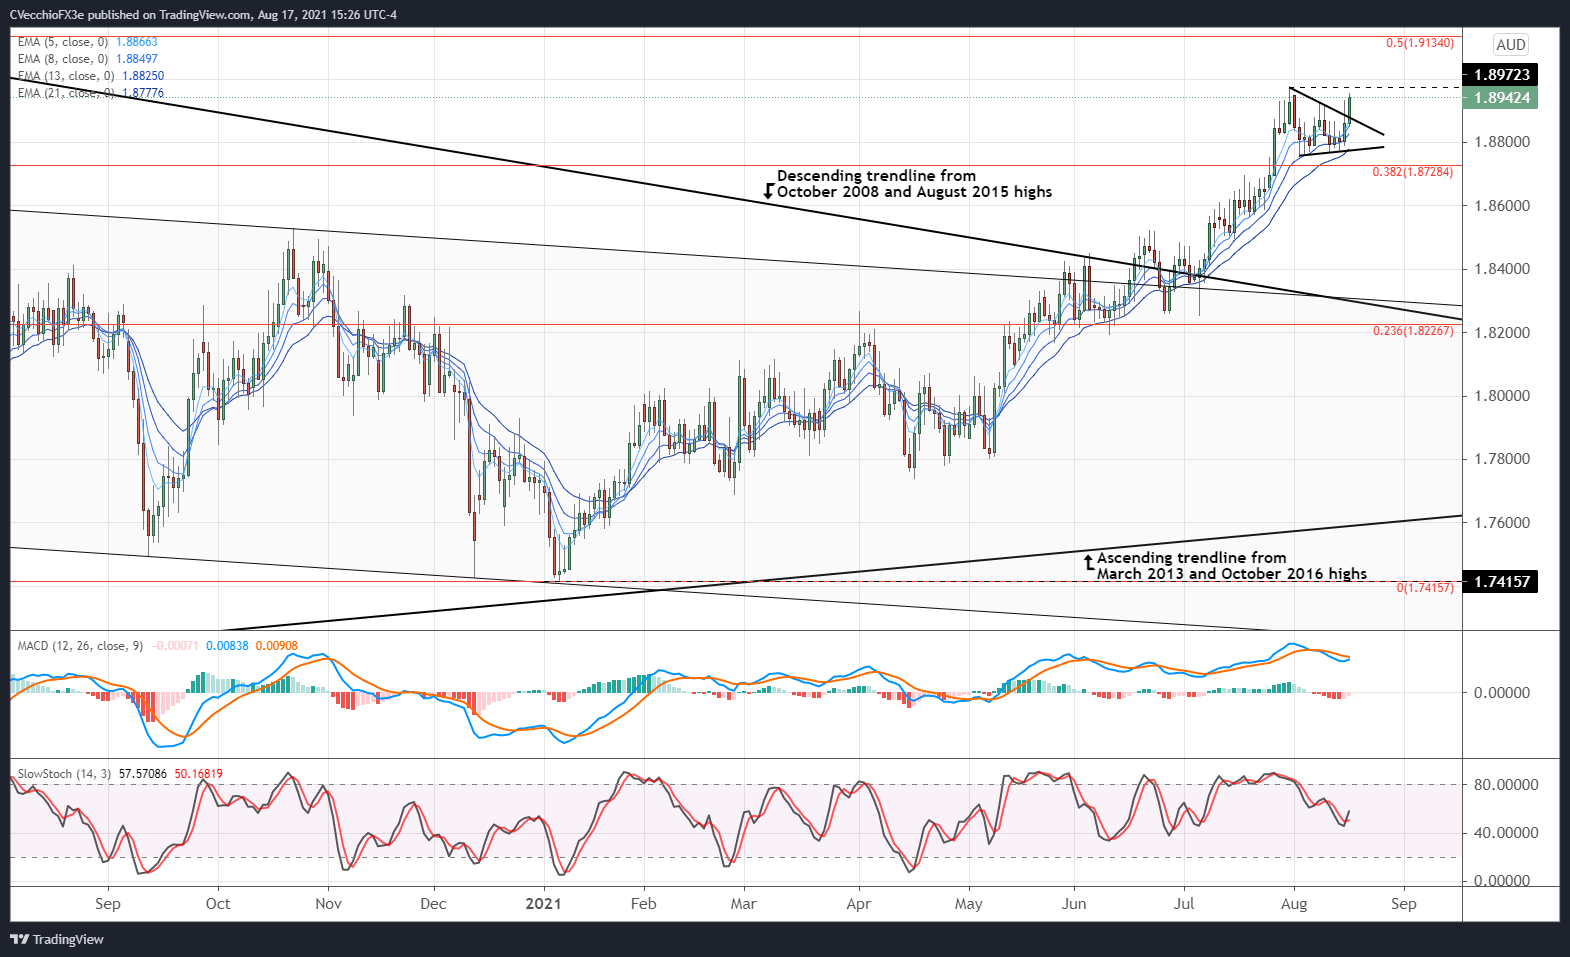
GBP/AUD RATE TECHNICAL ANALYSIS: DAILY CHART (August 2020 to August 2021) (CHART 1)
GBP/AUD rates are quickly approaching their yearly high (set last month) as the triangle that’s formed in August has yielded a bullish breakout. Momentum is firming, with the pair above its daily 5-, 8-, 13-, and 21-EMA envelope, which is in bullish sequential order. Daily MACD is turning higher towards a bullish crossover while above its signal line, while daily Slow Stochastics have similarly turned higher above their median line. The base of the triangle coincides with the yearly high, suggesting that a return to and above 1.8972 is in scope very soon.
GBP/CAD RATE TECHNICAL ANALYSIS: DAILY CHART (August 2020 to August 2021) (CHART 2)
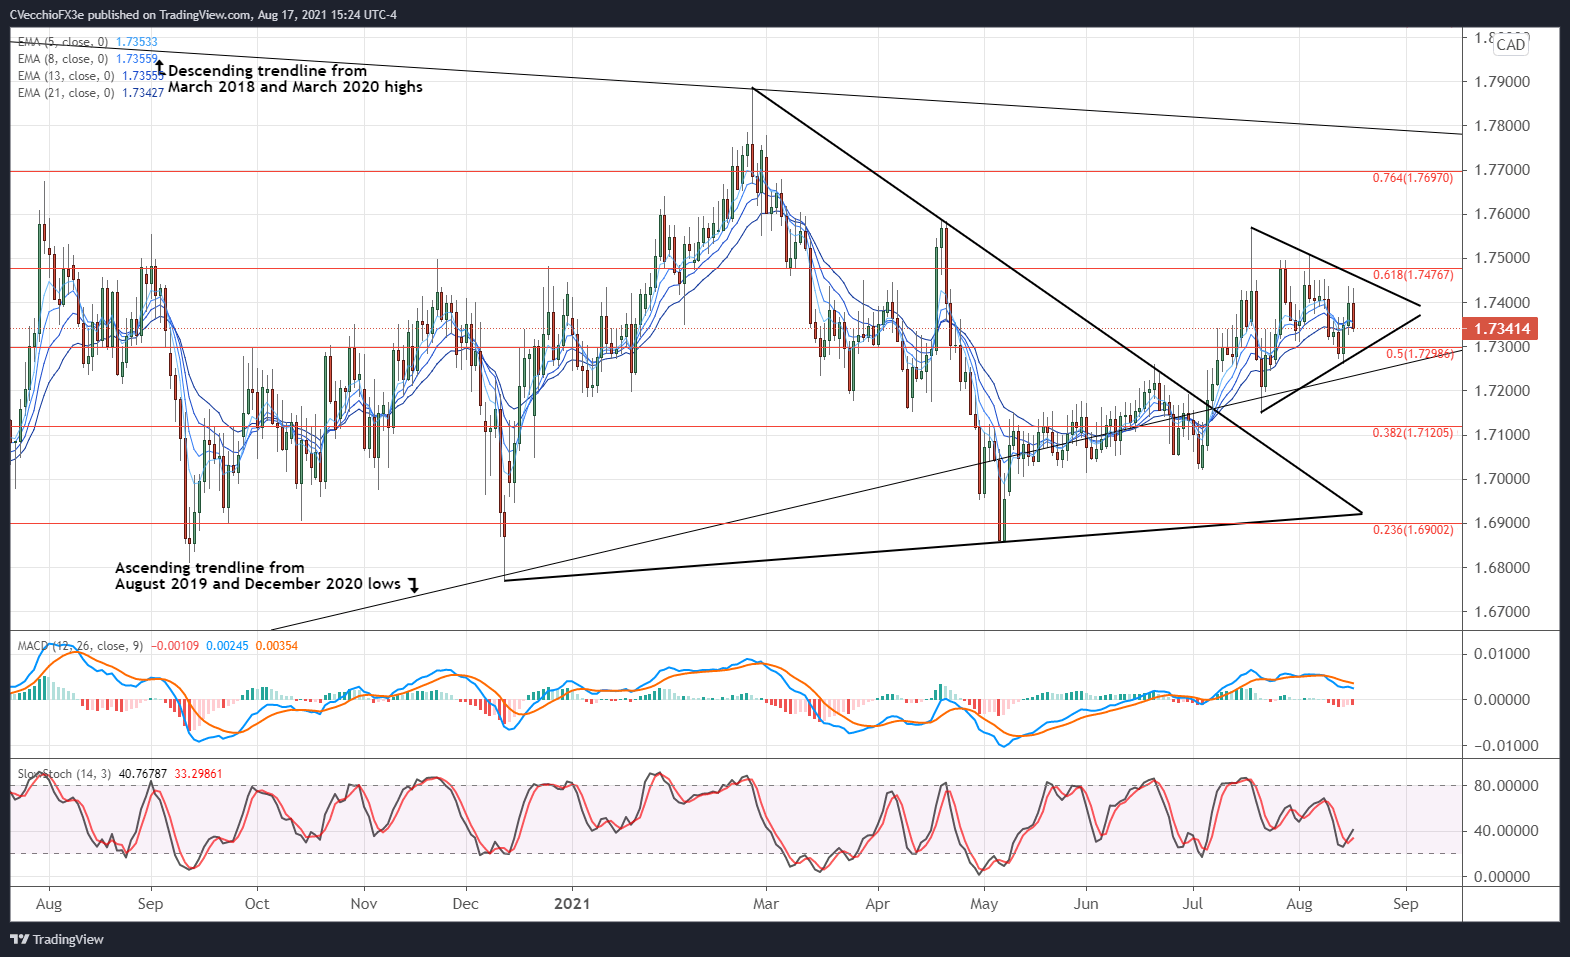
GBP/CAD rates experienced a bullish breakout from the symmetrical triangle carved out against the December 2020 and May 2021 swing lows and the February and April 2021 swing highs, once again finding themselves consolidating in a symmetrical triangle. The triangle has been constricting between the 50% and 61.8% Fibonacci retracements of the 2020 high/low range. Declining daily MACD (while above its signal line) and rising daily Slow Stochastics offer conflicting signals, indicating that more consolidation may be ahead for the foreseeable future.
GBP/NZD RATE TECHNICAL ANALYSIS: DAILY CHART (August 2020 to August 2021) (CHART 3)
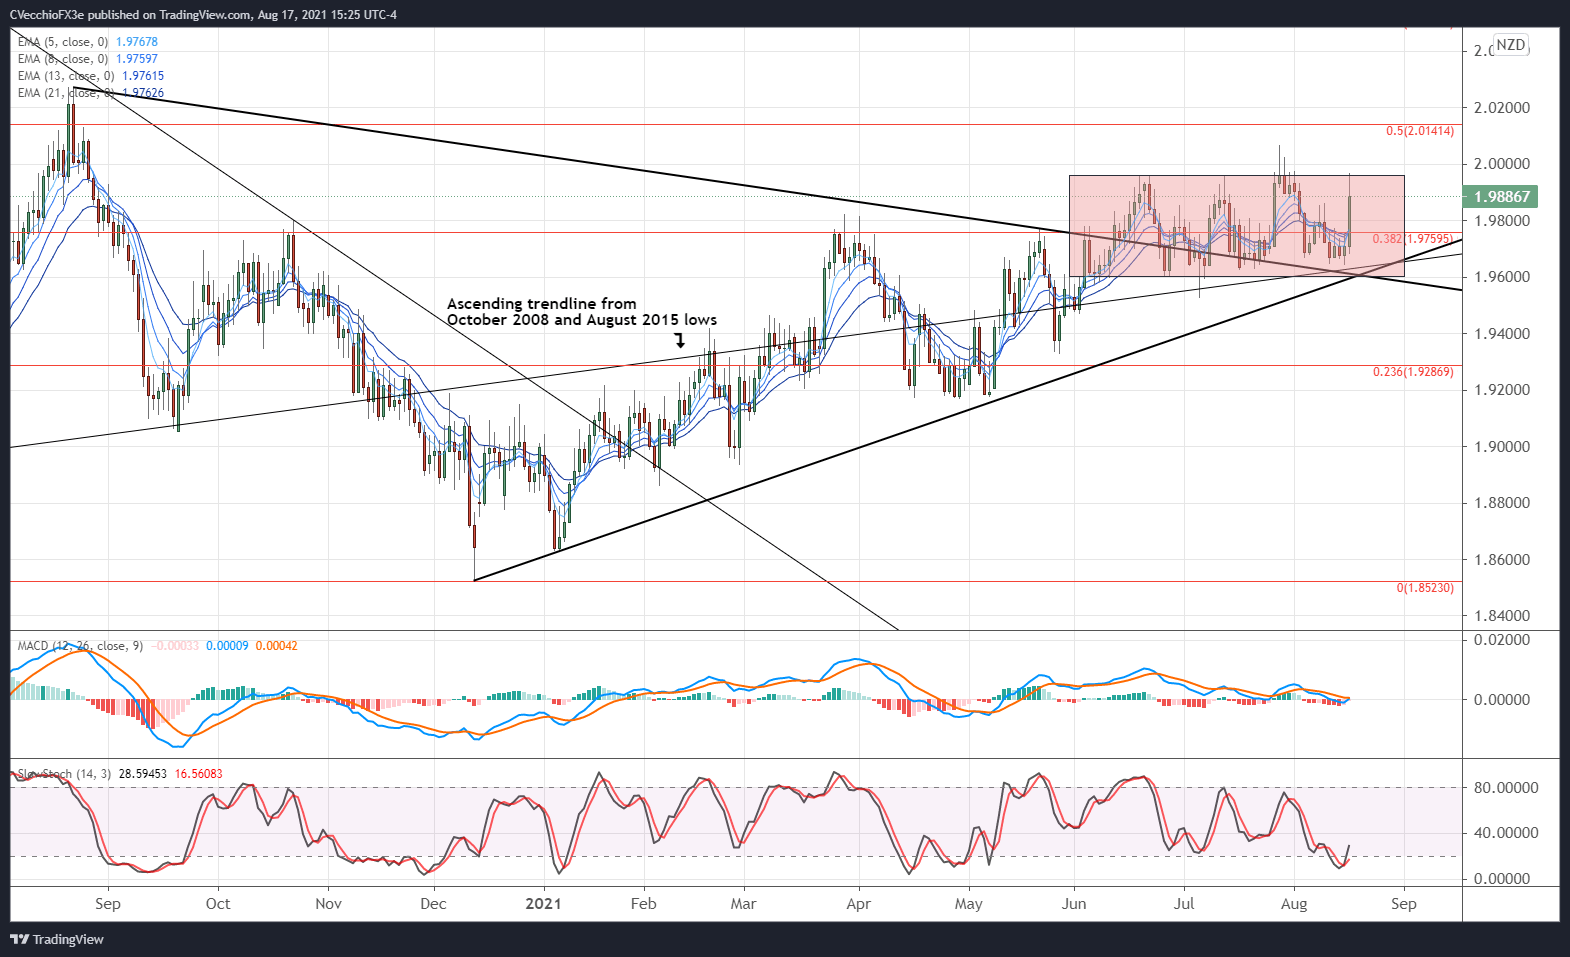
GBP/NZD has been rangebound for the better part of the past three months, but has spent that time holding above triangle resistance. Continuing its elevation above the ascending trendline from the October 2008 and August 2015 lows, GBP/NZD rates retain a bullish bias ahead of the August RBNZ meeting. While GBP/NZD remains above its daily EMA envelope, the moving averages are not yet in bullish sequential order. Daily MACD is turning higher through its signal line, however, while daily Slow Stochastics have rebounded from oversold territory. Another run up to and above 2.0000 isn’t out of the question in the near-term.
— Written by Christopher Vecchio, CFA, Senior Currency Strategist
Be the first to comment