

GBP/USD – Prices, Charts, and Analysis
- US inflation and jobs data are released at the back end of the week.
- The 200-day moving average is the next target for cable.
Recommended by Nick Cawley
Get Your Free GBP Forecast
Most Read: GBP/USD Breakout Nears as Highs and Lows Compress
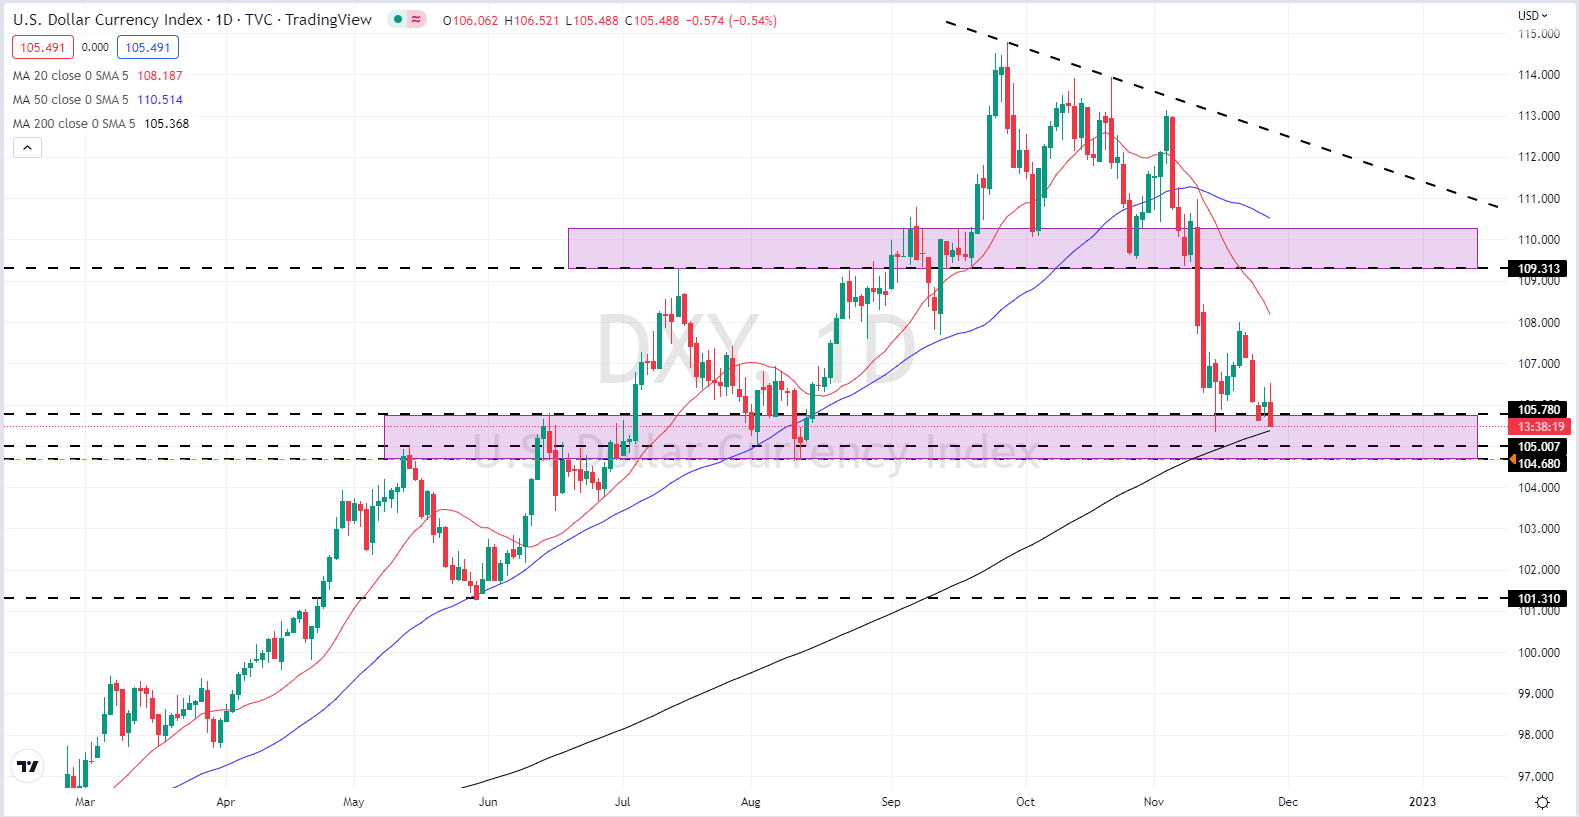
The US dollar has given back all its early gains and is now trading in negative territory in early European turnover. The greenback rallied in Asian trade as Chinese covid-zero protests spread, but the strength of the Euro and the Japanese Yen has pushed the dollar index lower and near lows last seen around 10 weeks ago.
US Dollar (DXY) – Daily Chart
Recommended by Nick Cawley
How to Trade GBP/USD
This week the US data calendar throws up some high-importance releases with US consumer confidence (Tuesday @ 15:00 GMT), US Q2 GDP (Wednesday @ 13:30 GMT), core PCE (Thursday @ 13:30 GMT), ISM manufacturing PMI (Thursday @ 15:00 GMT), and US non-farm payrolls (Friday @ 13:30 GMT) the standouts. All these releases have the ability to move the US dollar markedly.
For all market-moving data releases and economic events see the DailyFX Calendar.
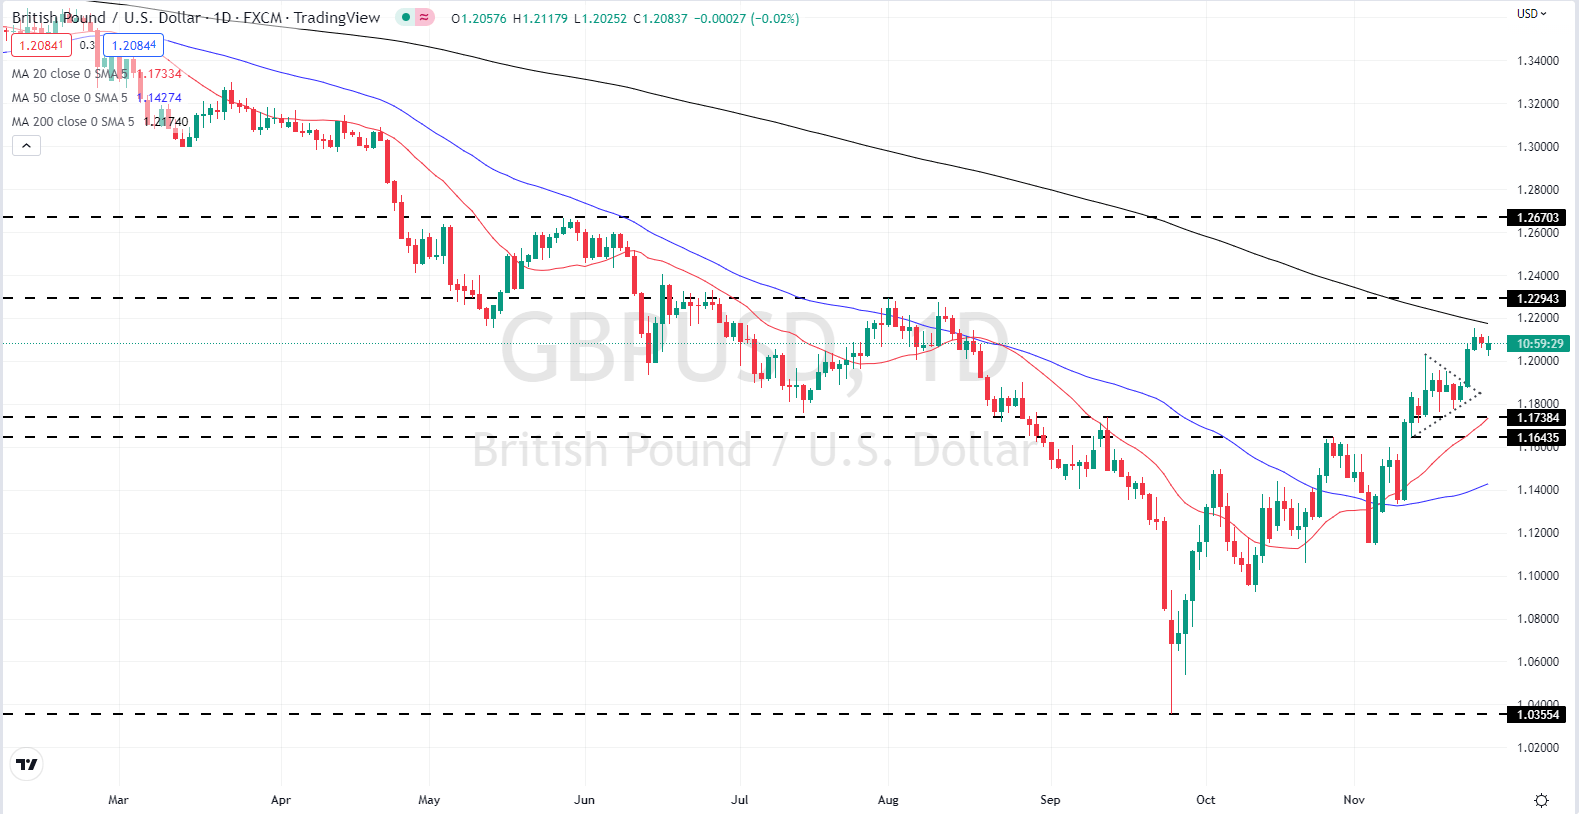
Cable is treading water around the 1.2100 level and consolidating its recent hefty gains. The pair has rallied by 16% since their recent 1.0350 low as UK PM steadies the ship after the last government’s disastrous short-lived tenure. The technical picture for cable remains mildly positive with the bullish pennant breakout helping the pair close in on the 200-day moving average, currently at 1.2175. The last time cable was above the 200-dma was back in September 2021. A confirmed break higher would leave 1.2293 as the next objective. Short-term support sits at 1.2025.
A Complete Guide to Using Moving Averages in Your Trading Strategy
GBP/USD Daily Price Chart – November 28, 2022
All Charts via TradingView
| Change in | Longs | Shorts | OI |
| Daily | 15% | 1% | 6% |
| Weekly | -9% | 12% | 2% |
Retail Traders Increase their Weekly Net-Short Positions.
Retail trader data show 38.67% of traders are net-long with the ratio of traders short to long at 1.59 to 1.The number of traders net-long is 3.81% higher than yesterday and 11.32% lower from last week, while the number of traders net-short is 0.35% higher than yesterday and 13.48% higher from last week.
We typically take a contrarian view to crowd sentiment, and the fact traders are net-short suggests GBP/USD prices may continue to rise. Positioning is less net-short than yesterday but more net-short from last week. The combination of current sentiment and recent changes gives us a further mixed GBP/USD trading bias.
What is your view on the British Pound – bullish or bearish?? You can let us know via the form at the end of this piece or you can contact the author via Twitter @nickcawley1.
Be the first to comment