

primeimages
From the June 17th low to yesterday, the 50 most shorted stocks (in blue below courtesy of DailyShot.com) surged 20% and helped to pull broad stock indices higher (S&P 500 in black gained 7.76%) as speculators covered their bets to book profits.
50 highest short interest names (The Daily Shot)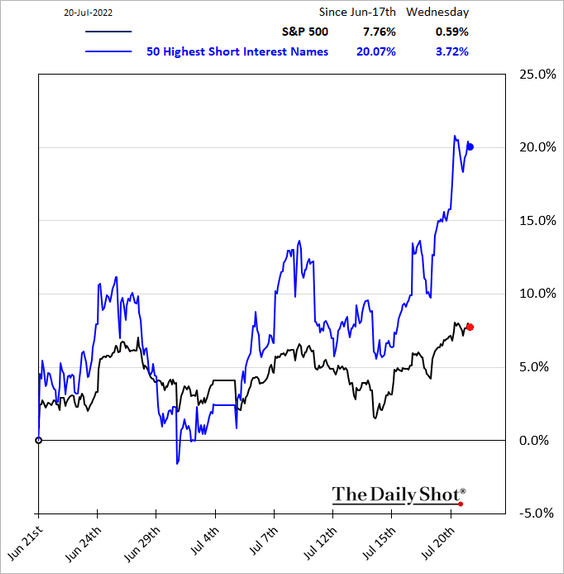
As shown below, courtesy of Michael Kantro, this was the fourth such rally since the S&P 500 peaked in December 2021. The previous three were all bear market rallies, with prices slumping to new lows shortly thereafter. Rolling over again today, we will soon know if the next leg lower is now in motion. The four rallies of 6 to 11% year to date have been shorter in duration and smaller in size than during the 2000-02 and 2007-09 bear cycles.
SPX Index (Michael Kantro; Bloomberg)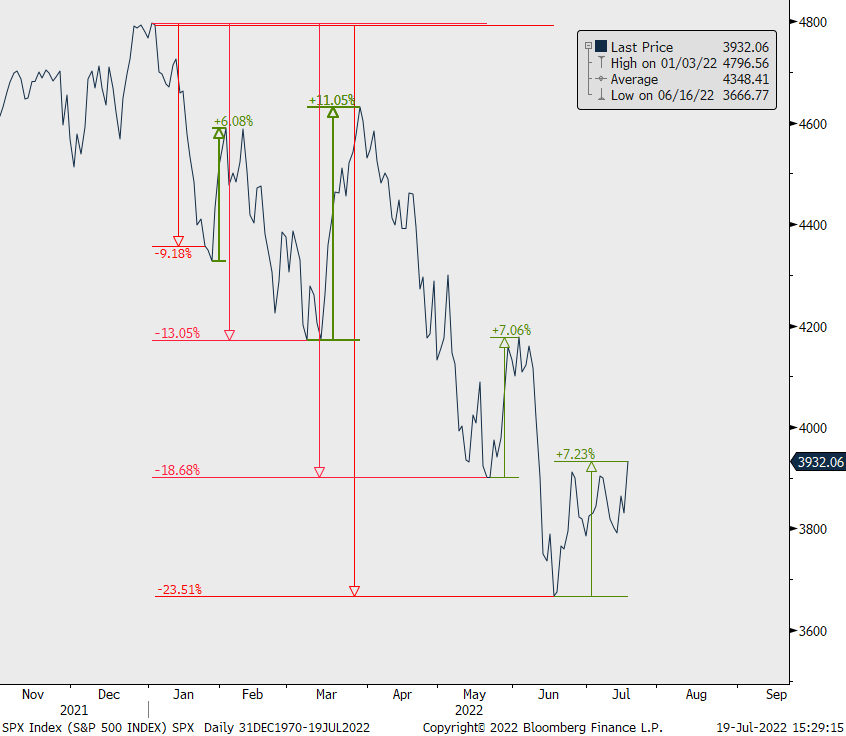
It seems seven months of falling prices are finally taking a toll on investment manager sentiment, with 58% of the latest Bank of America survey respondents saying they were taking lower than normal levels of risk in their portfolios.
That doesn’t mean they have meaningfully reduced risk exposure, of course. Investment managers are mostly long-always, so defensive for them means less leverage, a higher weight in dividend-paying equities and cash holdings of 6% – the most since 2000. As if 6% cash offers much downside buffer when the rest of the portfolio is halving. And good luck meeting customer redemptions with 6% cash once panic selling picks up. What dry powder? No wonder final bear market bottoms coincide with forced liquidation selling.
Speculative sentiment may be bruised, but it’s definitely not yet broken. The double-or-nothing retail crowd is evidently still going for broke; see Generation moonshot. Gambling remains a popular pastime; for now, rock bottom capitulation lies somewhere ahead.
Margin debt (below in red since 1997) is being forced lower as prices fall (S&P in blue), but coming from the highest levels in history, much contraction is yet needed just to get back to the previous bubble tops of 2000 and 2007. Past market bottoms coincided with a halving from the cycle peak in margin levels and stock prices. So far, both are only off about 20%.
FINRA Margin Debt and the S&P 500 (Advisor Perspectives)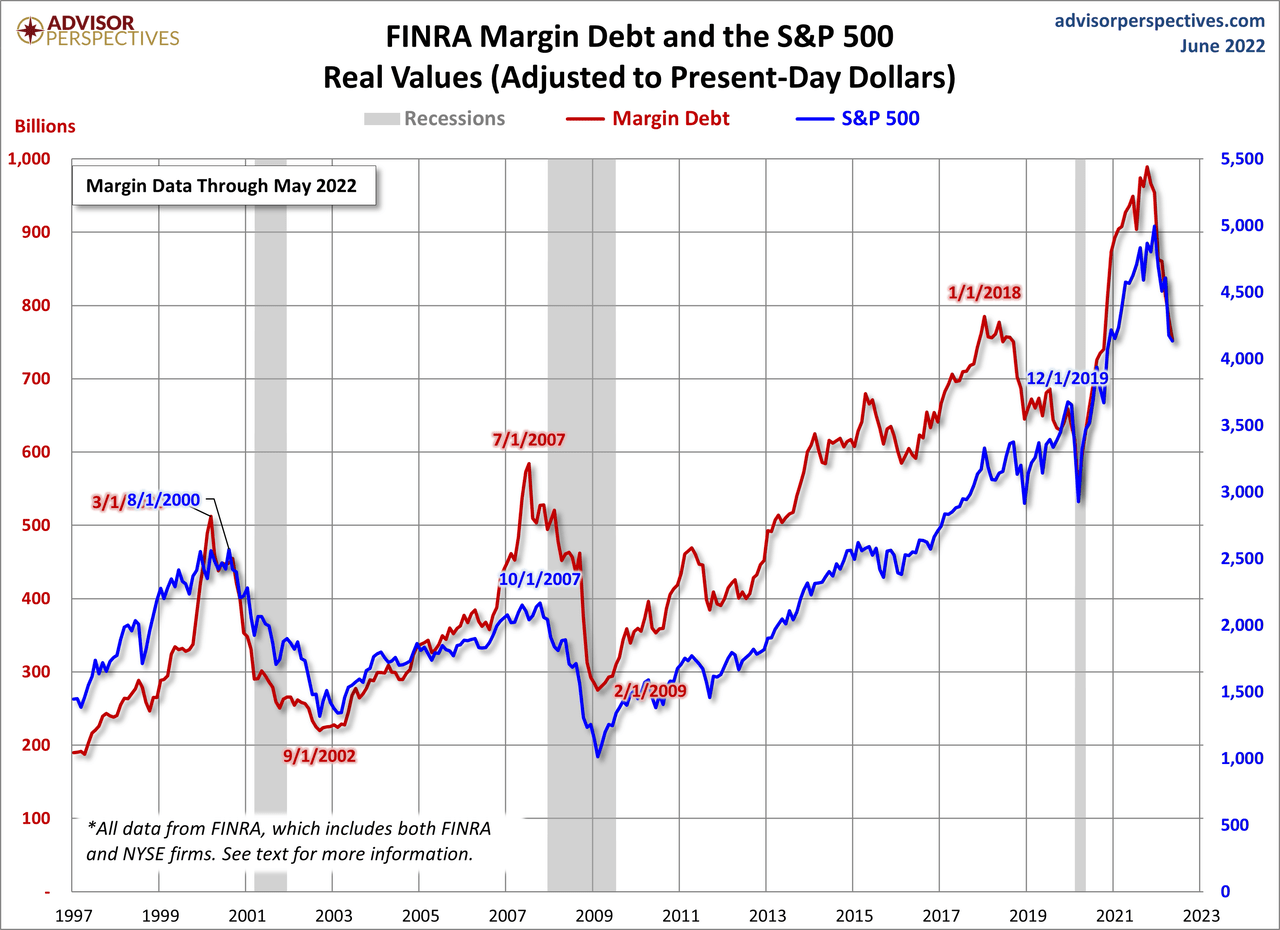
Stock valuations have made some downside progress year to date, but starting from November’s euphoric high, they are still second only to the 1929 and 2000 bubble tops (the CAPE at 28.9 shown below since 1881 courtesy of the Wall Street Journal); see The stock market is on sale. That doesn’t mean it’s cheap.
Valuations (Prof. Robert Shiller)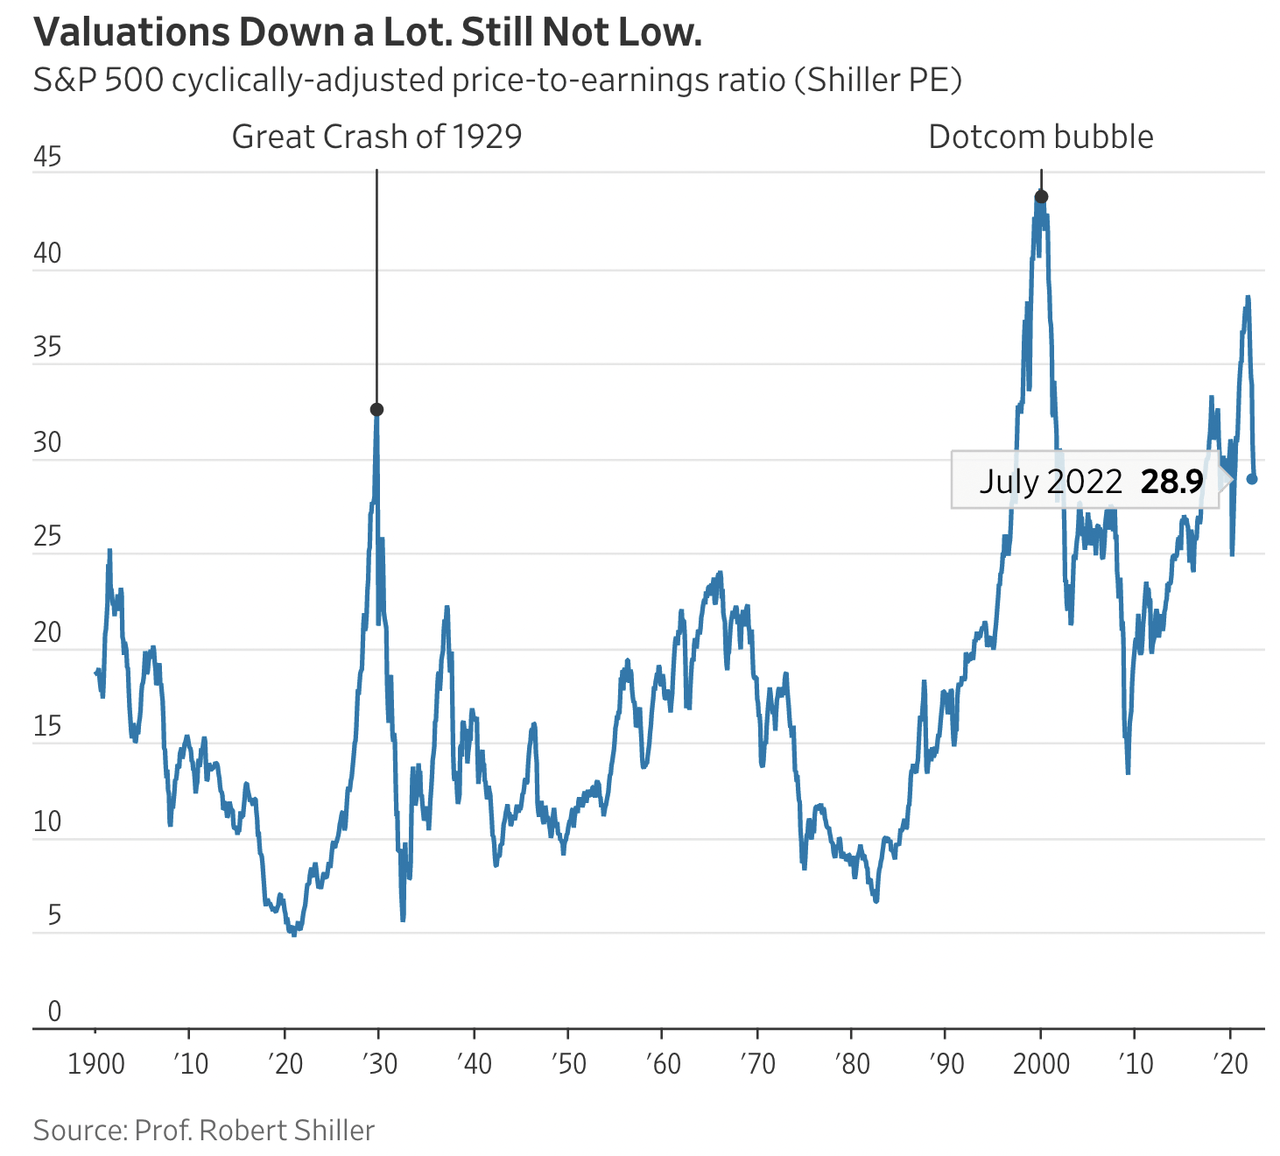
Moreover, equity analysts upgraded their earnings forecasts even as valuations dropped into July. Always late to reality, now they are downgrading forecasts by a two-to-one ratio against upgrades.
As I have mentioned many times, the late cycle slashing of forecasted earnings “E” ultimately brings asset prices and valuations back to the attractive investment ranges that make bear market bottoms so rewarding for disciplined buyers – not there yet, but progressing nicely.
Disclosure: No positions.
Editor’s Note: The summary bullets for this article were chosen by Seeking Alpha editors.
Be the first to comment