


Дмитрий Ларичев/iStock via Getty Images
Investment Thesis
In the last 10 years, Booz Allen Hamilton (NYSE:BAH) almost doubled their business in terms of revenue and EBITDA. During the same time period, shareholders benefited from a total return of 900%. How is this possible? A doubling in business equates to a growth rate of about 8% CAGR over a 10-year time period, while the shares averaged an annual total return of 24%. BAH shareholders benefited from a triple tailwind effect.
- A reduction in share count
- Earnings growth
- Multiple expansion
The company seems to be in good shape to continue to grow further in the coming years. In fact, analyst expectations are for a ~ 10% EPS growth rate YoY into 2025. Still, I think the stock price needs to take a breather. The valuation multiples are near all-time highs. 2022 was a year of repricing of many growth stocks. PEG ratios are no longer rich and investors are willing to pay less for growth prospects. BAH has not yet seen its multipliers fall and I think there is some catch-up to be done. Ultimately, the company should do fine in the coming years, but the stock might already have discounted some future growth.
Agenda
I will analyze the financial data from 2013 to 2022 with a focus on growth, debt ratios and multiples to understand if the current valuation is supported by the business metrics.
Growth (Top-Line, Bottom-Line, Cash Flow):
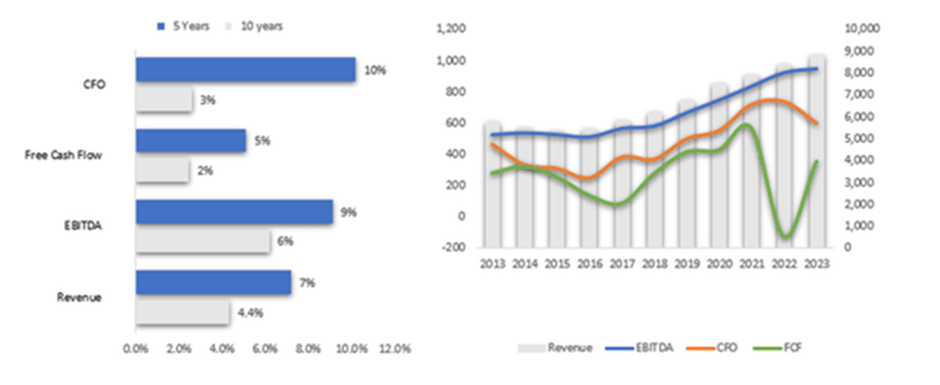
Growth Metrics (SA & Author) TTM 2023 CFO AND FCF smoothened to a 5 year average)
Since 2013 BAH has had good growth, but not outstanding:
- Revenue expanded 4% CAGR, i.e. 1.5-fold from $5.7 Bio to $8.8 billion in 2023 TTM.
- EBITDA expanded 6% CAGR, i.e. 1.8-fold from $520 to $948 million 2023 TTM.
- Free cash flow expanded 2% CAGR, i.e. 1.3-fold from $274 to $350 million 2023 TTM.
For fast growing companies, it’s normal that free cash flow grows at a slower percentage change than earnings. To feed their growth, these companies invest more in capex and acquisitions (cash flow statement) than they can amortize & depreciate (income statement). As such, we can notice in the graphic above that free cash flow has only been growing at 2% over the 10-year period. Not an impressive cash-producing growth story.
BAH has been stimulating its growth metrics by investing cash in acquisitions and capital expenditures, like the most recent purchase of Liberty IT Solutions for $775 million in 2022. In general, during the past decade, cash flow has not seemed to grow organically. BAH has continued to invest cash in acquisitions and capex. If investment in growth stopped, then free cash flow production might pick up from the current unsatisfactory level (current free cash flow yield of 3%). But that might come at a cost of growth, and in that circumstance a repricing of the stock multiple would be imminent. So the choice seems to be between:
- Grow at the cost of a low free cash flow yield, or
- Reduce investments that can produce growth in order to increase free cash flow production.
And this is in synthesis with the thesis of my analysis. BAH is not producing cash that can be paid out to shareholders unless they stop investing into growth.
Debt Ratios
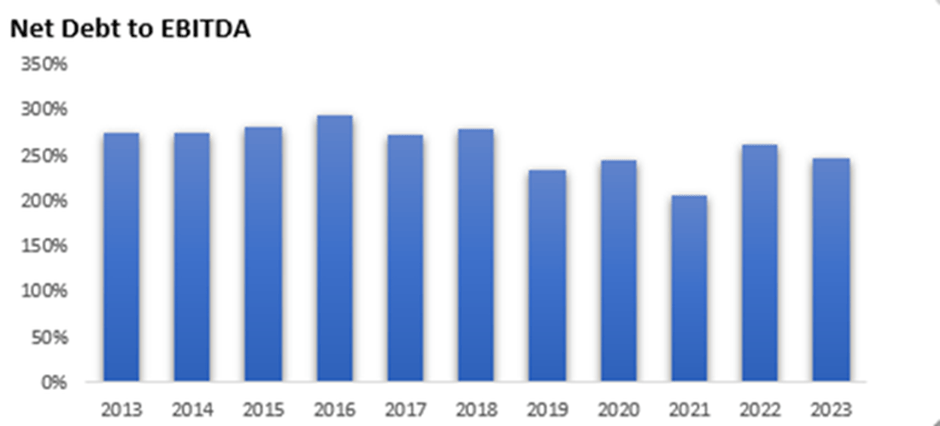
Net Debt to EBITDA (SA & Author)
Banks tend to subscribe to new debt that can be funded by the earnings power of the issuing company. A guideline for this is ~ 3X EBTIDA. During the past 10 years BAH has constantly been between 2.5X and 2.9X net Debt to EBITDA.
BAH is utilizing leverage to improve ROE dynamics. It needs to be noted, that under a higher interest rate regime the interest expense of servicing the debt will be higher. Additionally, at 2.5X (current level) net debt to EBITDA, they don’t have too much space to manoeuvre in case they are in need of the debt capital markets. At this point, they either grow EBITDA (to push down the ratio) or have to fund capex, acquisitions, buybacks and dividends only through their free cash flow (which has been growing at only 32% CAGR over the past decade).
Said that, this company has no debt issues. I am not arguing my sell rating on this metric. But their debt position is also not strong enough to challenge my thesis.
Multiples/Valuation
Since 2013, the multiple of BAH has consistently trended higher. From a low of 6.7 times, it is now valued at 15.7 times EV/EBITDA. The 10 year average of this multiple is 13X.
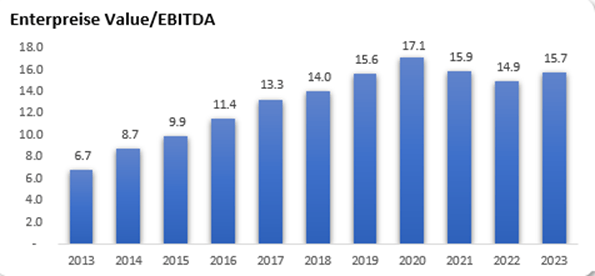
EV/EBITDA Multiplier (SA & Author)
The multiple expansion, together with share buybacks and earnings growth are the reason why BAH has been such a good investment in the past 10 years. Now, analysts expect earnings to continue to grow. The current cash flow production can sustain some buybacks, but considering dividend pay-out ratios and investment in growth, I don’t expect to see a lot of buyback activity.
The third point and core element of my sell rating is that it will be difficult to make a case for the multiple expansion to continue. In order to see a similar share price appreciation like we had in the past decade, the multiple would have to expand by an order of 2.3X in the coming 10 years. As it expanded from 6.7 to 15.7 in the past decade, it will have to expand from 15.7 to 36. Such a high multiple can hardly be justified unless the company grows earnings at a 30% CAGR going forward, which is not plausible.
Since the overall market has lowered multiples during the year 2022 for most growth stocks, I find it an anomaly that BAH did not participate in this re-pricing. I see the possibility of a contraction of the multiple towards its long term average.
This multiple would align the valuation of this company more with its expected earnings growth rate and the overall market multiples. A 13X EV/EBITDA multiple would imply a share price of $75.
Risks
BAH has outperformed the S&P 500 by a big margin over the past 10 years. Selling a healthy company that manages to grow its top and bottom line is a risky endeavour. The company could surprise the market with growth above expectations and that could be the catalyst for further multiple expansion. At the same time, the macroeconomic environment could turn positive, which would support equities in general. If interest rates pivot and turn lower, PEG (Price Earning / Growth) multiples tend to trend higher.
97% of their revenue base derives from contracts with the U.S. government. Half of these are from the defence sector. I would argue that there is, of course, a total dependence on ‘one client’, but this client is as solvent as a client could be. Additionally, U.S. expenses in defence and intelligence are not expected to fall any time soon.
Conclusion
I have a sell rating on this company because a lot of future growth has already been priced in. With a P/E ratio of 21 and a potential 10% growth rate, we have a PEG ratio that is high for this day and age (2.1 PEG ratio). For comparison, Alphabet (GOOGL) has a PEG ratio of 1.27. While BAH is up 10% over the past 12 months, most growth stocks have suffered during the 2022 stock market.
BAH is distributing a dividend of 1.68% ($1.72) while having had EPS of $3.44 in 2022 (i.e. 50% pay-out ratio). During the past 5 years, they have increased their dividend, at 20% CAGR, this is an unsustainable divergence considering their low free cash flow growth rates and their limited ability to fund the dividend through debt issuance (Net Debt/ EBITDA already at 2.5X). Going forward, they will have to massively increase the cash flow production or soon stop increasing their dividends at a 20% per year pace. As soon as that happens, many dividend growth investors might reconsider their investment in BAH.
Until the PEG ratio of BAH is more in line with the general market (below 1.7) I think this stock should be avoided.
Be the first to comment