

Avalon_Studio/E+ via Getty Images
Dear Partner,
The Bonhoeffer Fund returned -4.4% net of fees in the first quarter of 2022. In the same time period, the MSCI World ex-US, a broad-based index, returned -6.0% and the DFA International Small Cap Value Fund, our closest benchmark, returned -4.2%. As of March 31, 2022, our securities have a weighted average earnings/free cash flow yield of 18.5% and an average EV/EBITDA of 4.0. The DFA International Small Cap Value Fund had an average earnings yield of 13.2%. These multiples are lower than last quarter, primarily due to earnings increasing more than share prices declined. The difference between the portfolio’s market valuation and my estimate of intrinsic value is still greater than 100%. I remain confident that the gap will close over time and the portfolio growth potential will continue to increase as we increase allocations to faster-growing, higher-quality firms.
Bonhoeffer Fund Portfolio Overview
Our investment universe has been extended beyond value-oriented special situations to include growth oriented firms using a value framework, including companies that generate growth through transition and consolidation. There have been modest changes within the portfolio in the last quarter in line with our low historical turnover rates. We sold some of our slower-growing names and invested some of our cash into Countryside Partnerships (OTC:CUSPY – described in the case study below) and purchased more E.W. Scripps (SSP) and Asbury Automotive (ABG). There are also some interesting developments in the UK housing market that are described below.
As of March 31, 2022, our largest country exposures include: South Korea, Italy, South Africa, Hong Kong United Kingdom, and United States. The largest industry exposures include: distribution, telecom/media, real estate/infrastructure, and consumer products.
We added to some smaller positions within the portfolio and are investigating additional consolidation plays with modest valuations in industries that have nice returns on invested capital such as fiber rollouts, discount stores, and IT services.
Compound Mispricings (40% of Portfolio; Quarterly Average Performance -1.5%)
Our Korean preferred stocks, the nonvoting share of Telecom Italia, Wilh. Wilhelmsen, and some HoldCos all feature characteristics of compound mispricings. The thesis for the closing of the voting, nonvoting, and holding company valuation gap includes evidence of better governance and liquidity. We are also looking for corporate actions such as spinoffs, sales, or holding company transactions and overall growth.
A compound mispricing in your portfolio is Countryside Partnerships (CSP). See below for the CSP case study. Some updates on other compound mispricings within the portfolio include an announcement by NET1 UEPS that they were purchasing a South African SME payment processor using the proceeds from sales of their non-core assets. The price of this purchase is not cheap at 12x EBITDA; and the processor is the number three player in the SME market. Given this acquisition, a short-term return of capital is off the table and the upside of the combined asset consumer and small business asset is not as exciting as it was in the past. Additionally, Telecom Italia (OTCPK:TIIAY) is still in negotiations about the sale of their core network. Once the network is sold, TI should be able to focus on improving their core business. However, the constant delays and deteriorating short-term performance has weighed on the price of the shares.
Over the quarter, the common preferred discount for LG Corp (OTC:LGCOF) narrowed to 10% while the discount for Lotte Chilsung (OTCPK:LTTZF) increased to over 60%. We think the Lotte Chilsung discount should decline if the price of the common stock stays at current levels of around ₩200,000.
Public LBOs (41% of Portfolio; Quarterly Average Performance -1.5%)
Our broadcast TV franchises, leasing, building products distributors, and roll-on/roll-off (RORO) shipping companies fall into this category. One trend I’ve noted in these firms is growth creation through acquisitions which provide synergies and operational leverage associated with vertical and horizontal consolidation and the subsequent repurchasing of shares with debt. The increased cash flow is used to pay the debt and the process is repeated.
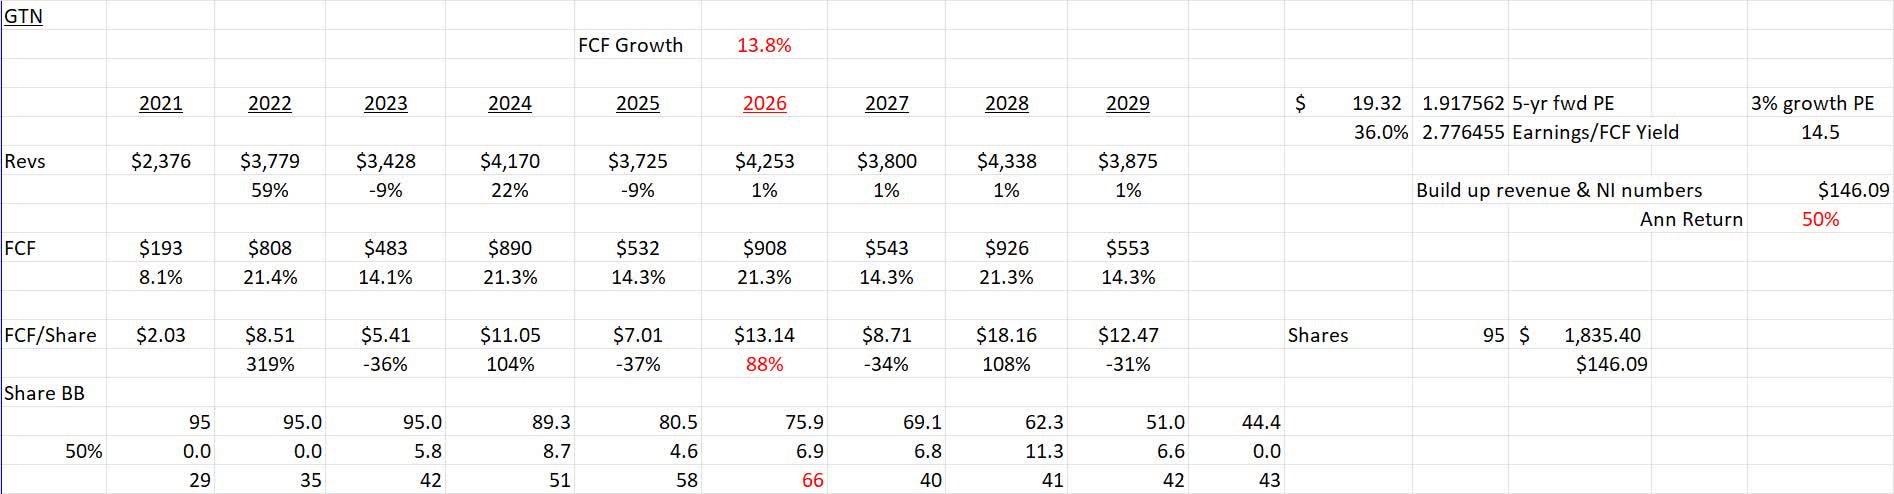
One category of leveraged firms you have in your portfolio is levered media firms. One example is Gray Television (GRAY), a local television firm with a primarily rural and suburban footprint nationwide (see my previous Gray Television writeup in the Q2 2019 letter). Gray has been adapting to the new media landscape. Gray has also rolled up local TV affiliates close to the FCC limit and has the six competitive advantages of local TV businesses outlined in previous letters, namely:
- cable and streaming retransmission fees (transitioning advertising revenue to recurring revenues);
- political advertising;
- economies of scale from vertical (content) and horizontal (other local station clusters) consolidation;
- owned spectrum that can be used as additional content distribution channels or leased to others;
- nonurban footprint leading to less competition; and
- ATSC 3.0 growth opportunities which are projected to be equal in size to retransmission fees (about 30% of Gray’s revenues) by 2030.
Gray currently trades for a nondemanding FCF multiple of about 3x and a free cash flow yield of 36%. Gray’s B-rated debt is currently yielding 6.8% for an FCF-debt yield of 29.2%, very high compared to the current equity risk premium of about 5%. The downside scenario factored into the stock price is an FCF decline rate of about 1.8% per year despite both near-term and longer support for FCF growth from retransmissions fees, political revenues, and ATSC 3.0.
Below is a five-year DCF illustrating the potential upside and implied FCF multiples if mid-term forecasts of free cash flow (not including any ATCS 3.0 revenue) are achieved.
Distribution Theme (37% of Portfolio; Quarterly Performance -3%)
Our holdings in car and branded capital equipment dealerships, convenience stores, building product distributors, and capital equipment leasing firms all fall into the distribution theme. One of the main KPIs for dealerships and shopping is velocity or inventory turns. We own some of the highest-velocity dealerships in markets around the world. Over the past two years, there have been challenges in some markets hit by COVID, like South Africa and Latin America; but there should be recovery over the next now that vaccines have been approved and distributed.
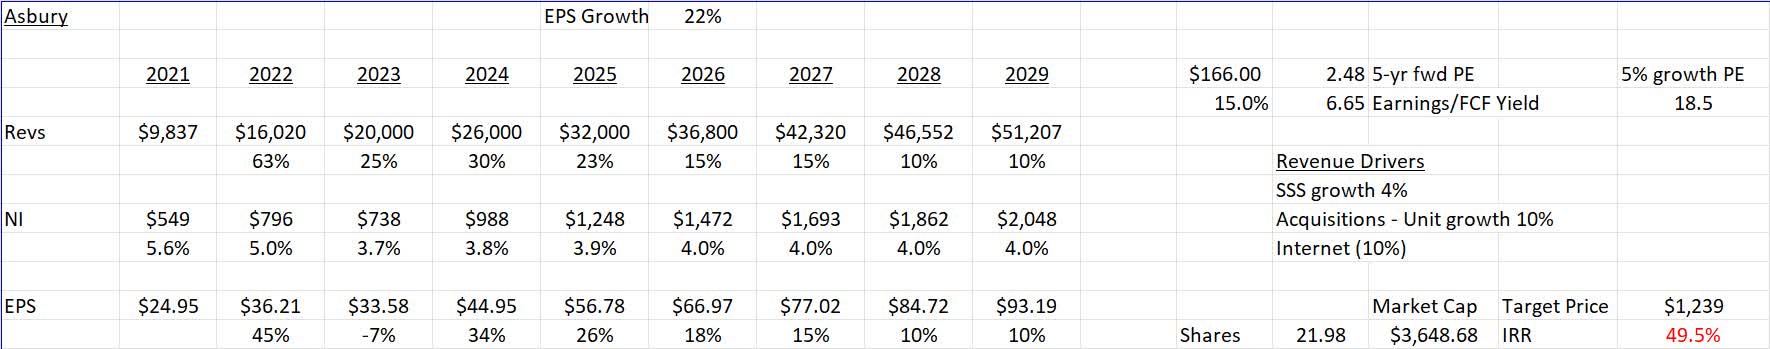
One of our holdings in the distribution theme is Asbury Automotive (Asbury), an automobile dealer. Asbury is one of the most efficient publicly traded US auto dealership groups with the highest inventory turns and margins despite not being the largest player in the market. This is due to Asbury’s clustering strategy of maximizing local economies of scale that can be found in most retail operations, including car dealerships. Other keys to Asbury’s expected EPS growth include further acquisitions, developing and deploying warranty, insurance, and financing services for its customers across its network of dealerships, growth of its online business, and growth of its sales and parts business in its current footprint. The auto dealership business is cyclical, but as the dealer groups get larger, their margins improve. Over the last cycle (2009-2019), the peak operating margins of Asbury, Lithia (LAD), and CarMax (KMX) have increased. In Asbury’s case, the operating margin increased from 3.3% to 4.6%. Also, for this current cycle, the pent-up demand for new cars will smooth out some of the downside versus previous cycles, where more cars were available for sales.
The current price/earnings multiple of 6.7x (15% earnings yield) is undemanding given the expected earnings growth of over 20% over the next five years. Asbury’s BB-rated debt is currently yielding 6.3%, resulting in 9% FCF-bond yield with a growing coupon rate of 20% per year versus a 5% market equity risk premium with a slower growth rate of 5%.
The expected cash flows based upon management’s guidance to 2025 are shown below.
Telecom/Transaction Processing Theme (39% of Portfolio; Quarterly Performance -1%)
The increasing use of transaction processing in our firms’ markets and the rollout of fiber-optic and 5G networks will provide growth opportunities. Given that most of these firms are holding companies and have multiple components of value (including real estate), the timeline for realization may be longer than for more mono-industry-focused firms. Most of these firms have been strong given their continued growth in telecom and processing revenues. The exception is Telecom Italia (OTCPK:TIIAY), whose issues I addressed above.
Consumer Product Theme (10% of Portfolio; Quarterly Performance 4%)
Our consumer product, tire, and beverage firms comprise this category. The defensive nature of these firms has led to better-than-average performance. The key driver was Lotte Chilsung preferred, who had a tailwind from its consumer products exposure. Lotte Chilsung also has a forward-looking upside from the narrowing of the preferred/common discount described above. One theme we have been examining is the increase in sales of adult products (tobacco, cannabis, gaming product offerings) in smaller convenience stores.
Real Estate/Construction Theme (24% of Portfolio; Quarterly Performance -2.5%)
In my opinion, the pricing of our real estate holdings has been impacted by both a recession and the communist takeover in Hong Kong. The current exposure cement and construction holdings (in US/Europe via BFS and Countryside and in Korea via Asia Cement) should do well as the world recovers from COVID shutdowns and governments start infrastructure programs. The laggards in this theme, Ashtead (OTCPK:ASHTF), Countryside, and Builders FirstSource (BLDR), have declined due to lower expectations for developed markets construction/housing demand due to increases in interest rates. These were offset by stronger performance from stocks benefiting from stronger-than-expected emerging markets construction and mining demand in Korea and Peru.
Firms in Transition
One theme of particular interest in our holdings and potential holdings is firms that are in transition. An example is firms who have encountered a disruptive innovation and are in the process of incorporating the innovation into their value chains. If they do not incorporate the innovation into their value chains, then the disruptor will disrupt the incumbent firms. If, by incorporating the innovation into their value chains, the incumbents lose customers and economies of scale, then one strategy they can follow is to spin off a company that develops a new value chain and incorporates the innovation. This has been successful for firms like 3M (MMM). Some of these innovations can lead to a less capital-intensive approach to providing products or services. Fragmentation can accompany these transitions, ultimately creating opportunities for consolidation as described in last quarter’s letter.
Incumbent Responses to Disruption
An incumbent’s response to market disruptions can ultimately make or break a company. An example of this can be seen in the incorporation of the internet (or online distribution) into traditionally offline business such as auto dealers, retail, media, and local advertising. With this incorporation, these businesses have become omnichannel businesses operating in the channel the customer wants to be serviced. Traditional local media advertising, for example, was primarily done through newspapers, yellow pages, or local television and radio. With the introduction of digital advertising, the channels expanded to include online and social media.
If we examine the history of digital disruption in media, we will begin with newspapers, whose two revenue sources—subscriptions and advertising—have been devastated by online competition. Advertising has been declining with a more fragmented audience and subscriptions have declined as other free sources of information found outside of newspapers have grown. The value chain for the new digital competition was different from the traditional newspapers, so the disruption was able to disintermediate newspapers from their customers. After losing both subscribers and advertising revenues, newspapers are ghosts of their prior selves, and their addressable market has been reduced to specialty subscriptions.
In radio, digital disruption has displaced the original use cases for radio, such as music promotion and local advertising. With the advent of new platform technologies (like Spotify – SPOT), which allow for customized song selection, the use case has been reduced significantly. Most radio stations have lost advertising revenue; however, some have expanded and focused on local advertising including digital ads, building digital ad platforms, and websites for local businesses. These firms have been transformed from radio station firms into local advertising firms of which radio is one channel to advertise.
For television, there have been previous disruptions (cable television) and the legacy local television business has survived but grown at a slower rate. Before cable was widespread, media was controlled by the big three networks (ABC, CBS, and NBC) and Fox. Each of these networks had local affiliates who produced local news and weather and broadcast network programming. The networks were funded by both local and national advertising. In the 1960s and 1970s, these networks dominated the distribution of TV content.
The first disruptor—cable—changed the landscape as an alternative way to consume media. At first, cable rebroadcasted network television and added subscription-only channels like HBO. As time went on, additional channels supported by both subscription payments and advertising were added. Cable bundles of content evolved over time and became the primary source of TV content consumption. Over time, the cable form of distribution overtook the network/affiliate form of distribution, as it provided more channels (selection) and had replay capability. However, the network/affiliate model expanded to include more networks (like Fox) and content and remained relevant despite the dominance of cable television.
Recently, the internet has disrupted the cable TV business via streaming. Streaming is challenging the cable and network/affiliate distribution models. Both cable and network/affiliates are expanding their capabilities to try to match streaming’s functionality. Television has been less affected than newspapers and radio by online innovation as the use case still exists, but the addressable market is further segmented amongst the streaming providers. Through these disruptions, there has been consolidation of first network affiliates, then cable TV and cable networks, and in the future, streaming content providers.
The two new media channels of search engines and social media have further segmented the traditional media advertising market, in addition to having a better consumer targeting ability than traditional newspaper, radio, and linear television. A new TV media format, connected TV (CTV), provides a similar targeting functionality as search engines and social media. Of the traditional forms of media, TV has adopted the new innovation (enhanced consumer targeting) via CTV and thus has remained more relevant to advertisers versus radio and newspapers. The implementation of improved internet security by Apple, allowing users to elect not to have sites track your activity, will reduce the accuracy of targeting that social media provides.
Another industry in transition is automobile dealers. New online players like Carvana (CVNA) and Vroom (VRM) have entered the used car dealership market to compete against new and used car dealers such as Asbury, Lithia, and CarMax. Carvana has the most integrated model of the disruptors including sourcing, reconditioning, financing, selling, and delivering automobiles across the US. Some of the larger dealer groups, like Asbury and Lithia, provide these services, plus new car sales and auto service and parts on a localized basis. To date, Carvana has provided a better online purchasing experience than the typical car dealership. Some of the larger dealership groups like Asbury and Lithia have integrated an online dealership functionality/experience into their service offering and have had similar success as Carvana in attracting new customers. In addition, some of the auto original equipment manufacturers (OEMs) are using an agent model for electric vehicle (EV) sales where dealers are paid on a per car basis for assisting customers as they select and customize automobiles. The agency model is less capital intensive than the traditional dealer model, as the OEM delivers the automobile to the customer. In cases where this model has been used in China, the RoICs have been in the range of 50%, higher than current dealership RoICs. In addition to this transition, auto dealers are in the process of consolidation, which can add to consolidators’ revenue and earnings growth.
Less capital-intensive transitions can be seen in both auto dealerships described above and homebuilders like Countryside described below.
Conclusion
Admittedly, as we approach the close of the second quarter, this letter is arriving later than I had originally anticipated. However, I had multiple opportunities that I couldn’t pass up. In the past few months, I’ve been an invited guest for some exciting summits and traveled for an investment panel during the 2022 Berkshire Hathaway pilgrimage. Videos and interviews from my appearances can be found on the Bonhoeffer website’s “In the News” section. As always, if you would like to discuss any of the philosophies or investments in deeper detail, then please do not hesitate to reach out. Until next quarter, thank you for your confidence in our work, and be on the look for an invitation to my Q2 Investor Q&A!
Warm Regards,
Keith D. Smith, CFA
CASE STUDY: COUNTRYSIDE PARTNERSHIPS (OTC:CUSPY)
Countryside Partnerships (CSP) is a homebuilder and renovator servicing the local authority (LA) and home association (HA) market located in the United Kingdom. CSP is part of our transformation theme described above. Countryside is transforming itself from a traditional homebuilder that owns land and builds homes on that land which then sell to individuals to a homebuilder who builds and upgrades homes on a contract and partial ownership basis for nonprofit LAs and HAs (the “partnerships business”) which are quite common in the UK. There are two advantages to this model: (1) HA home construction can be scheduled because HA payments are known in advance, thus providing homebuilding economies of scale; and (2) the payments for land can be deferred until the sale. This transformation was facilitated by activists Browning West and David Capital, who together hold 20% of the equity of CSP and have a board seat.
Many of the LA and HA homes were built around World War II, so many are in the need of renovation and expansion. About 72% of CSP’s earnings are currently associated with partnerships and will transition to 100% by 2024. Over the past five years, the partnership segment has grown earnings 14% per year.
HA and private rented sector (PRS) contracts provide stability of revenue for homebuilders, as the affordable housing and renovation revenue is not dependent upon cyclical private home sales but on HA steady cash flows and ability to borrow at low interest rates. This allows homebuilders to gain economies of scale in homebuilding that can be shared with the HA. Partnerships also require less capital, as the land is provided by the HA or other UK government agencies—like Homes England—on a deferred payment basis. PRS sales are purchased by institutional investors that rent the units to individuals. Finally, the UK government is directly funding (£1.8 billion for regeneration and £11.5 billion for new affordable housing over the next five years) both LAs and HAs to develop affordable housing. A minimum of 25% of the new affordable housing built with these funds must be built using modern methods of construction (MMC), including modular housing. Currently, there is a waiting list of 1.2 million households to live in affordable housing units, including PRS. CSP’s mix of affordable and PRS to market rate housing is higher than most of its peers at 60%/40%. The affordable housing segment is expected to grow by 10% per year and the PRS segment by 10% to 15% per year over the next five years.
In a mixed tenancy arrangement (CSP’s focus), the partnership receives a portion of homes to sell into the local market in exchange for developing or renewing an HA development. The other arrangement is partner delivery, where homebuilders outsource homebuilding but not development. Most HAs do not have the operational capability to perform the development themselves, thus outsourcing this function to partnership firms such as CSP. To develop relationships with LAs and HAs (to successfully bid and win contracts), CSP has established 15 regional teams in the Home Counties, the South, the Midlands, and the North of the UK. HA bid selection is based upon pricing (40% weighting) and non-pricing/design criteria (60% weighting). Historically, CSP has been strong in the South and Home Counties regions. To enhance their position in the Midlands and the North regions, CSP purchased a partnership firm, Westleigh, in 2018.
In addition to the partnership business, CSP has a manufacturing business which provides modular housing, including open and closed panels and prebuilt timber framing of housing. This is important to win bids, as one of the HA’s criteria for developer selection is the building of homes in a modular fashion.
In addition, modular construction increases inventory turns, as the time to build a home is less than traditional stick or brick construction. CSP has three factories—two located in the Midlands and one in the North region—with a total capacity of 6,000 units per year. This division is expected to run at breakeven at a volume of 4,600 units and supply CSP with modular housing. CSP has the highest quality rating for homebuilders in the UK—five stars.
Another UK property developer, Vistry Partnerships, has a similar division focusing only on HAs with about 50% mixed tenure and 50% partner delivery (where the homebuilding is outsourced). Similar capital-light models are currently being implemented by NVR in the United States (via options versus land purchases), Kaufman & Broad (OTC:KFMNF), and Nexity (OTCPK:NNXXY) (via the homeowners owning the land before purchase) in France and Shinoken Group (OTC:SHIOF) (via homeowners receiving corporate subsidies) in Japan. These capital light firms have higher inventory turns than their homebuilding peers. CSP has the largest market share in the UK partnership mixed tenure business of 8% with a run-rate of about 4,000 homes per year. CSP’s ASP is about £285,000 per home. Most homes in the partnership market are provided by the HA themselves via partner delivery (about 70% of the total) so there is room for further missed development penetration in this market. Each of these markets is a local market and CSP has region-specific teams that service the HAs in each of four UK regions (Home Counties, Midlands, North, and South). CSP’s current backlog is about 6,000 homes, and its pipeline includes 20,000 homes where terms have been negotiated and an additional 50,000 homes where terms are under negotiation.
CSP has developed the partnership by region. In 2021, in more mature regions (32% of volume), CSP generated RoICs of 36%, while underperforming and developing regions generated RoICs of 3.2%. CSP plans on migrating the underperforming regions to mature regions and the developing regions to mature regions by 2025. A developing region requires about five years to reach maturity.
CSP has little debt and is liquidating its homebuilding assets. To date, CSP has liquidated £150 million and plans to receive an additional £300 million over the next two years. Management has stated that they will perform buybacks totaling £450 million and satisfy legacy liability such as safety retrofits (£110 million estimate) with these proceeds. Given the decline in CSP’s stock price, these buybacks are very accretive. CSP has repurchase 5% of its shares since it began its repurchase program last year. Currently, CSP sells at 7.6x 2022 estimated EPS.
UK Partnership Business
The overall UK real estate market has historically grown as its population has grown, and this is expected to continue into the future. According to Deutsche Bank (DB), the UK is expected to increase the number of households by 3.5 million by 2037 from a base of 28.2 million in 2021, a rate of about 220,000 new households per year. Housing completions are currently about 170,000 per year.
Typically, homebuilding is a good business but requires capital-intensive land to build on to provide the end product to customers. Thus, the business is comprised of a good business (building homes) and a not-so-good business (owning land until the houses are built). The homebuilding-only business can generate RoEs in the 20% to 40% range while land ownership generates RoEs in the single digits. In addition, homebuilders typically borrow money to purchase the land. Some homebuilders have found ways to make homebuilding less capital intensive and thus have higher returns on capital. First, some homebuilders have used option contracts which they have exercised when they have an order. Second, some have required homeowners to purchase the land themselves and they will then build on the homeowners’ land. Finally, some (partnership business) have built and remodeled homes in exchange for selling some of the new or remodeled homes to customers.
The UK partnership business includes HAs and LAs completions. The total UK market size is about 170,000 homes pre year, of which 120,000 per year are private development and 50,000 per year are HA and LA development. Since many of the HAs have not been updated since their founding (around World War II), there is a lot of pent-up demand for partnership housing. HAs and LAs provide about 70% of the development themselves (outsourcing the construction) while 30% of the developments are outsourced to firms like CSP (mixed tenancy). The largest mixed tenure third-party firms include CSP (8% market share), Vistry Partnerships (6% market share), Kier Living (4% market share), and Lovell (3% market share). All of the competitors except CSP also have traditional homebuilding groups. The levers for future growth are market share growth and greater third-party penetration into the HA development market.
CSP has developed a growing pipeline of mixed tenancy projects that should increase recurring revenue by 10% to 15% per year over at least the next 10 years. In addition, the partnership business has generated higher margins of 15% than the traditional homebuilding business of 7%.
Downside Protection
CSP has no debt and will be returning capital via buybacks as the homebuilding assets are monetized. The consistency of the cash flows from HA and PRS contracts will allow local economies of scale to be achieved that are not dependent upon local pre-sales. The nature of the contracts with HAs and PRS investors will lead to more predictable cash flows than building and then selling homes. For most partnership projects, the cash for the land will be deferred until sale of affordable or PRS units, thus lowering the inventory investment and risk versus a traditional homebuilder.
Another protection is that the partnership business is less affected by interest rates than traditional homebuilding, as the end customers—HAs and LAs—have steady income streams from tenants and can borrow at lower interest rates versus tradition homebuilding customers who are interest-rate sensitive.
With the opening of offices in the North, Midlands, and South, CSP’s geographic footprint was widened and smoothed out regional variations in housing demand. The history and projected financial performance for CSP is illustrated below.
Management and Incentives
CSP’s management has been focused on developing its partnership business by evaluating association opportunities and focusing on the high return on capital opportunities. In the past, CSP has been focused on growth even if the expected return on capital was not acceptable. This approach (which has subsequently been remedied), in combination with the transformation of the firm, the dismissal of the CEO, and a decline in the UK homebuilder market, has led to the recent price decline. At the same time, CSP is repurchasing stock from the proceeds received from the sale of the asset of the capital-intensive homebuilding business. The senior executives have bonus pay based upon adjusted operating profit and margins, and customer satisfaction targets paid 33% in shares and 67% in cash. For the long-term incentive, the payout is in shares based upon relative total shareholder returns, tangible NAV, and return on capital employed.
The activists on the board (Browning West and David Capital) have facilitated the transition and own about 20% of the equity. Another activist firm, Inclusive Capital Partners headed by Jeff Ubben, has recently acquired an approximately 10% stake. The firm is looking for a new CEO and is now co-led by the leaders of the London and South partnership cluster groups.
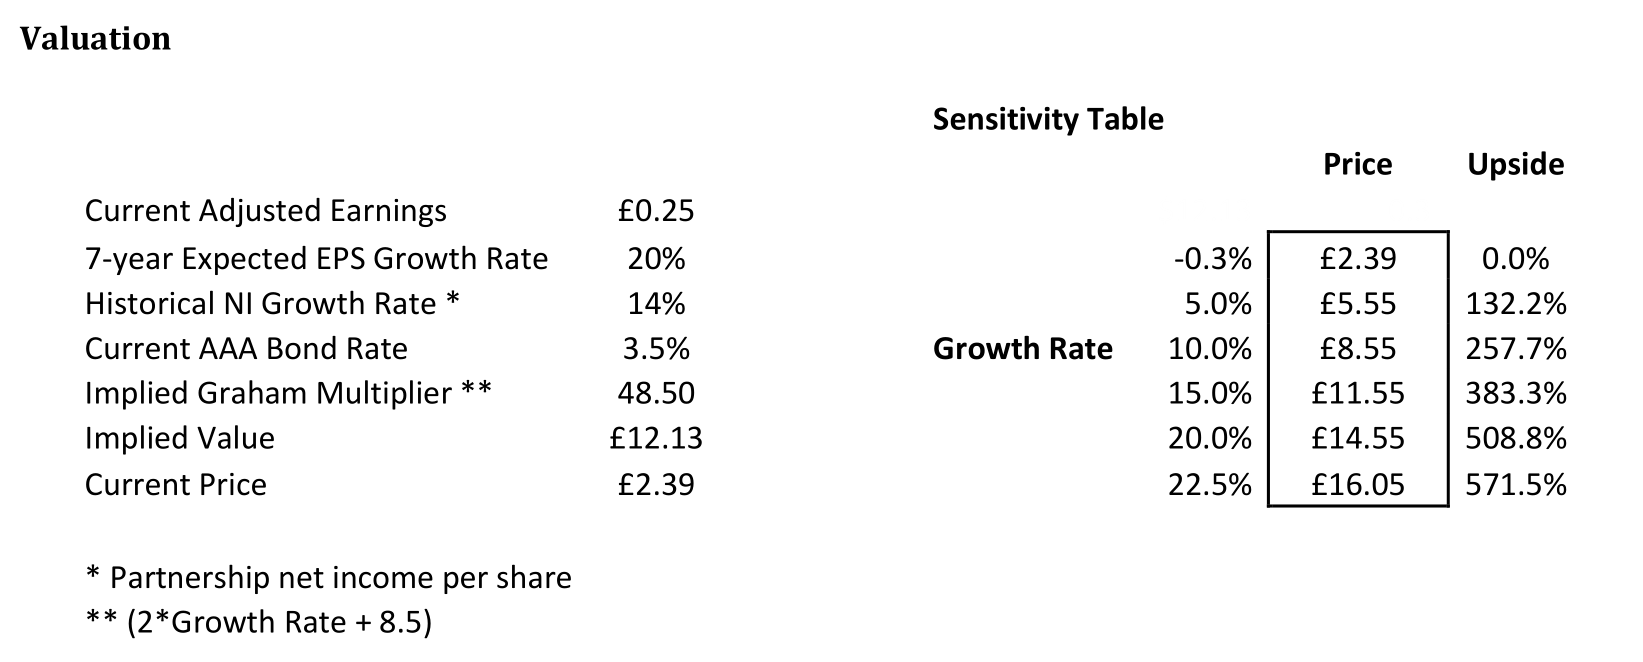
The key to the valuation of CSP is the expected growth rate. The current valuation implies an earnings/FCF decline of -0.3% into perpetuity using the Graham formula ((8.5 + 2g)*(4.4/AAA bond rate)). The historical 10-year FCF growth per share has been 14% per year including acquisitions, with a current FCF return on equity of 20%.
A bottom-up analysis, based upon growth rates of new homes in the pipeline and to be built, results in a 20% growth rate (see below) with the affordable housing market growing by 10% and the PRS market by 10% to 15% per year. The resulting current multiple is from 48.5x (assuming a 20% growth rate) while CSP trades at an FCF multiple of 8.7x. If we look at firms with lower growth rates (Kaufman & Broad), they have FCF multiples of 14x FCF. If we apply 14x FCF to CSPs 2024 EPS of £0.48, then we arrive at a value of £6.72 per share, which is a reasonable short-term target. If we use a 20% seven-year growth rate, then we arrive at a value of £14.55 per share. This results in a five-year IRR of 44%.
Below is a forwarding-looking cash flow estimate for CSP based upon management’s guidance in terms of home delivery rates.
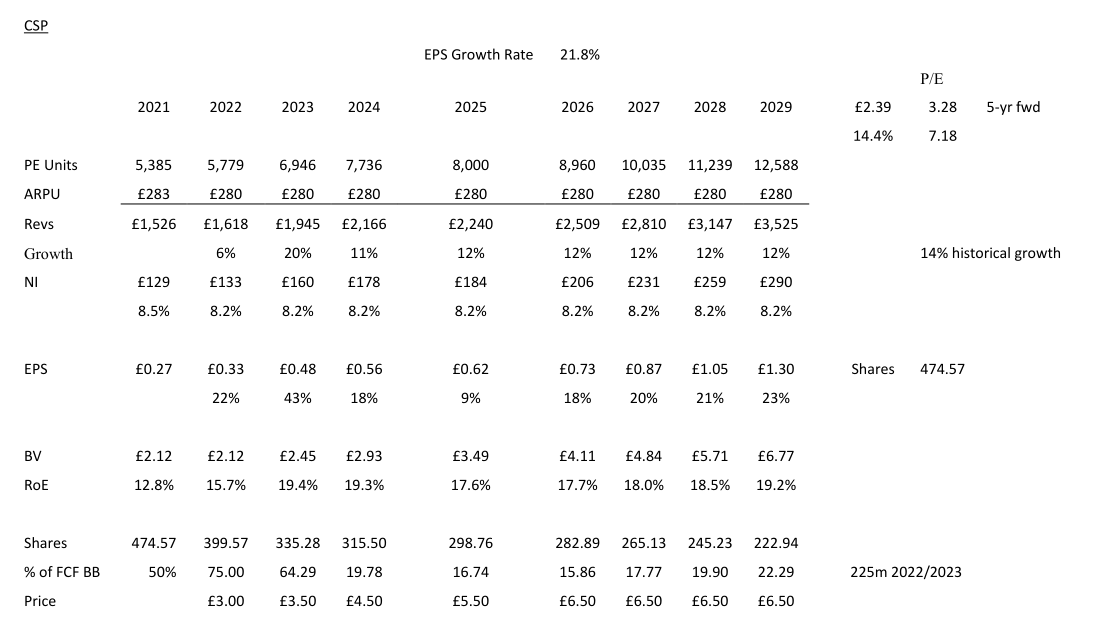
In this analysis, we assume the £450m in sale proceeds from the legacy homebuilding will be used to repurchase in 2022 and 2023, as well as 50% of the net income thereafter. We also assume reaching the 8,000 per year home delivery level by 2025 based upon management’s expectations. This results in a forward P/E ratio in 2026 of 3.3x using the current share price. The five-year EPS growth rate using these assumptions is 21.8% per year.
Comparables
|
High RoE Home Builders |
Inv Turns |
EBIT Margin |
Return on Equity |
Debt/ Equity |
P/E |
P/BV |
20-23 Growth Rate |
|
NVR (USA) |
3.70 |
18.3% |
40.5% |
0% |
13.9 |
5.21 |
9% |
|
Vistry Group (UK) |
1.01 |
13.2% |
11.1% |
0% |
6.2 |
1.22 |
12% |
|
Countryside Partnerships (UK)* |
2.20 |
11.0% |
27.5% |
5% |
8.7 |
1.41 |
20% |
|
Dream Finders (USA) |
2.08 |
7.6% |
36.0% |
53% |
13.5 |
1.57 |
56% |
|
Shinoken (Japan) |
2.49 |
9.4% |
13.9% |
4% |
5.9 |
0.79 |
0% |
|
Kaufman & Broad SA (France) |
2.65 |
8.0% |
24.4% |
19% |
14.2 |
8.69 |
5% |
|
JM (Sweden) |
1.37 |
14.0% |
22.6% |
27% |
12.4 |
2.51 |
2% |
|
* Adjusted for the sale of homebuilding assets (£450m) |
|||||||
The comparable firms are homebuilders worldwide which have a capital-light approach to homebuilding (either through optioning of land purchases or having third parties purchase the land) and generate a high return on equity. All of these firms have high inventory turns and decent EBIT margins. Compared to these firms, CSP is undervalued given its high growth rate, inventory turns, and return on equity. CSP is also less levered than most of the comparable firms. One differentiating factor for CSP is a large portion of their revenue (60%) is from nonprivate market sales and thus is less dependent upon cyclical housing sales trends.
Risks
The primary risks are:
- slower than expected partnership starts or new contract wins; this can be either from new pandemic delays (if one pops up) or for HA specific reasons; and
- government decides to limit the amount of HA contracts awarded to third-party developers.
Potential Upside/Catalyst
The primary catalysts are:
- more HA partnership market penetration;
- larger-than-expected repurchases;
- recovery in private real estate market; and
- more government funding for affordable and PRS housing.
Timeline/Investment Horizon
The short-term target is £6.72 per share, which is 181% higher than today’s stock price. If the successful transition to partnerships thesis plays out over the next five years (with a resulting 20% FCF growth per year), then a default adjusted value of £14.55 could be realized. This is a 44% IRR over the next five years.
Editor’s Note: The summary bullets for this article were chosen by Seeking Alpha editors.
Be the first to comment