

cagkansayin
It’s Probably Still A Bear Market For Stocks
On 6/14/22, Seeking Alpha published my article, “Welcome To A Bear Market – Expect Another 10% Down“. In that article, I estimated a fair value of 3400 for the S&P 500 (SPX). Two days later on 6/16, the S&P hit its most recent bottom of 3666.77 and went on a two-month rally, up 17.4% to 4305.20 on 8/16. Was my negative outlook a contrarian indicator or does the bear have further to run? Ten days later, the market took a big hit on Fed Chair Jerome Powell’s Jackson Hole Speech, then continued to decline with another big drop on 9/13 coinciding with the August 2022 CPI release. As of the time of writing (9/17) the S&P has given back 50% of its June-August rally and sits in a no-man’s land for technical analysts with a big move but uncertain direction.
From a more fundamental perspective where interest rates are a key variable in determining equity valuations, down is still the more likely direction. Let’s see how my simple valuation model has changed since the June article.
Author Spreadsheet
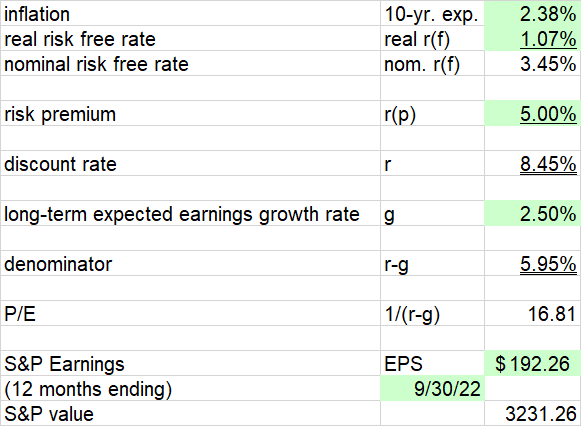
The 10-year treasury rate, which I use as the risk-free rate, is nearly unchanged from June 16. However, the real risk-free rate as estimated by the 10-year TIPS yield has increased 38 basis points to 1.07%. The implied 10-year inflation expectation has therefore decreased by 36 basis points. The bond market believes the Fed is more serious about fighting inflation, and even expects some success, if only over the longer term.
The S&P earnings value (prior 3 quarters actual plus estimate for the current quarter) has declined from $200.02 to $192.26 as the model has rolled forward one quarter. This lowers the midpoint S&P 500 fair value estimate to 3231 from 3373 in June. S&P does mention that over half of this decline comes from Berkshire Hathaway’s (BRK.A) (BRK.B) large negative GAAP earnings hit from its equity portfolio mark-to-market. As Warren Buffet always points out, these short-term equity gains and losses are not meaningful to Berkshire’s long term intrinsic value, but I like to use the GAAP earnings in this model to be more conservative. If I adjusted the S&P earnings to back out the Berkshire mark-to-market effect, modeled fair value still would have declined to 3310.
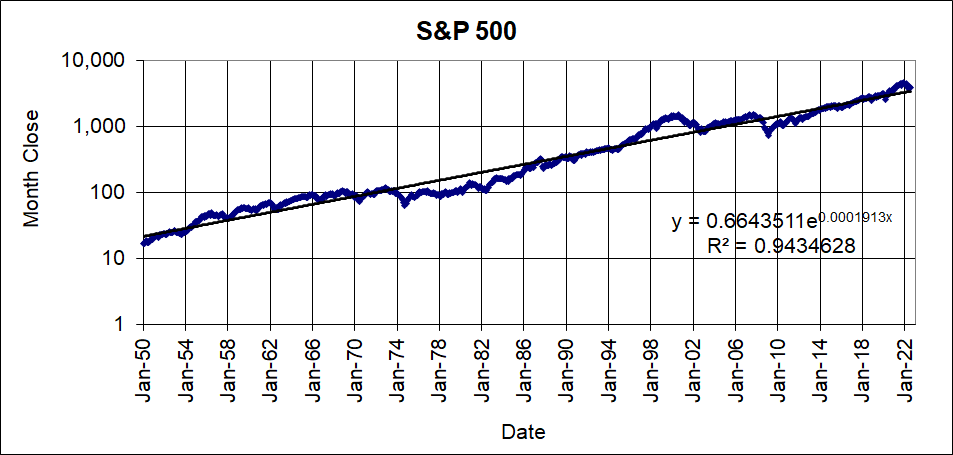
Updating my long-term S&P trend line model, the S&P is still above the long-term trend line which stands at 3517. (Note that the x values in the equation are dates using the Excel serial date format where 1/1/1900 = 1.)
Author Spreadsheet
Averaging these two methods and rounding, 3400 is still a good fair value estimate for the S&P 500. That implies a 12.2% downside from current levels.
TINA, Meet BANANA
More investors are coming around to this view, including Jim Sloan who rhetorically asked “Is Now A Good Time To Start Buying Bonds?” in an excellent article. Spoiler Alert: The answer is “yes”, although Jim was focused on Treasury notes and Treasury ETF’s. When I asked Jim in the comments why he wouldn’t also go further out on the credit risk spectrum to get higher yields, he noted that he likes to “keep risk assets and safety assets separate”. There is nothing wrong with that approach. I agree and would also include Series I savings bonds and Tennessee Valley Authority PARRS (TVC) (TVE) in the safety asset bucket. For many years, really since the Fed began quantitative easing after the 2008-09 financial crisis, bonds have had low yields. This resulted in expanding valuations for stocks, giving rise to the acronym TINA (There Is No Alternative). TINA went on steroids in the year and a half following the March 2020 COVID crash when the Fed rapidly cut the Fed Funds rate to near zero and massively expanded QE. Unlike previous crises, public health authorities and Congress also got in the game, triggering supply-curtailing shutdowns and passing massive demand-increasing stimulus spending. After a long period of trying to get inflation above 2%, we now have a period of high inflation. The resulting higher interest rates have caused TINA to give way to what I like to call BANANA (Bonds Are Now A Nice Alternative).
With the S&P still looking overvalued, my expected return for the S&P over the next several years is below average. There are now many corporate bonds available with 0-7 year maturities having a yield to maturity greater than my expected S&P return. I estimate the S&P return by assuming a reversion to the long-term trend line in the graph above, plus a growing stream of dividends. If I plug in dates into the equation on the above chart, I can estimate the forward S&P values. I then add in a starting S&P dividend yield of 1.73% and I grow the dollar value of dividends by a generous 11.28% per year (the actual dividend growth over the past 12 months).
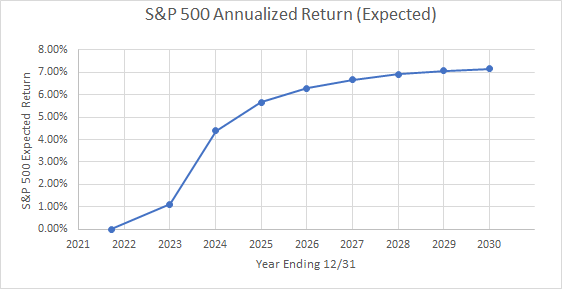
| Date | S&P 500 (Expected) | S&P 500 Annualized Return (Expected) |
| 2022 | 3873.33 | 0.00% |
| 2023 | 3847.67 | 1.11% |
| 2024 | 4126.73 | 4.39% |
| 2025 | 4425.17 | 5.65% |
| 2026 | 4745.2 | 6.29% |
| 2027 | 5088.37 | 6.66% |
| 2028 | 5457.41 | 6.90% |
| 2029 | 5852.09 | 7.06% |
| 2030 | 6275.31 | 7.16% |
| Annualized returns include dividends | ||
Author Spreadsheet
The reversion to the trend line is of course a big assumption, but in times of high interest rates it is a generous one. As we see in the first chart, the actual S&P can trade below the trend line for a long time when interest rates are high, as it did from 1974-1986.
For the next year or so with the S&P expected to correct further, even Treasuries are a good alternative to stocks with the 1-year T-Bill rate approaching 4%. Further out, my expected S&P return in roughly the 2026-2029 time frame matches up with yields to maturity of corporate bonds in the BB to BBB area. I can understand the reluctance to dip down into junk territory, but bonds are still higher in the capital structure than their corresponding stock. Unlike stocks, you know exactly what you will get back, barring a default. While there is extra safety compared to the corresponding stock, the possibility of default risk means you should still consider these bonds for the higher-risk part of your portfolio.
For example, here is a screen of junk bonds in the S&P BB to BB+ range (Moody’s BA2 to Ba1) maturing in 2028. Many bonds are available yielding higher than my expected S&P return of 6.9% from retailers, home builders, and even more defensive sectors like health care.
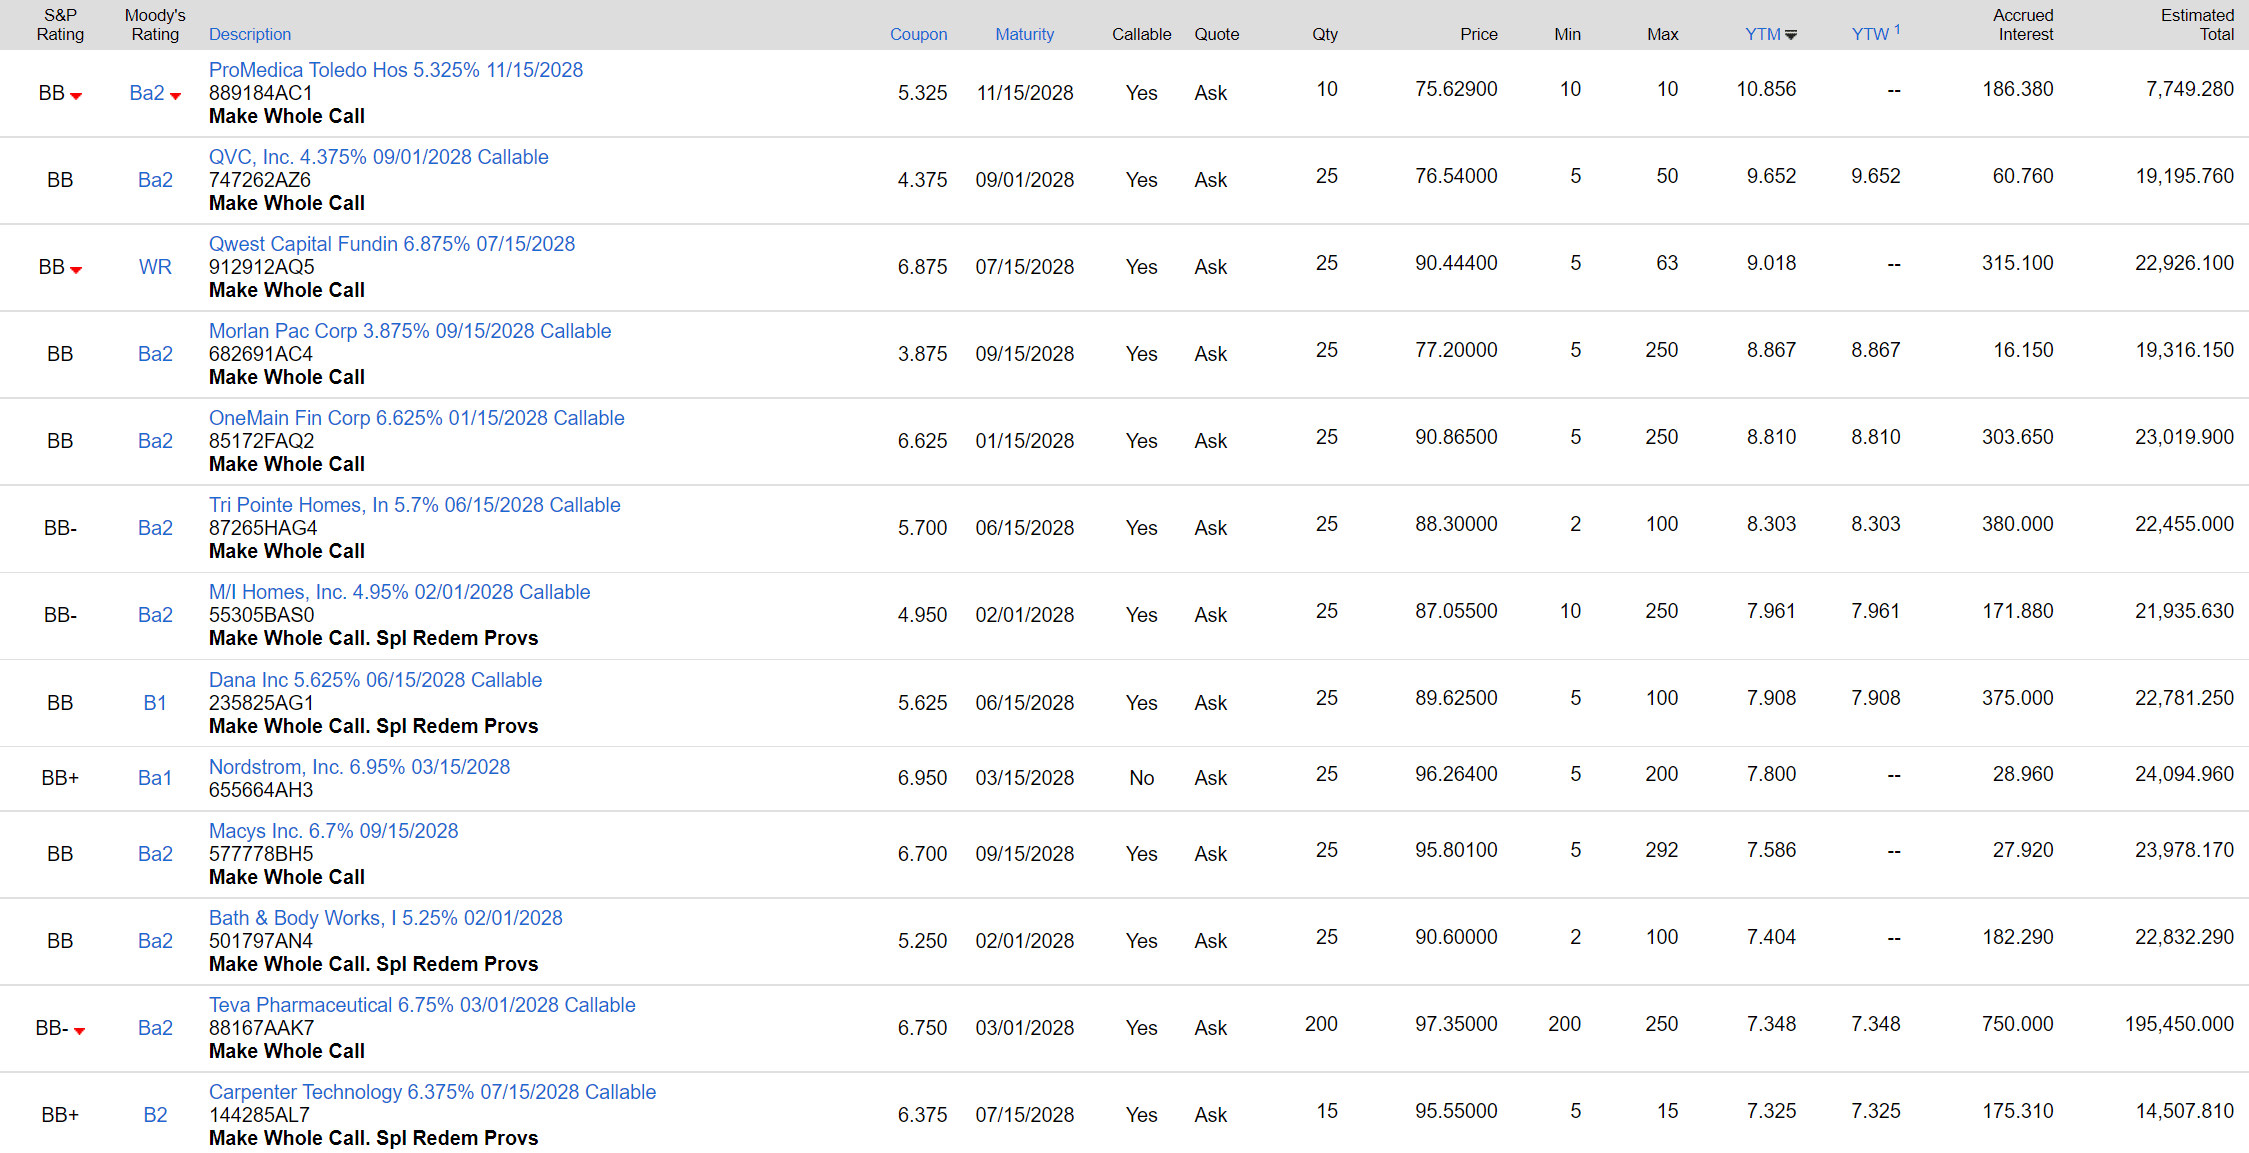
Charles Schwab
Please note, I am NOT suggesting you just buy the highest yielding bonds in the screen. You should always consider credit quality yourself, looking at interest coverage, debt/EBITDA, cash on the balance sheet, and prospects for these to change before maturity. The contributor articles and company financials pages on Seeking Alpha for the corresponding stocks are a good place to start this research.
If we move up into investment grade bonds due 2028, we see that there are still a few yielding above 6.9%. Many of these are REITS and business development companies whose stocks are frequently discussed and recommended on this site. If you think the stocks are safe, the bonds are safer, with yields a little below the stock’s dividend yield. Unlike the stocks, you know you can get your principal back on the maturity date, barring default.
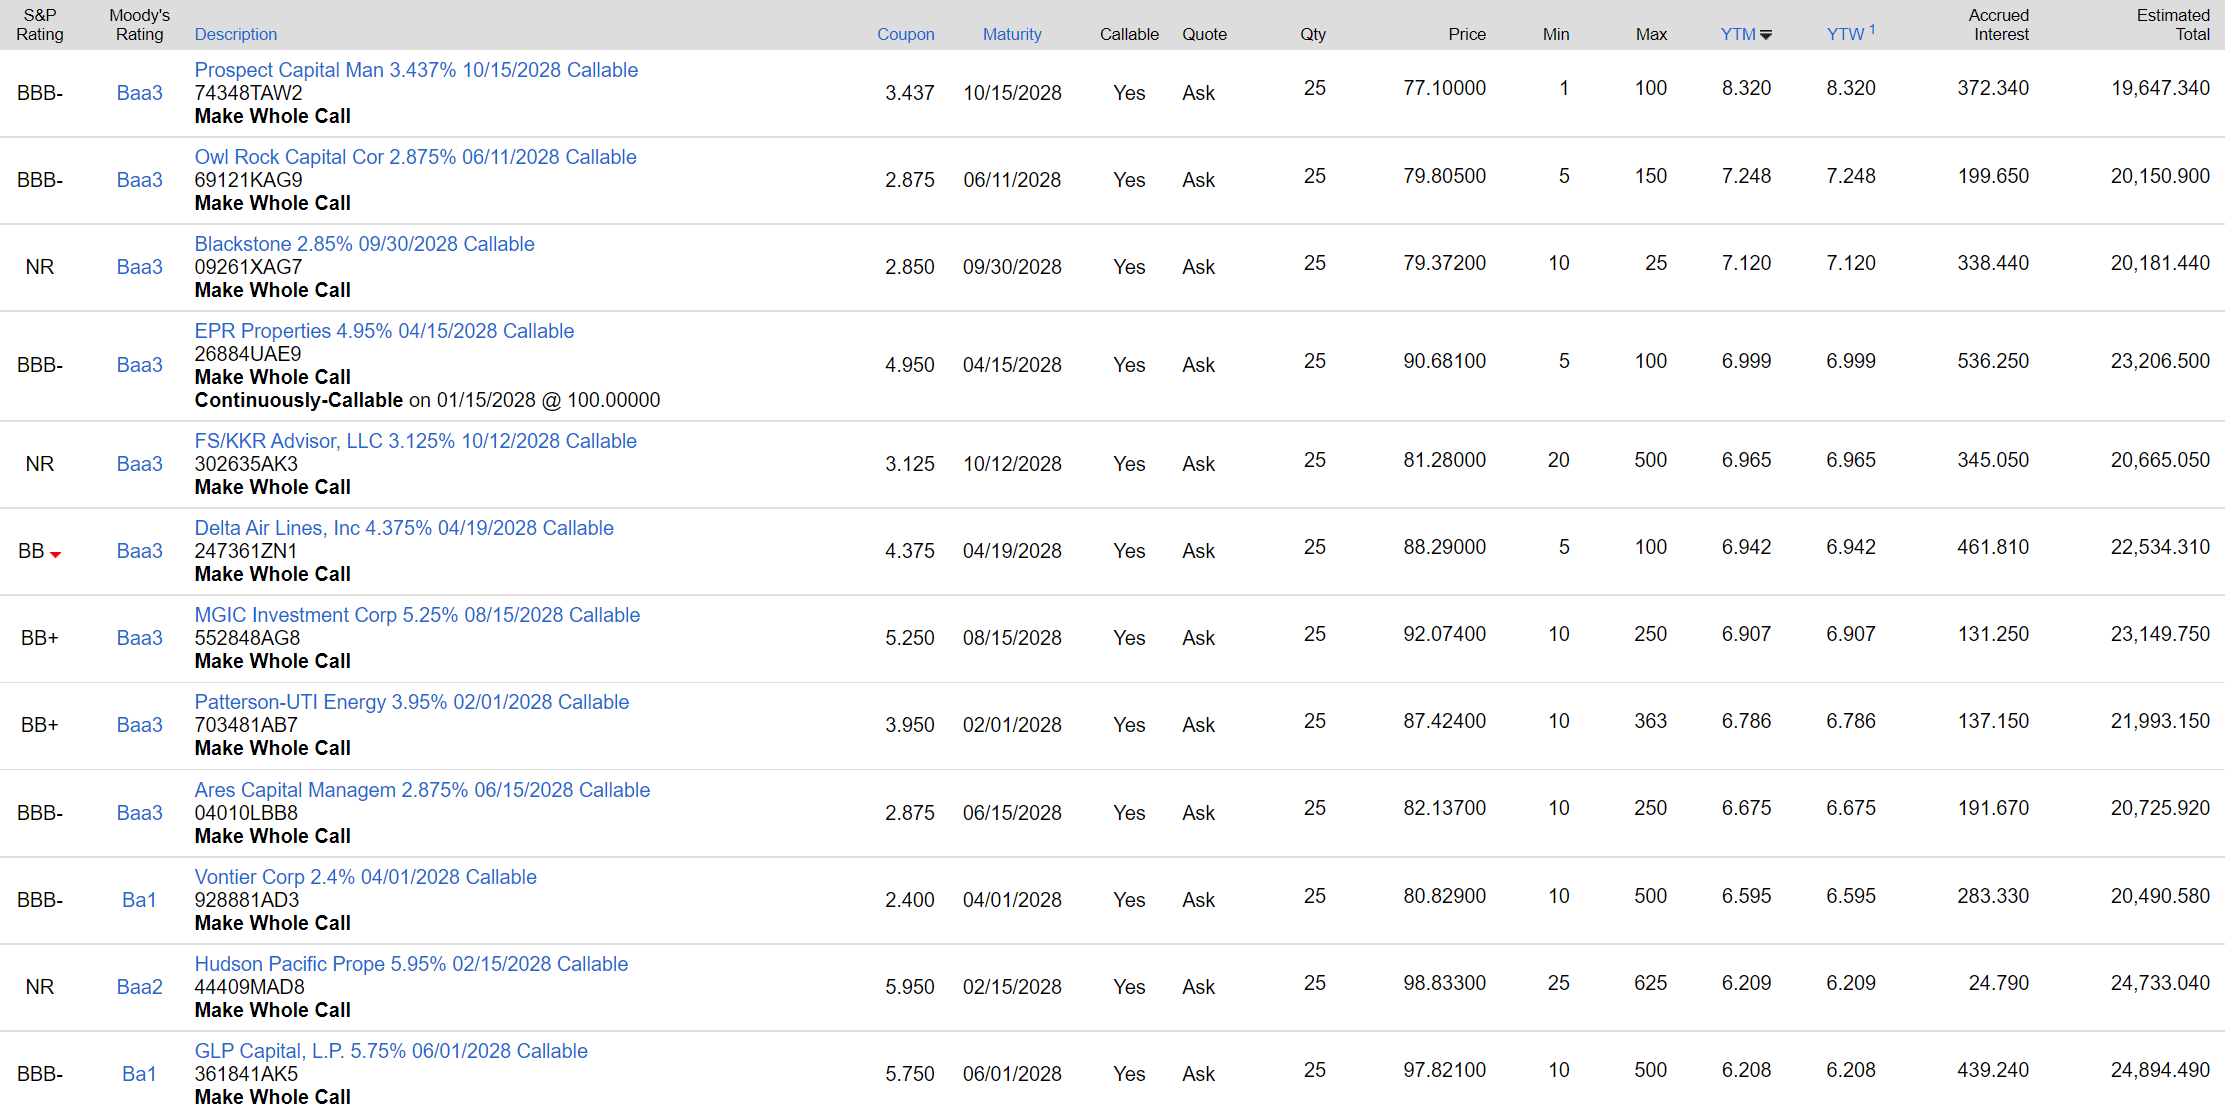
Charles Schwab
As we see, there are now many alternatives to stocks for those seeking total return as well as income.
Portfolio Changes
After ending 2021 at a near record low fixed income allocation of 12.6%, I have expanded it to 16.8% at time of writing. I started building my corporate bond ladder in the 2024-2026 time frame as discussed in my mid-year review. Since then, I have extended maturities out to 2029 with the following securities:
- Synchrony Financial (SYF) 3.95% due 12/1/2027 (CUSIP: 87165BAM5)
- Western Midstream (WES) 4.75% due 8/15/2028 (CUSIP: 958254AK0)
- TVA PARRS due 5/1/2029 (TVE)
- TravelCenters of America (TA) 8% due 12/15/2029 (TANNL)
The TravelCenters baby bonds were funded by tendering 2024 and 2025 EnLink Midstream (ENLK) bonds back to the company at or greater than par. That is another benefit of good bond investing in this market. If you find a sector like Energy where companies are printing cash flow and are increasing cash on the balance sheet, a tender offer could get you an early capital gain while there are still good reinvestment opportunities.
Also in the second half of the year, I traded Nuveen’s quality Ohio muni bond fund (NUO) for its national muni fund (NAD). This harvested a tax loss and got me a higher yield and better total return performance as I discussed here.
Finally, I sold a high P/E, average-yielding stock in Exelon (EXC) for higher yielding investments. Most of this went into increasing positions in other stocks I already owned including Barrick Gold (GOLD), Itochu (OTCPK:ITOCY), and AT&T (T). However, I also increased my position in PIMCO Dynamic Income Opportunities Fund (PDO).
PDO was probably my riskiest move as increasing short term rates will increase cost of leverage, but I like the distribution coverage and discount to NAV even if I am a little early.
These are the entirety of my second half 2022 trades, so you can see I still do not find most stocks attractive except for beat-up higher yielding value stocks. Many bonds now offer a yield to maturity that is competitive with expected S&P 500 return over the medium term.
Conclusion
Higher interest rates will probably prolong the bear market in stocks, but they are now creating opportunities to buy bonds at attractive yields. There are many bonds in the BB to BBB quality range maturing in 1-7 years with yields to maturity competitive with the expected S&P 500 total return. Default risk is always possible with bonds, but the return of par value at the maturity date is an attractive feature in a volatile stock market. Now is a good time to increase bond allocation relative to stocks in the risk asset part of the portfolio.
Be the first to comment