


byakkaya/E+ via Getty Images
Written by Nick Ackerman, co-produced by Stanford Chemist. This article was originally published to members of the CEF/ETF Income Laboratory on April 2nd, 2022.
BlackRock Enhanced Global Dividend Trust (NYSE:BOE) is presenting investors with a fairly attractive time to begin a position. I’ve owned this fund for a while now but have seriously considered adding more recently. Historically, the fund has underperformed its U.S.-based peer fund, BlackRock Enhanced Equity Dividend Trust (BDJ). This was by quite a significant degree. The tilt towards global positions primarily sets these two apart, and that’s exactly what had held BOE back.
Going forward, international positions are cheaper. I suspect we will see 2022 with international stocks as the laggard once again. This would be due to Russia’s invasion of Ukraine that has shaken up global uncertainty, driving investors back into the safety of U.S. holdings. Although, they haven’t been off to a particularly strong start to 2022 either.
We also know historically that U.S. investments aren’t always the best performing. There are times when international positions do outperform, and adding that further diversification could be helpful to investors. The U.S. markets have been outperforming for pushing over 11 years now. Looking back, this is quite an extended period of time if we look at a chart going back to 1975 provided by Hartford Funds.
The Basics
- 1-Year Z-score: -1.70
- Discount: -11.18%
- Distribution Yield: 6.80%
- Expense Ratio: 1.07%
- Leverage: N/A
- Managed Assets: $812.5 million
- Structure: Perpetual
BOE has an investment objective to “provide current income and current gains, with a secondary objective of long-term capital appreciation.”
They intend to achieve this through “investing in at least 80% of its net assets in dividend-paying equity securities and at least 40% of its assets outside of the U.S. The Fund may invest in securities of companies of any market capitalization but intends to invest primarily in securities of large-capitalization companies. The Fund generally intends to write covered put and call options with respect to approximately 30% to 45% of its total assets. However, the percentage may vary from time to time with market conditions.”
They focus on writing options on individual stocks in their portfolio. The fund last reported that the portfolio was 43.6% overwritten at the end of February. That is above their 30 to 40% target.
The fund’s expense ratio is on the lower end for a closed-end fund, as is often the case with most BlackRock funds. Given the size of the fund, it generally provides plenty of liquidity for most investors. The average daily volume is around 190k shares traded.
Performance – Attractive Discount
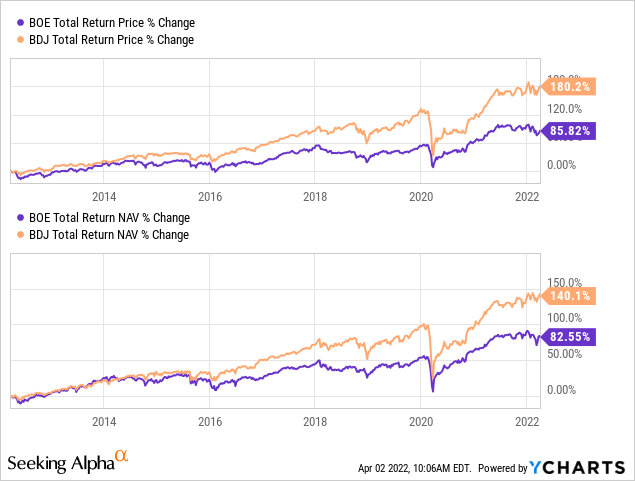
As I mentioned at the opening of this article, BOE has underperformed BDJ over the years due to the tilt towards global positions. Below is the total return performance for comparing the two over the last ten years.
Ycharts
I think this is important to point out because it helps provide greater context for international vs. U.S. investments and how they have compared over the years. These are more comparable funds to each other than they would be to ETFs because they both take a similar options approach.
Given the significant underperformance, it is certainly understandable that an investor would be hesitant to want to invest in BOE. I do own both myself but overweight BDJ at the moment, to be completely transparent. Going forward, I do plan to add to my BOE position to increase my allocation there. I believe the latest discount presents a solid opportunity to do just that.
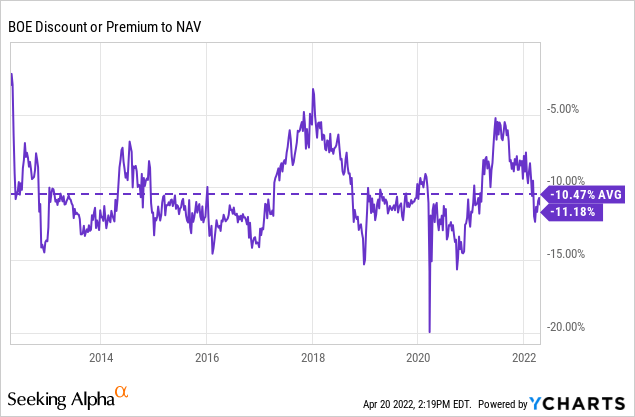
If we look over the last ten years, we can see that the fund’s discount is a bit deeper than its average. There have been occasions where BOE has touched a 15% discount. However, those were brief. In 2020, they even touched a ~20% discount at the absolute bottom.
The fund’s discount is wider than over the last year in more recent history. That is what has pushed the fund to a negative 1.70 1-year z-score.
Distribution – Monthly Income
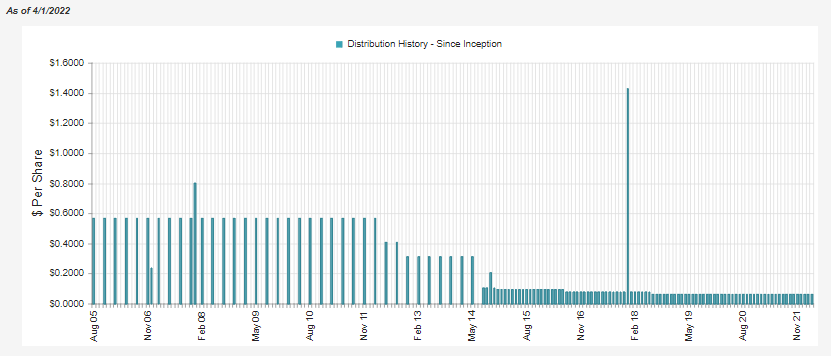
BOE transitioned to monthly distributions for shareholders around 2014. Prior to this, the fund paid quarterly distributions. What might be more interesting is how they had held their distribution steady throughout 2008/09. It wasn’t until several years after that they began to cut the payout. They have maintained the same monthly amount going back to mid-2018.
The one thing I’ve highlighted in the past is that in 2018 when they cut, it was preceded by a massive year-end special in the prior year. It was around $1.42, which took a significant chunk of assets out of the fund that would have been generating potential returns for the distributions. That’s another reason why I believe they cut in 2018.
BOE Distribution History (CEFConnect)
The trajectory of their distributions with cuts over the years comes with the nature of being invested in global securities. That’s where it is once again evident that they have underperformed their U.S. counterpart BDJ. That fund hasn’t cut its distribution since 2012. Though they had a series of cuts through 2008/09 and the following years. Since then, they have boosted their distributions twice.
Given the distribution yield of 6.80%, this is fairly attractive. On a NAV basis, it works out to 6.04%. To me, this would appear to be a sustainable and reasonable level. So at this time, I don’t see another cut being necessary at this time.
BOE Annual Report (BlackRock)
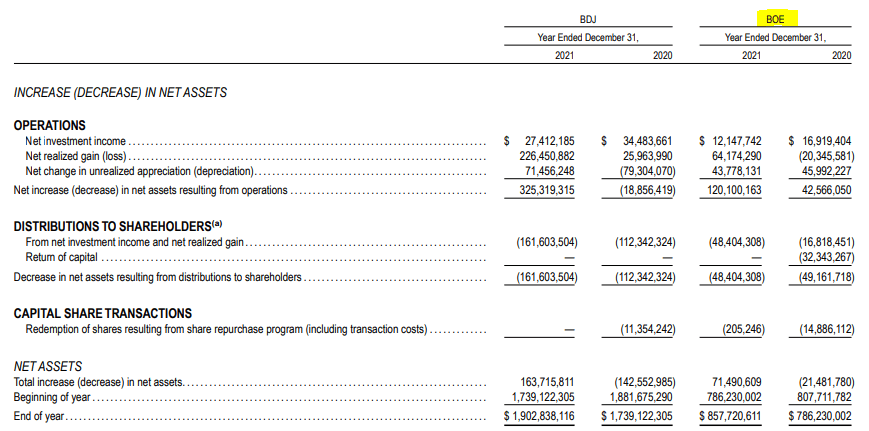
Over 2021, BOE easily covered what it paid out to investors via income and realized gains. In 2020, the coverage was lacking, and some destructive return of capital was utilized. There just weren’t quite enough unrealized gains to offset the realized losses. Over the last fiscal year, we also see that BOE’s net investment income had slipped from the prior year a bit. This happens as they are actively managed funds that constantly move their portfolio around. BDJ saw a similar reduction year-over-year.
In 2021, we saw quite an interesting breakdown of the characterization for tax purposes. That’s why it is always important to check every year, as it can change so drastically.
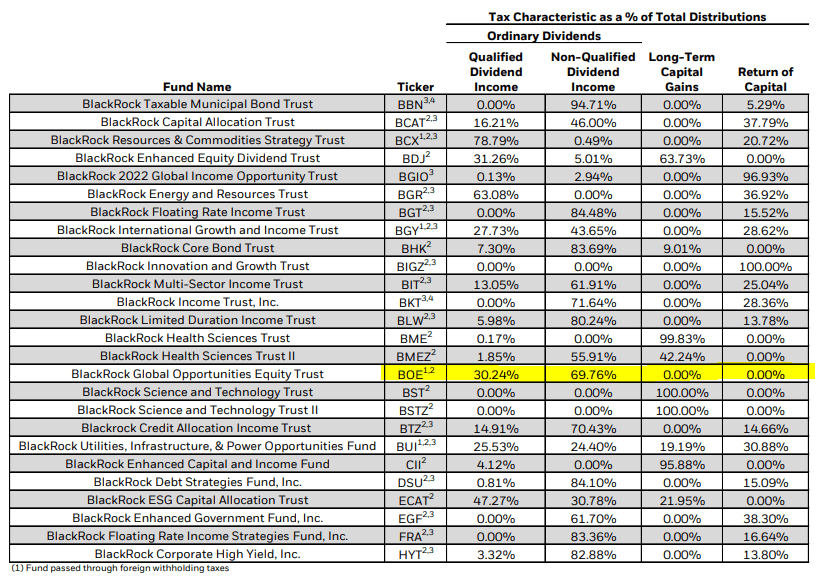
BOE Tax Breakdown (BlackRock)
The fund actually had quite a significant amount of non-qualified dividend income. This could be from dividends that were identified as ordinary income or from short-term capital gains. Either way, this wasn’t the best if you held the fund in a taxable account.
However, if you had looked at the fund in 2020, it could have been seen as a very tax-friendly position. It was entirely qualified dividends or return of capital, both types of classifications that can have benefits for investors in a taxable account.
BOE’s Portfolio
BOE’s turnover rate has been elevated over the last two years. In 2021, it was reported at 65%. For 2020, it was reported at 61%. This was above the 26% and 28% in both 2019 and 2018. Perhaps the greater volatility due to COVID made them want to shift their portfolio more aggressively. That could explain why the non-qualified dividends could be coming from a portion of short-term capital gains instead of ordinary income.
As a global fund, I think one of the more important things is to see just how global they might be. The majority of CEFs with a global focus still hold their largest weighting in U.S. investments. For BOE, it is the same, but it is nearly 50/50. Compared to other global funds I’ve covered, this is actually quite a hefty weighting outside the U.S.
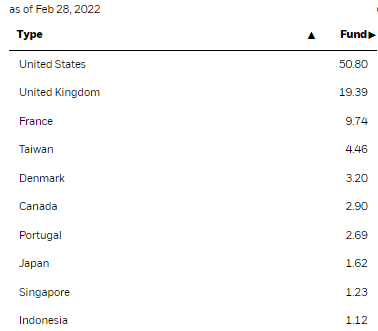
BOE Country Weighting (BlackRock)
The remainder of the portfolio is heavily in European and Asian countries after that U.S. weighting. From our previous focus article on BOE around a year ago, this hasn’t been a massive change. Though U.S. exposure has come down from the 55.96% allocation, it was at the end of February 2021.
Taking a look at the sector exposure, we see that tech is the largest allocation. This is also a change from BDJ. It also isn’t overwhelmingly in a tech allocation that we can see from some other funds. That is another way that BOE could represent more diversification for a shareholder.
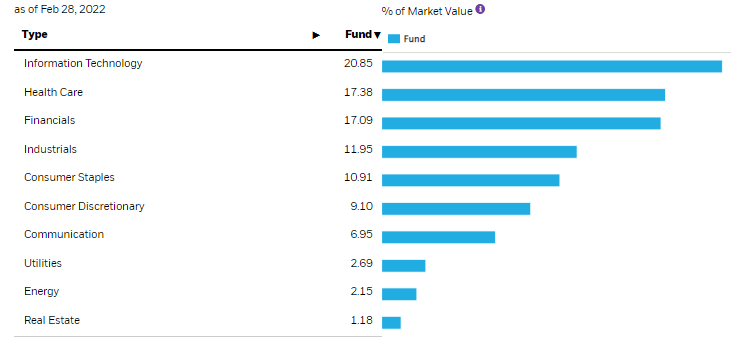
BOE Sector Weighting (BlackRock)
These weightings are pretty similar to a year ago as well.
Finally, looking at the top ten shows us a list of names we don’t see elsewhere – at least not regularly. That is, besides the largest holding going to Microsoft (MSFT). MSFT we see in just about any CEF that takes a diversified approach.
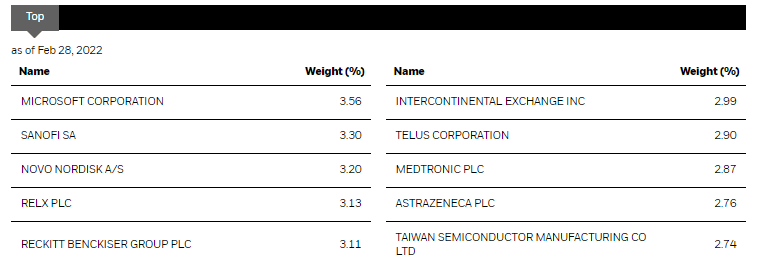
BOE Top Ten (BlackRock)
There have also been quite a few changes from a year ago. MSFT position was the largest still. However, Visa (V), Texas Instruments (TXN), Bristol-Myers Squibb (BMY) and Comcast (CMCSA) were all in the top holdings previously. These are well-known U.S.-based companies. These have been replaced with Reckitt Benckiser Group (OTCPK:RBGPF) (this one trades on the pink sheets,) Medtronic (MDT), AstraZeneca (AZN) and Tawan Semiconductor Manufacturing (TSM) as companies located outside the U.S. This can explain some of the weighting shifts in country exposure we saw above.
These are also great examples of stocks that I don’t own elsewhere – in my CEF portfolio or individual stock portfolios. They aren’t names that I would even necessarily run across to think about investing in either. So in that way, BOE represents a fairly interesting piece of my portfolio for diversification.
Conclusion
BOE is a fund with a tilt towards international investments. Over the last year, they have shifted a bit to include even more international names. This has been a diversifier in my portfolio since I bought it a couple of years ago. I suspect that international positions will outperform U.S.-based investments at some point. BOE is one fund that can help take advantage of that should that begin to take place. Given the global uncertainty at this time, I believe 2022 could be another year of lagging international performance. At some point, though, it would seem this will reverse; they certainly remain cheap relative to U.S. investments, though.
Be the first to comment