

golubovy
Introduction
This will be an article where I discuss a number of topics that I don’t often get to write about regarding borderline stocks. Borderline stocks are stocks whose metrics are right at the edge of being good enough to take a chance owning, and whether one decides to do so or not is mostly based on a judgment call which is sometimes influenced by one’s overall disposition on these types of stocks.
In this article, I will review my last coverage of The Bank of New York Mellon Corporation (NYSE:BK) stock, then I will perform my normal valuation analysis of BK using 2023’s forward estimates. After that, I will discuss several important additional factors I examine in cases like this one, including the revenue trend, stock buybacks, acceptable minimum earnings growth, and capital allocation preferences.
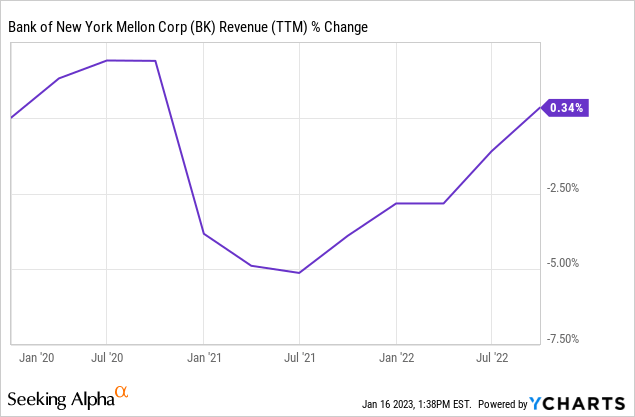
I last wrote about BK last quarter on October 21st, 2022, in my article “Bank of New York Mellon Stock Looks Like A Buy Post Earnings, But It Isn’t.” In that article, I rated BK a “Hold” even though it appeared on the surface as though it might be a more attractive value. Here is how the stock has performed since then.
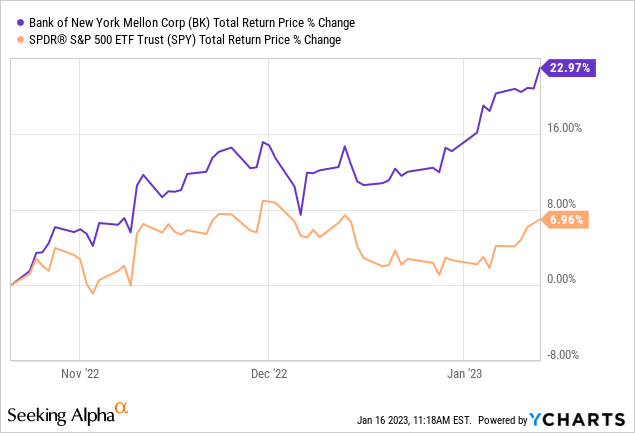
The stock has actually performed very well over the past quarter, even though adjusted operating earnings came in lower than expected for the year. The market seems to be looking forward to next year, which I will get into later in the article. But before we get into that, let’s run through a new basic valuation using 2023’s expected earnings, which analysts think will be much improved over this year.
My Basic Valuation Method For Bank of New York Mellon
The valuation method I use for BK first checks to see how cyclical earnings have been historically. Once it is determined that earnings aren’t too cyclical, then I use a combination of earnings, earnings growth, and P/E mean reversion to estimate future returns based on previous earnings growth and sentiment patterns. I take those expectations and apply them 10 years into the future, and then convert the results into an expected CAGR percentage. If the expected return is really good, I will buy the stock, and if it’s really low, I will often sell the stock. In this article, I will take readers through each step of this process.
Importantly, once it is established that a business has a long history of relatively stable and predictable earnings growth, it doesn’t really matter to me what the business does. If it consistently makes more money over the course of each economic cycle, that’s what I care about – numbers over stories.
FAST Graphs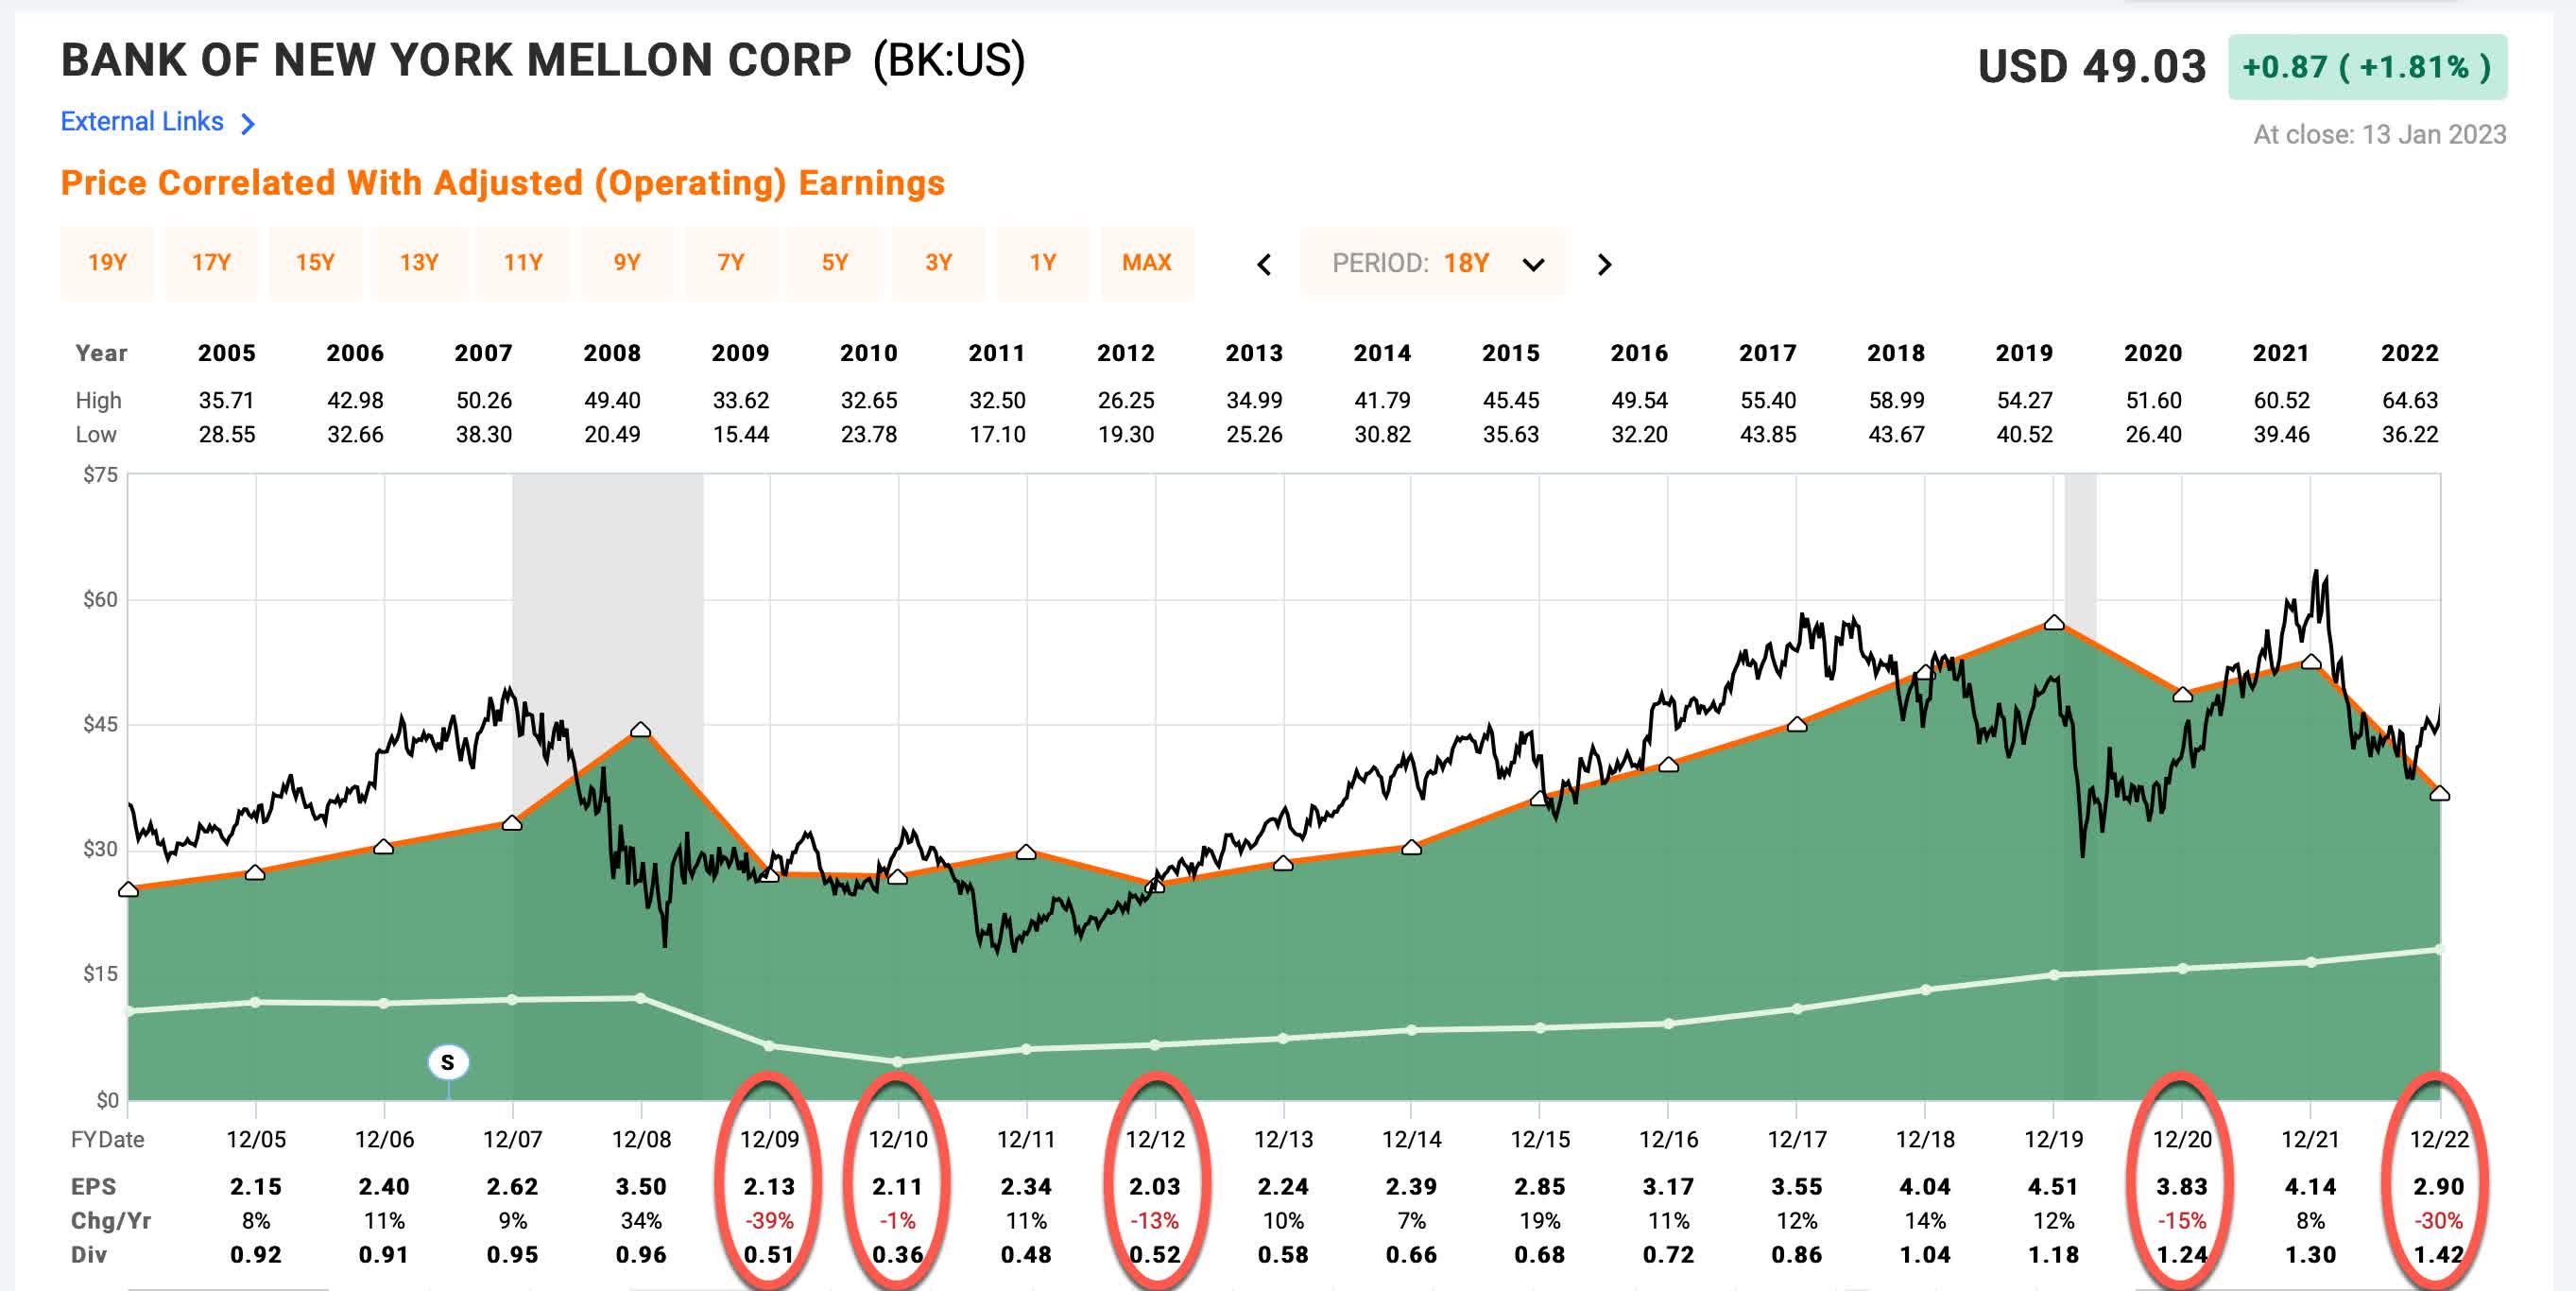
Since 2005, The Bank of New York Mellon Corporation has experienced 5 years in which EPS was lower than the previous year. The worst two years were 2008 and 2009, in which EPS declined about -40% from 2007 levels. However, adjusted operating earnings growth for 2022 fell -30%, which is a significant decline as well.
My general rule of thumb when I classify a stock based on historical earnings cyclicality is if EPS has a history of falling more than -50% during past downcycles, then I treat that business as deeply cyclical and I use a different type of analysis for it rather than an earnings-based analysis. I would describe BK’s earnings history as a moderate-to-deep cyclical business in which EPS can be expected to fall -30% to -40%, give or take, during a down cycle. It’s okay to use an earnings-based analysis on stocks like this as long as the earnings growth declines they have experienced are taken into account. I emphasize this because when I perform an earnings analysis, I view the earnings from the point of view of being collected by the owner of the business. If we know EPS from point A to point B in time has not increased in a straight line each year, but instead has fluctuated, then it makes sense to me to account for the years in which EPS was below the average trend line, which is what I do when I estimate earnings growth.
Because of this, and because I also control for stock buybacks (again, because I am assuming the owner of the business keeps that money rather than buys back stock with it), my earnings growth estimates for stocks like this are almost always lower than a point-to-point measurement which has been converted to an average growth rate regardless of cyclicality between the points. This is especially important for companies that have significant earnings cyclicality and that also buy back a lot of stock.
Market Sentiment Return Expectations
In order to estimate what sort of returns we might expect for The Bank of New York Mellon Corporation over the next 10 years, let’s begin by examining what return we could expect 10 years from now if the P/E multiple were to revert to its mean from the previous economic cycle. For this, I’m using a period that runs from 2016-2023.
FAST Graphs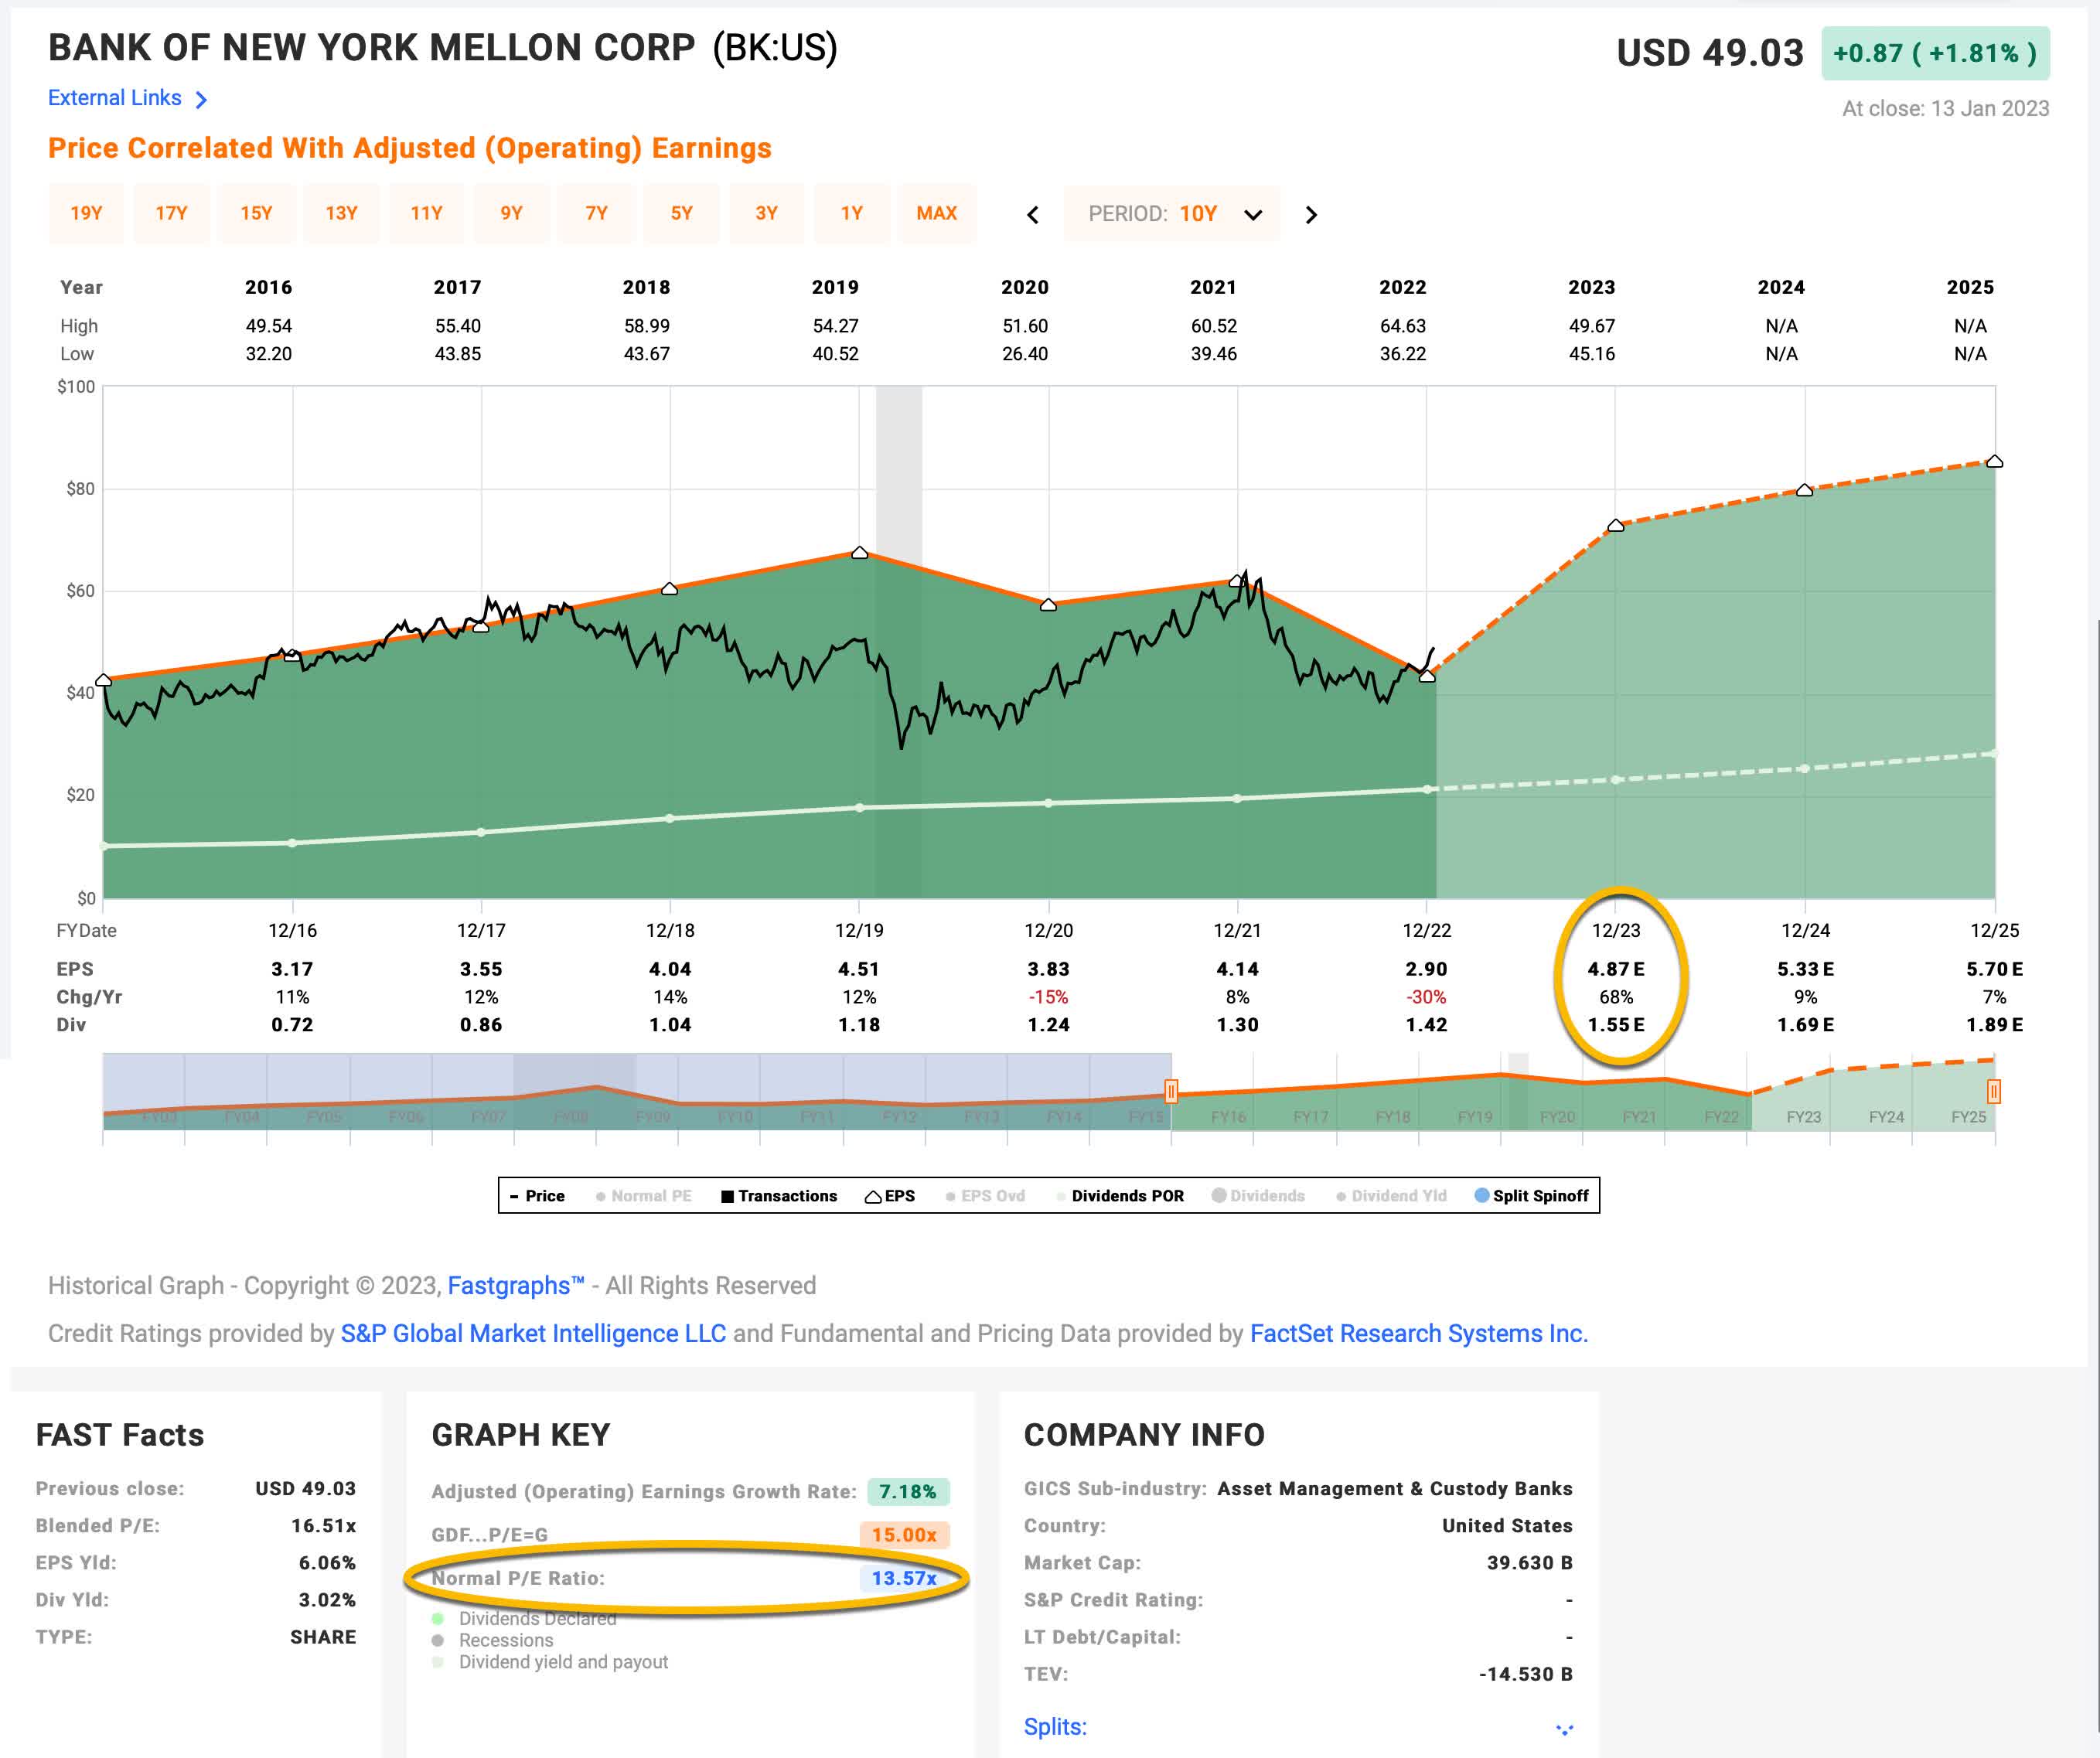
BK’s average P/E from 2016 to the present has been about 13.57 (the blue number circled in gold near the bottom of the FAST Graph). Using 2023’s forward earnings estimates of $4.87 per share, BK has a current P/E of 10.07. If that 10.07 P/E were to revert to the average P/E of 13.57 over the course of the next 10 years and everything else was held the same, BK’s price would rise and it would produce a 10-Year CAGR of +3.03%. That’s the annual return we can expect from sentiment mean reversion if it takes 10 years to revert. If it takes less time to revert, the annual return would be higher.
Business Earnings Expectations
We previously examined what would happen if market sentiment reverted to the mean. This is entirely determined by the mood of the market and is quite often disconnected, or only loosely connected, to the performance of the actual business. In this section, we will examine the actual earnings of the business. The goal here is simple: We want to know how much money we would earn (expressed in the form of a CAGR %) over the course of 10 years if we bought the business at today’s prices and kept all of the earnings for ourselves.
There are two main components of this: the first is the earnings yield, and the second is the rate at which the earnings can be expected to grow. Let’s start with the earnings yield (which is an inverted P/E ratio, so the Earnings/Price ratio). The current earnings yield is about +9.93%. The way I like to think about this is, if I bought the company’s whole business right now for $100, I would earn $9.93 per year on my investment if earnings remained the same for the next 10 years.
The next step is to estimate the company’s earnings growth during this time period. I do that by figuring out at what rate earnings grew during the last cycle and applying that rate to the next 10 years. This involves calculating the historical EPS growth rate, taking into account each year’s EPS growth or decline, and then backing out any share buybacks that occurred over that time period (because reducing shares will increase the EPS due to fewer shares).
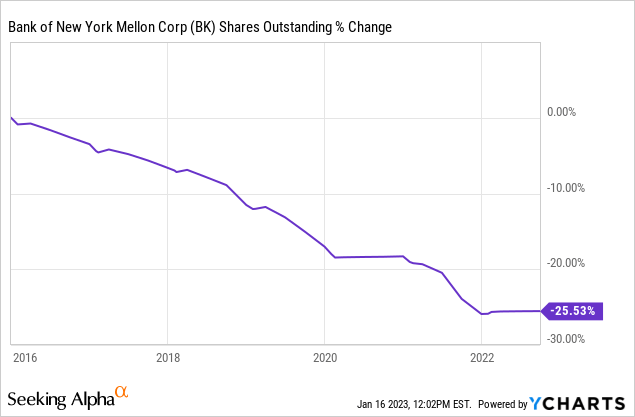
BK has bought back about 1/4th of the company since 2016. I will control for these buybacks and also account for the negative earnings growth years in 2020 and 2022. However, I will also assume analysts are correct about the +68% earnings growth next year as well. After I do that, I get an earnings growth estimate of +3.23% over this time period. (More on this low growth rate later.)
Next, I’ll apply that growth rate to current earnings, looking forward 10 years in order to get a final 10-year CAGR estimate. The way I think about this is, if I bought BK’s whole business for $100, it would pay me back $9.93 plus +3.23% growth the first year, and that amount would grow at +3.23% per year for 10 years after that. I want to know how much money I would have in total at the end of 10 years on my $100 investment, which I calculate to be about $218.80 including the original $100. When I plug that growth into a CAGR calculator, that translates to a +8.14% 10-year CAGR estimate for the expected business earnings returns.
10-Year, Full-Cycle CAGR Estimate
Potential future returns can come from two main places: market sentiment returns or business earnings returns. If we assume that market sentiment reverts to the mean from the last cycle over the next 10 years for BK, it will produce a +3.03% CAGR. If the earnings yield and growth are similar to the last cycle, the company should produce somewhere around a +8.14% 10-year CAGR. If we put the two together, we get an expected 10-year, full-cycle CAGR of +11.17% at today’s price.
My Buy/Sell/Hold range for this category of stocks is: above a 12% CAGR is a Buy, below a 4% expected CAGR is a Sell, and in between 4% and 12% is a Hold. An +11.17% 10-Year CAGR is a little below 12%, so that makes BK stock a “Hold” at today’s price, but fairly close to being a “Buy” using the basic valuation approach. Using this approach, BK would become a “Buy” below about $46.60, assuming earnings expectations remain as high as they are today for 2023.
Additional Considerations
In this section, I’m going to share why I consider BK a borderline stock, and why I have decided not to buy it. A lot of this will have to do with my personal investing preferences. So, from a neutral perspective, I think an investor could go either way with this stock, but because of several of my investing preferences, I will not be a buyer even if it falls below my standard “buy price.”
Let’s start with the revenue trend, which is why I decided to sell the stock back in September of 2020 after buying it just as the March 2020 decline began. My absolute favorite metric to use for identifying businesses that have either reached the end of their growth phase, or are actively being disrupted, or who are simply facing rising competition, is the 3-year revenue trend. This is a point-to-point measurement of revenue from three years ago through today. If this turns negative and we are aren’t in a deep and extended recession, that is almost always an automatic “sell” trigger for me.
This trend is essentially flat. It’s slightly better if we include the most recent quarter, which I’m calculating as a +1.19% CAGR for revenue over 3 years, or roughly 4% cumulatively. When I have a stock with revenue growth this slow, I watch it very carefully, and usually when I buy a stock I want this number to be at least double digits (which would be above the long-term average annual inflation rate of 3%). The most important thing to understand is that generally speaking this should be treated as a “no growth business.” And being a “no growth” businesses is okay. There is nothing wrong with a business that is only growing earnings and revenues around the rate of inflation. But what is important for investors is to not pay too much for these businesses.
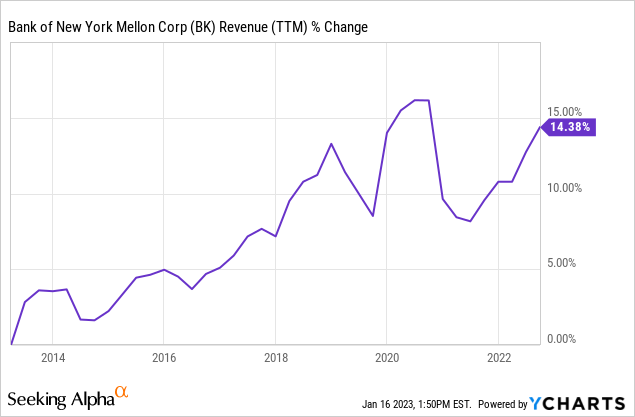
Sometimes it’s useful to zoom out as well and take a look from a longer perspective, and here we see essentially the exact same thing with revenues we saw over the shorter-term. This is a 10-year period where revenues grew at a +1.39% CAGR. This is consistent with a no-growth business.
FAST Graphs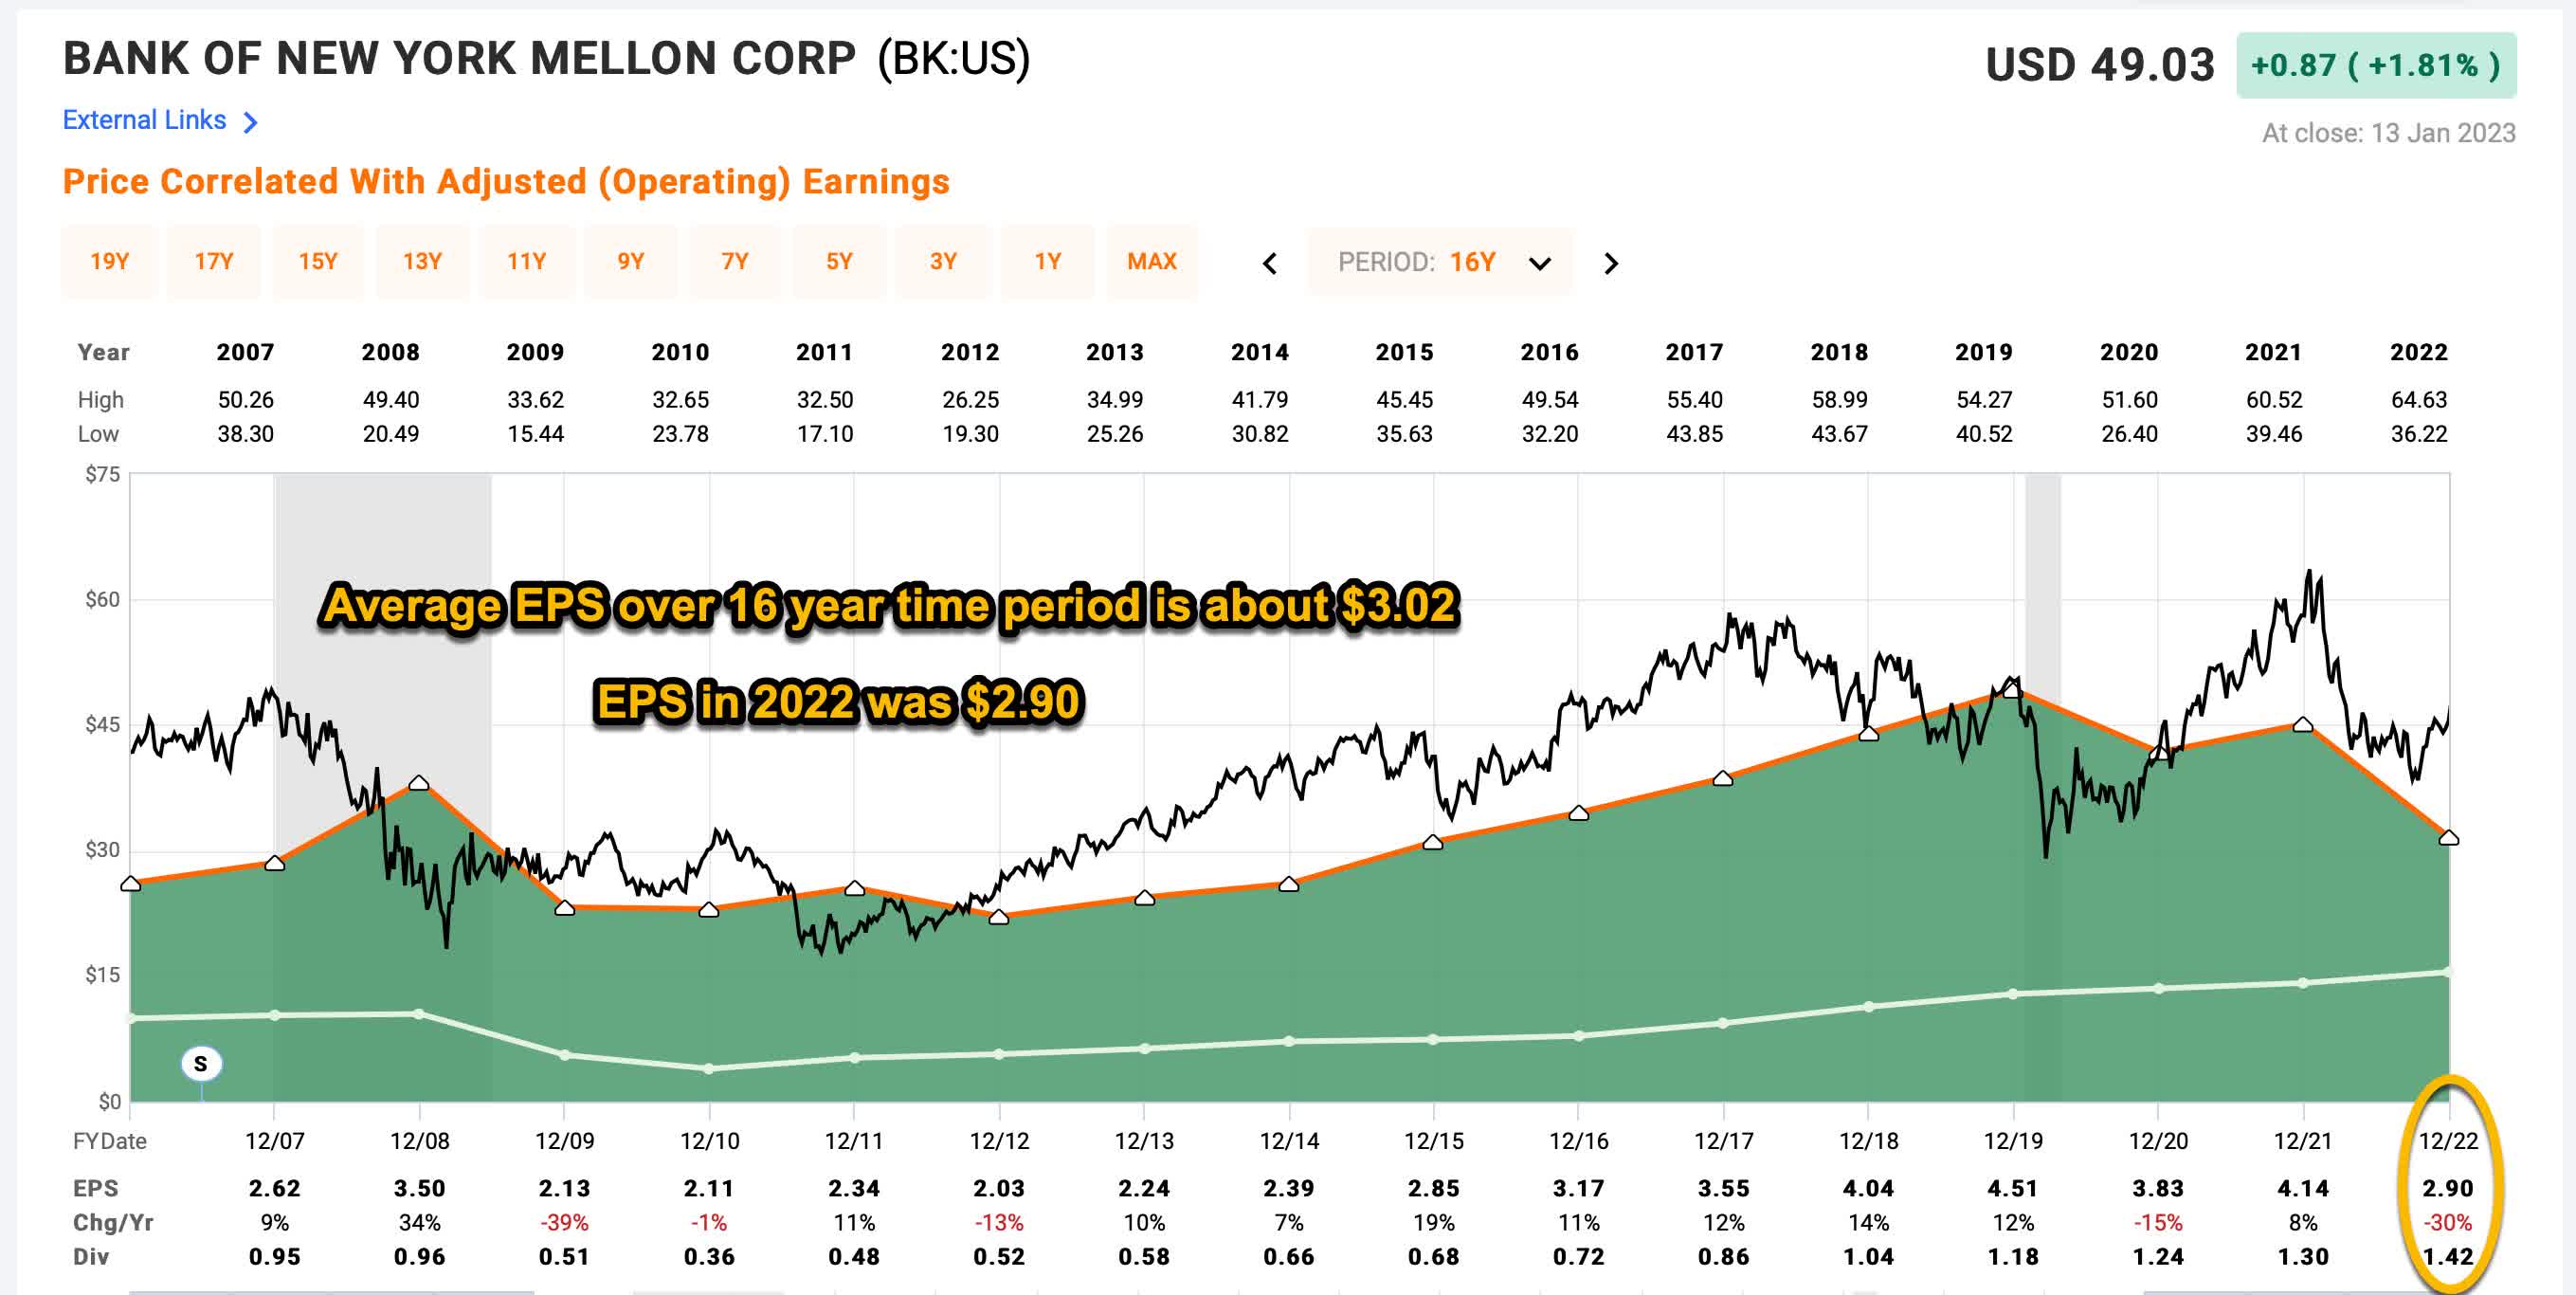
Going all the way to 2007 BK’s average EPS has been about $3.02 per share and this year they earned $2.90. To make matters worse, these EPS numbers are dramatically inflated due to share buybacks, which reduce the “S” in the EPS in order to make the “E” look better (which is why revenues are important to look at as well in cases like this because they are not a “per share” metric).
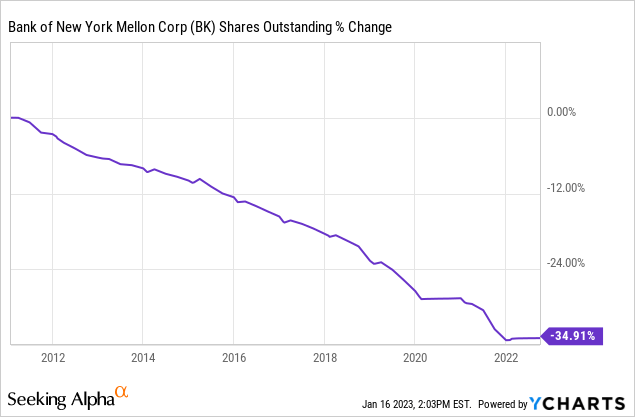
Since 2011 when they started aggressively buying back shares, they have bought back a full 1/3rd of the business.
Next, I want to give the explanation for the poor earnings (and earnings per share) growth over this time period. Management, as well as some shareholders who commented on my previous article, pointed out that much of the recent operating earnings performance was the result of “one time” charges that don’t really reflect the underlying strength of the business, and that if we took those out then earnings would be much better. Management went out of their way to point out they would have had something like 8% growth if we exclude these charges and expenses.
I have a couple counters to this. The first is simply to look at the long-term revenue growth which I think tells the most truth in this situation, and I already showed how slow that was. The second, is that while I did count these weak earnings years against BK’s earnings growth in my analysis, I also assumed earnings would grow +68% next year, assuming they don’t have any new issues and analysts are close to being correct about earnings, and I used those earnings as a base going forward. So I’m giving BK the benefit of the doubt going forward. BK’s valuation looked pretty good after doing so, so I wanted to be a fair as possible with my basic analysis.
But I think this next point, which was brought up in the conference call post-earnings by Mike Mayo, really got to the heart of the matter.
Mike Mayo
Robin, I think you inherited a tough hand here. So I mean BNY Mellon historically has had periods when they do a better job controlling expenses, but that typically coincides with periods of slower top line growth, but you’re starting off here, fees were down 3% last year. Looks like your guide for NII implies that’s flat with the fourth quarter. So it’s not so much — okay, revenues are slow, you can control expenses so much, they’ve already slow or they’re about to. So it just seems like your efficiency savings are going to be tougher. And as part of that, this predates you, Robin, but when it comes to notable items or onetime items, you had some this quarter. But if you look over a decade, your notable items add up to $3.5 billion, that’s almost a year’s worth of earnings. So the real question here is how can you improve your profit margin and your efficiency ratio and squeeze more out of BNY Mellon when the revenue environment has been tough and you have inflationary pressures. So I guess how confident are you to turn this around in terms of the positive operating leverage on a core basis?
Notable items over a decade have added up to almost a year’s worth of earnings. Now, as investors we can choose to be “glass half full” or “glass half empty” and I fully admit I’m being “glass half empty” here. As Mike pointed out, the history isn’t the current management’s fault. But as an investor, I start with a baseline assumption that history is a good guide for the future. So, I take a long time period and look at the pattern and assume it will be similar in the future. If BK doesn’t have many notable items going forward, then their earnings trend will definitely improve, but how much can it improve when top-line revenue growth is essentially flat? I think a person really needs to believe in a type of turnaround operationally for this sort of bottom-line improvement to stick.
Buybacks Versus Dividends
Okay, now we are really going to get into an area of personal preference for me, where I know there are many very good and rational investors who have a different preference in this situation. I have noted earlier that there is nothing “wrong” with a no-growth business that grows revenues and earnings at just the rate of inflation long-term. That’s fine. But when that happens, I have two requirements that need to be met before I will continue to hold (or maybe even sometimes buy) a stock like this. The first is that if the business is no-growth, then I want nearly all earnings to be returned to shareholders. BK actually meets this requirement.
The quick way I check this is to take the 3-year average buyback yield, and the dividend yield, and then see what proportion of the earnings yield that is. A business with BK’s profile I would want to see this shareholder return at about 90% or above. Right now, that’s at about 74%, but that assumes they will meet analysts’ lofty earnings expectations next year. (Interestingly, sometimes when you have a business committing to returning all the extra money to shareholders you can use the shareholder yield to estimate where management’s earnings estimates really are. That 90% threshold would be met if they earned around $4.00 per share and paid out a $1.55 dividend but they will probably base the buyback amount on where earnings actually come in, so this is just an estimate.)
At any rate, historically they have actually returned nearly all of their earnings to shareholders in the form of dividends and buybacks. The reason I’m getting into this is because I have a strong preference in no-growth situations of getting nearly all this back in the form of dividends (and I normally don’t care about dividends at all).
The reason I prefer dividends in this situation is two-fold. The first is that I don’t think businesses who aren’t growing should be buying back their own shares. The businesses aren’t growing much. Why would they think buying the shares of a stagnant business is a good idea? The truth is all buybacks in this situation do is prop up earnings per share data so it looks like the company is growing when it isn’t. So, even though I am aware of the math on buybacks, and the tax disadvantages of dividends, dividends make more sense to me as form of insurance. The reason for that is because no-growth businesses quite often become shrinking businesses, and if that happens then all of those buybacks the company made over the years were in a shrinking business that they usually way overpaid for. As an investor, receiving a dividend means that near the end of a company’s growth phase you get your money back so that you can spend it or invest it in a business that potentially has more growth.
Here is an example. I don’t own many no-growth businesses, but Altria Group (MO) is pretty close to own. I bought it on a dip on 1/25/19. At the time, the dividend yield was about 7%, and I figured even if Altria slowly died I would earn my principal back in a reasonable amount of time via the dividend, and if I got lucky, maybe they could find a new growth stream or the market would decide they liked the stock and would drive up the valuation and I could take profits that way. Here are the returns.
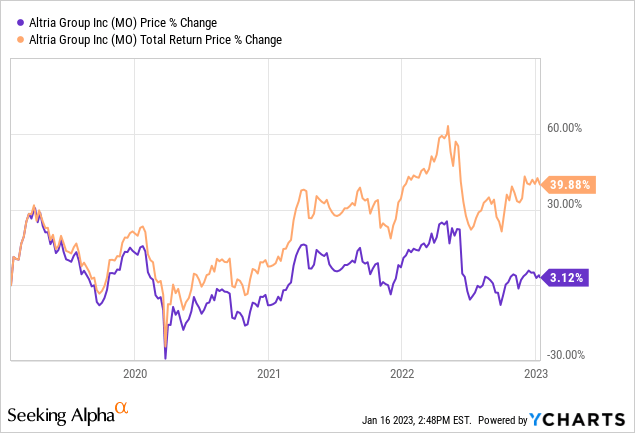
As it turned out, a lot of stuff went wrong for Altria, including a disastrous investment in JUUL. Over the course of 4 years the stock price is flat, but I collected about 40% of my investment back via the dividend. In the end, this is likely a no-growth business, but because it was cheap enough, and had a good dividend yield, the risk of the business slowly dying was mitigated.
What this all means is that for decent quality but no-growth or slow-growth businesses, I usually will not buy them without a dividend yield in the 7% to 8% range because of the danger “no-growth” turns to “negative growth” sooner rather than later. Buybacks do not help in this situation.
BK currently yields about 3%, so if they eliminated the buybacks and used that money for dividends, and the stock price dropped about 25% or so, it would be an interesting no-growth investment, but not until then.
Conclusion
In the end, I think there are certain investors that might be willing to take a chance on a consistent turnaround at Bank of New York Mellon. If The Bank of New York Mellon Corporation were to have a consistent catalyst of sustained growth going forward, the stock would be a good investment here and those buybacks they’ve made the past decade would pay off. I’m just generally more pessimistic when it comes to breaking historical patterns. My experience has been about 80% of the time it doesn’t happen in a timely manner. But, that means 20% of the time it does.
I monitor a very wide range of stocks, numbering in the hundreds. So, I don’t have the time to do the deep work it takes to determine if The Bank of New York Mellon Corporation is likely to be in that 20% category. For that reason, I usually avoid these situations and look for easier opportunities elsewhere for good mediums term returns.
Be the first to comment