


PM Images/DigitalVision via Getty Images
Written by Nick Ackerman, co-produced by Stanford Chemist. This article was originally published to members of the CEF/ETF Income Laboratory on June 11th, 2022.
BlackRock Enhanced Capital and Income Fund (NYSE:CII) has been maneuvering through the challenging 2022 environment relatively well. As an equity fund that leans towards heavier exposure to tech, it is still down but has been beating the major indexes.
The fund’s strategy to write covered calls on individual positions in the portfolio seems to be helping make it hold up better. Often in markets that are in bull market mode, it can result in losses for their options strategy. In 2021, it contributed to a loss of over $27.217 million for the fund. At the time, the fund had nearly a billion dollars in assets, so not a massive loss but a loss regardless. Additionally, the fund isn’t as heavy in tech as the S&P 500 Index.
Here’s how the fund’s total returns on a YTD basis stack up against the SPDR S&P 500 ETF (SPY) and the Invesco QQQ (QQQ).
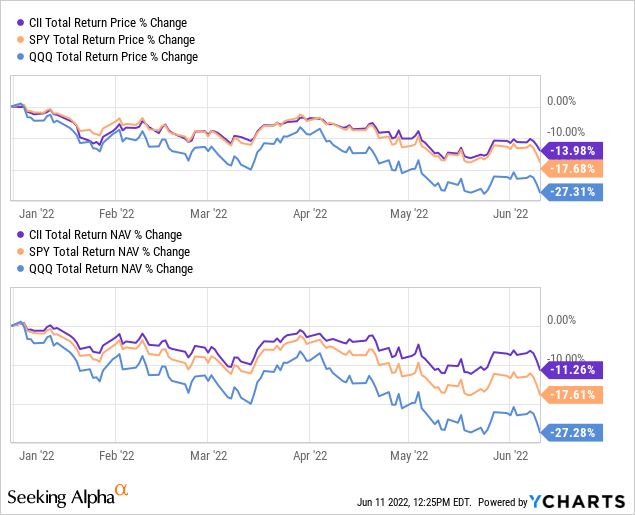
YCharts
As we can see, the fund’s total NAV returns have been holding up better than its total share price returns. That has pushed the fund to trade at a discount to its NAV. That’s generally exactly what we look for when picking up CEFs.
Given the distribution yield and that the fund is holding up relatively well, it doesn’t seem that the distribution would be at risk at this time. This can be an important consideration in the current environment as other funds are facing elevated yields, pushing them to unsustainable levels.
The Basics
- 1-Year Z-score: -0.47
- Discount: 3.03%
- Distribution Yield: 6.43%
- Expense Ratio: 0.9%
- Leverage: N/A
- Managed Assets: $844.8 million
- Structure: Perpetual
CII has a simple objective and strategy; it “seeks to provide investors with a combination of current income and capital appreciation” by “investing in a portfolio of equity securities of the U.S. and foreign issuers.” They will also “employ a strategy of writing call and put options.”
This type of flexibility allows them to really invest wherever they’d like. However, the portfolio tends to overweight the large and mega-cap tech names. That is pretty standard for most straightforward equity funds. However, CII will also write calls on the underlying positions.
They target an overwrite of 30-40%. However, they reported that 47.12% of the portfolio was overwritten. This could generally be seen as the managers being a bit more bearish. If they are overwriting a more significant portfolio allocation, that could indicate that they don’t suspect these positions to be called away. They had an elevated overwritten percentage throughout last year too. Generally speaking, that wouldn’t have been ideal for the previous year, but it should be a positive for this year.
Performance – Discounted, But Not A Screaming Buy Discount
As we showed above, the fund has been holding up better relative to the broader market on a YTD basis. Over the longer term, the covered call strategy would detract from performance relative to its benchmark. They actually list the Russell 1000 Index and MSCI USA Call Overwrite Index as their benchmarks.
I’ll include the iShares Russell 1000 ETF (IWB) for a longer-term performance gauge relative to its benchmark. Keep in mind that IWB does not use a covered call strategy that can often lead to reduced performance during times of very bullish markets. I’ll also include SPY once again to provide some context, but it isn’t necessarily an appropriate benchmark.
Over the last decade, we have basically seen what we would expect. On another note, it’s interesting that SPY and IWB have performed so closely.
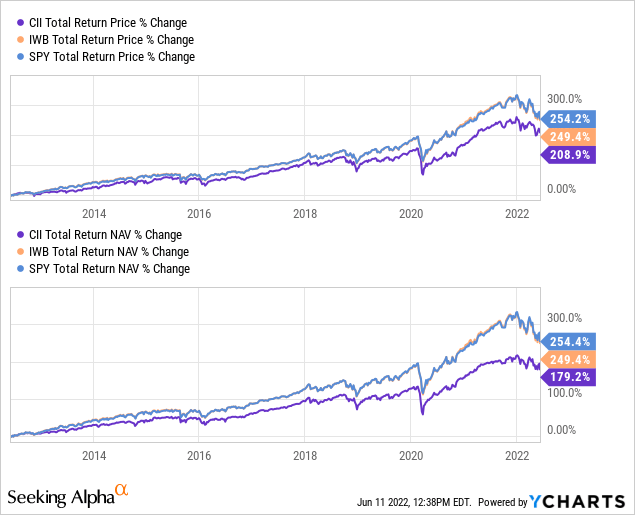
YCharts
At the same time, CII’s discount hasn’t expanded drastically from where it was. Though the overall market has declined, which could add to its appeal too, it just isn’t as discounted as where it has generally fallen historically.
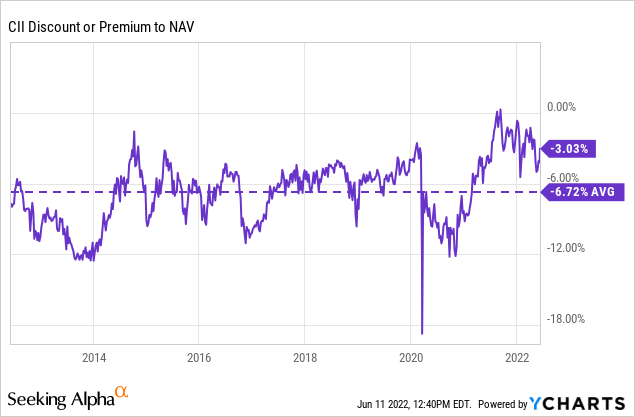
YCharts
For that reason, I believe that CII can be attractive at this time. It certainly isn’t a screaming buy by any means, though. Should we fall into an 8%+ discount range, we would consider there to be a greater margin of safety to picking shares up. At current levels, discount expansion could play a role going forward.
Distribution – Attractive And Reasonable
The fund has been upping its distribution thanks to the strong returns in the last few years. However, it did cut three times previously. They did so in 2011 and 2012. Then another cut happened in 2016. For the most part, it has been an otherwise fairly stable payout from CII.
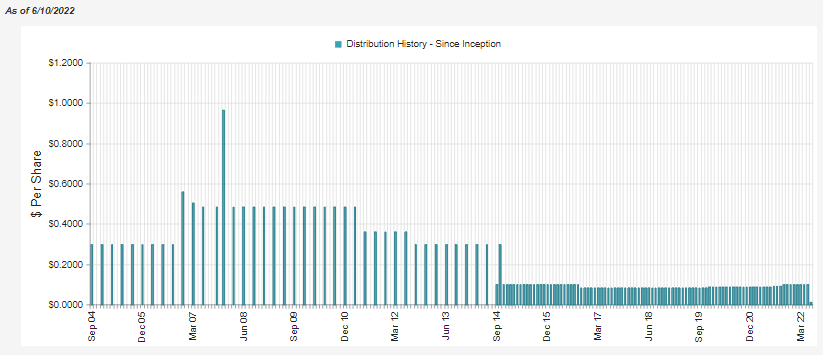
CII Distribution History (CEFConnect)
The current distribution yield comes to 6.43%, and the NAV rate is similar due to the limited discount at this time at 6.24%. I believe that this is a sustainable and reasonable level currently, despite the weakness in the broader markets.
The covered calls should be generating some gains for the fund this year. One of the reasons covered call funds generate losses is when they close a position out early. This can happen when a stock runs higher, and the managers want to hold onto the position rather than have it called away. Therefore, closing a position can cost them more than they collected in premium, generating a realized loss.
In 2021, we see that this contributed to some of the losses realized on the fund. Yet, the realized gains from the investments were more than enough to offset these losses and see the fund produce realized gains of $70.684 million.
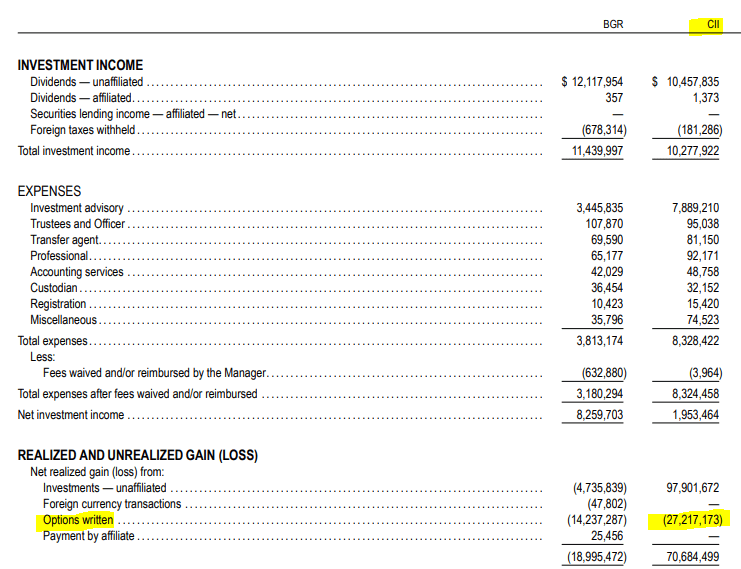
CII Annual Report (BlackRock (highlights from author))
In a couple of months, when the new Semi-Annual Report is posted for the first half of the year, we will get a better idea of what’s going on under the hood. For now, we can only take a guess of what is making the fund hold up better at this time.
At the same time, the fund generated very little net investment income from the portfolio. Relatively speaking, it was actually quite the drastic reduction from the year prior. Since capital gains drive the bulk of the earnings for the fund, it isn’t seen as too meaningful. Higher NII certainly wouldn’t hurt, though.
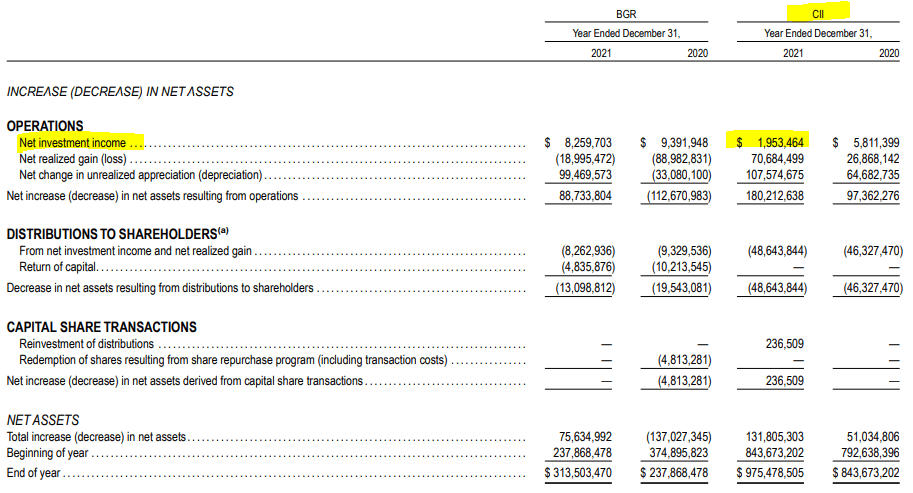
CII Annual Report (BlackRock (highlights from author))
The tax character of the distributions is about where we would expect, too. That isn’t always the case, so it’s best to watch this if you are a tax-sensitive investor. Here are the numbers for the last two years.

CII Annual Report (BlackRock)
CII’s Portfolio
In general, CII isn’t an overly active portfolio. Their last Fact Sheet notes that they had a total of 53 positions, so the portfolio could be considered rather narrowly focused. It isn’t too uncommon to see CEFs carrying hundreds of positions. It does mean that it doesn’t take a lot of positions being sold and bought to contribute to the turnover ratio. To go back to IWB, being that it is included as a benchmark, it is interesting to note that that fund has 1022 positions.
IWB also has a higher allocation to tech. That can explain some of the differences in performance too. Here is a look at the sector weightings for CII.
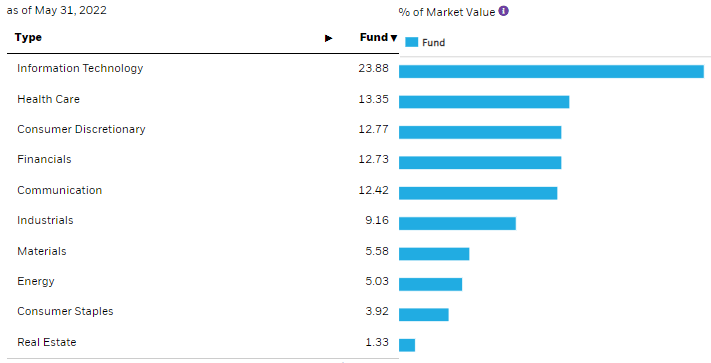
CII Sector Weightings (BlackRock)
IWB lists almost 27% of its portfolio in the tech sector. It highlights one of the reasons that I like CII, as it is a bit more diversified amongst sectors than we typically see. It also meant detracted performance historically but is resulting in better results now that value-oriented sectors are performing better in the current environment.
That being said, we see the usual mega-cap tech names in the top positions when looking at the top ten. Following those, we have more recognizable large-cap names but from outside the tech space.

CII Top Ten (BlackRock)
Corteva (CTVA) is a massive company but not a name we often see. They are in the materials sector and the fertilizers and agricultural chemicals industry. The stock has run significantly higher over the last year, providing good results for CII. A lot of that performance came through just on a YTD period too. It is one of those positions that is making CII hold up better this year.
Then there is also ConocoPhillips (COP). As an energy play, with crude oil prices surging higher, it has done incredibly well this year. CTVA and COP were the clear outperformers on a YTD basis.
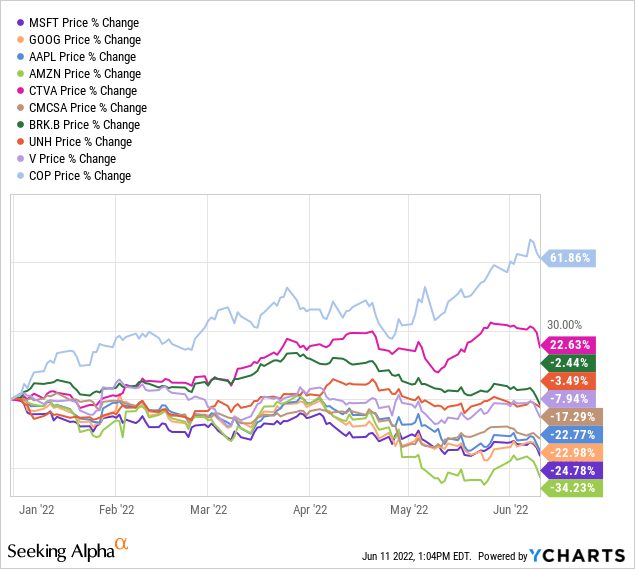
YCharts
That’s quite the reversal from the markets being dominated by tech the last few years. Now they are the ones that are holding back these sorts of diversified CEFs.
Conclusion
The fund’s discount has not widened significantly even during this volatile period. Typically, this is a common characteristic of closed-end funds during times of volatility. However, the valuation of the entire market has been coming down, which could indicate that it’s still a fairly attractive time to be adding to a diversified fund such as CII.
The fund itself has been holding up better than its benchmark and the broader indexes this year. This seems to be attributed to its covered call writing strategy and the fund having an underweight allocation to tech relative to its benchmark. As a fund that will focus primarily on capital gains to fund its distribution, it still seems that the current payout is still sustainable and reasonable. I believe for these reasons that the fund is worth considering adding to at this time, but it isn’t necessarily a screaming buy either.
Be the first to comment