

Bitcoin (BTC) Charts and Analysis:
- Macro fundamentals continue to control Bitcoin’s price action.
- The odds of a breakout are shortening.
Recommended by Nick Cawley
Get Your Free Introduction To Cryptocurrency Trading
The last few weeks have been relatively quiet in the cryptocurrency market with prices drifting towards, and testing, zones of support. The ongoing narrative of higher rates for longer to combat inflation has kept a lid on any upside move with any short-term rally seen as an opportunity to hit the sell button. While the price of Bitcoin has drifted lower of late, support continues to hold firm, leaving traders looking at a narrowing range.
Bitcoin Daily Price Chart – October 5, 2022
Chart via TradingView
The weekly BTC/USD chart shows the recent stalemate and also highlights that the longer-term downtrend is closing in on the multi-month support level. This suggests that a breakout is on the cards and with the ATR reading at a multi-month low, suggesting that the market is relatively complacent, a break could be sharp. A convincing break of support around $17.66k could see $12.5k to $14k come into play, levels last seen over two years ago. A break above the downtrend would see the mid-August weekly high at $25.k the next upside target.
Bitcoin Weekly Price Chart – October 5, 2022
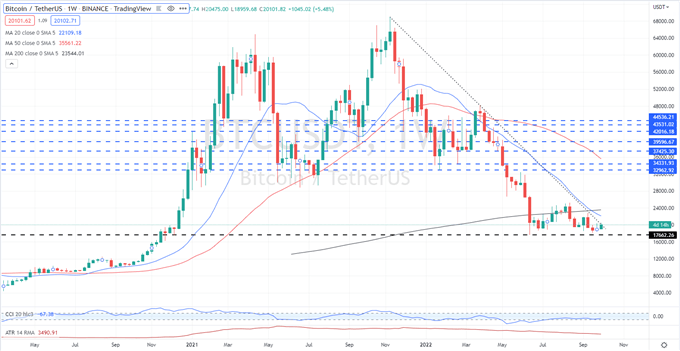
Chart via TradingView
What is your view on Bitcoin – bullish or bearish?? You can let us know via the form at the end of this piece or you can contact the author via Twitter @nickcawley1.
Be the first to comment