Although I spend the vast majority of my time surfing the outer edges of the risk frontier, with a focus on small cap value, special situations, and turnarounds, my formal buy side training was actually in investment grade (IG) bonds. For a five-year stretch, I worked directly with Portfolio Managers and Senior Analysts, within a team that managed upwards of $45 billion of IG assets. Because of this training, I can tell you first hand, that in a world with a 10YR U.S. trading just north of 3%, it is very difficult to find bonds that trade at 8% yields (yields to maturity) that reasonable and risk averse people might consider as low risk. Yes, you can go out and buy bonds sporting 8% or 9% yields. But make no mistake, more often than not, you are taking credit risk and reaching for yield. And, of course, when you take credit risk, your principal isn’t well insulated from loss or risk of a drawdown.
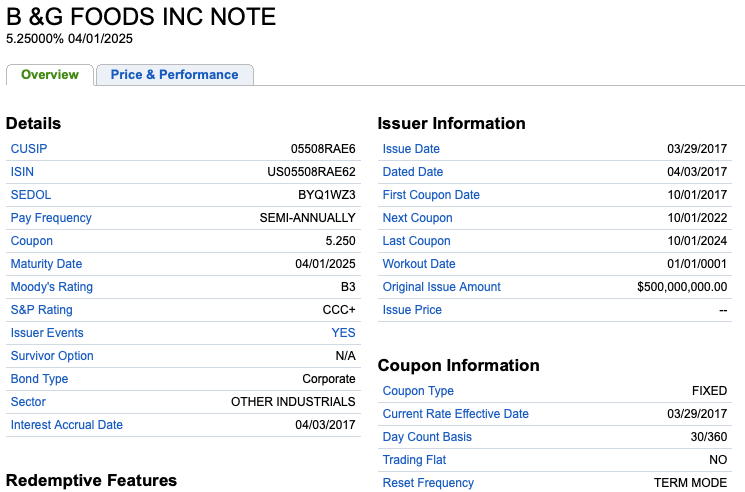
Last week, there was an article published on Seeking Alpha: An 8% Bond Opportunity In Consumer Staples: B&G Foods. The article highlighted B&G Foods’ (NYSE:BGS) 5.25% 4/1/2025 bond and offered a bullish view on this bond. And just to be clear, throughout the article, I am focused on this B&G Foods bond and not the stock. Also, before we get started, I want to point out the bond in question is rated low single B, or B3, by Moody’s, and CCC+, by S&P. For perspective, that is a very low ranking on the high yield risk spectrum, meaning higher risk, at least according to Moody’s and S&P’s risk frameworks.
See below:
Fidelity
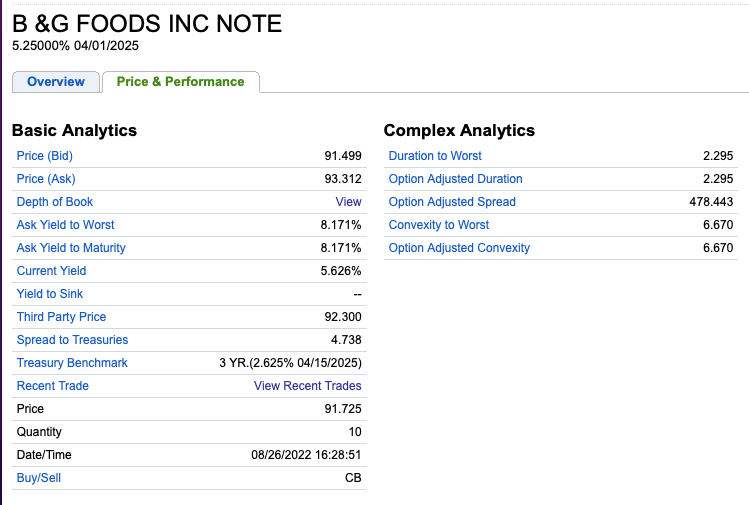
Recent Price information.
Fidelity
In today’s piece, I want to explain why I wouldn’t consider B&G Foods as an attractive credit, even with an 8% yield, as I would argue bond investors aren’t being paid enough for the risk.
1) An alarming leverage ratio of 7.4X. Moreover, BGS’ FY 2022 Adj. EBITDA Guidance Has Gone From $363 million to $310 million (from March 1, 2022 to August 4, 2022)
When it comes to B&G Foods, you need to understand how leveraged this business is and why this greatly increases its risk profile. After two consecutive poor quarters, Q1 and Q2 FY 2022, B&G’s long-term debt stood at $2.292 billion, as of July 2, 2022.
On March 1, 2022, BGS reported its Q4 FY 2021 results and guided the street to FY 2022 Adj. EBITDA of $363 million (at the mid-point).
B&G Foods Earnings Release (March 1, 2022)
On May 5, 2022, BGS reported its Q1 FY 2022 results and took down its full year FY 2022 Adj. EBITDA guidance to $353 million (at the mid-point).
B&G Foods increased its net sales guidance for full year fiscal 2022 to a range of $2.10 billion to $2.14 billion. B&G Foods revised its full year fiscal 2022 adjusted EBITDA guidance to a range of $348 million to $358 million, and adjusted diluted earnings per share to a range of $1.65 to $1.75.
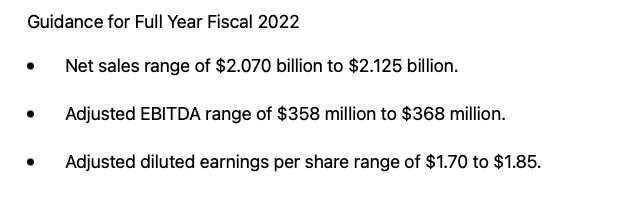
On August 4, 2022, BGS reported its Q2 FY 2022 results and took down its full year FY 2022 Adj. EBITDA guidance to only $310 million (at the mid-point).
B&G Foods reaffirmed its net sales guidance for full year fiscal 2022 at a range of $2.10 billion to $2.14 billion. B&G Foods revised its full year fiscal 2022 adjusted EBITDA guidance to a range of $300 million to $320 million, and adjusted diluted earnings per share to a range of $1.08 to $1.28.
For a business this leveraged and purportedly this defensive, this is alarming and disconcerting.
To calculate BGS’ net leverage ratio (or often referred to as turns of leverage in the high yield world), we need to take $2.292 billion of debt (the numerator) and divide by FY 2022 Adj. EBITDA of $310 million (the denominator). That is an alarming 7.4X turns of leverage. Moreover, given the recent back to back negative surprises, and notably magnitude of the negative Adj. EBITDA surprise, B&G really can’t be considered as an attractive bond, with an 8% yield.
Moreover, I would argue that net leverage and future free cash flow are the most important metrics when it comes to high yield bonds. Net interest coverage is less important, as bond investors need to a pathway to get their principal back not just receive their coupon payments.
B&G Doesn’t Generate Much Free Cash Flow
In the bond world, more so in non-investment grade (or high yield bonds), so much of your time is spent understanding the financial statements, as you are only earning the coupon and need to get your principal back via either a successful refinancing or getting paid back the principal, at par, at maturity. In other words, if the business does well, you don’t really participate in that upside and if the business does poorly then your principal can be at risk. Therefore, good fixed income investors want a margin of safety and to stress test their assumptions as the downside can be material.
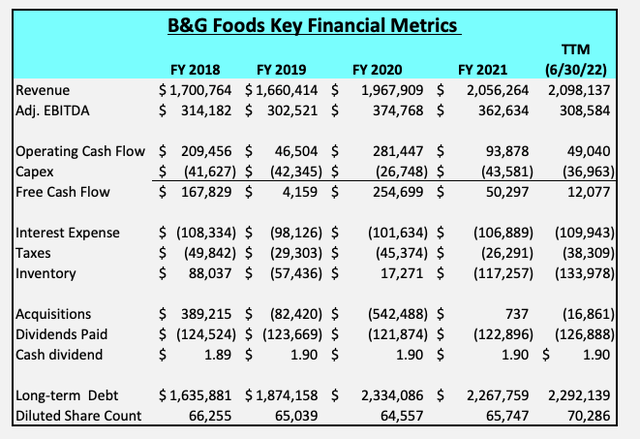
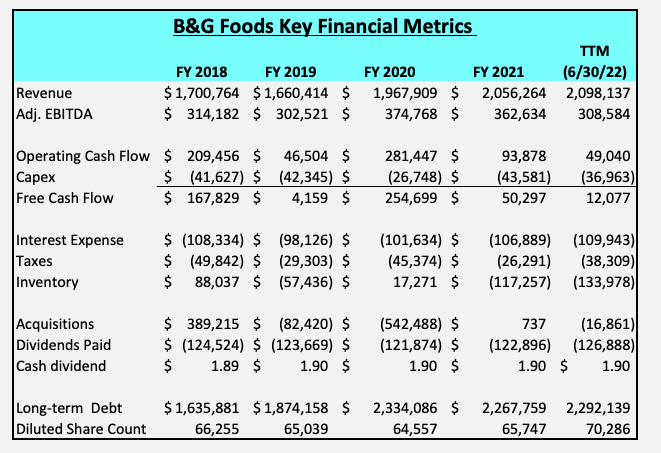
As a case and point, I took the time to dig through B&G’s past 10-Ks and 10-Qs and I created this chart for readers to get a historical perspective on the business. As you should be able to clearly see, B&G, at least historically, doesn’t really generate much free cash flow. This is because interest expense, taxes, and increases in inventories, chew up a lot of the business’s operating cash flow.
Exacerbating this cash flow leakage is the fact that B&G pays a very high dividend. As the business has struggled, notably over the past few quarters, and B&G has resorted to selling 6.5 million shares, in ATM (at the market) secondary offerings.
The approximately 6.5 million shares of common stock sold by the Company through the Company’s at-the-market (ATM) equity offering program after the second quarter of last year, partially offset by increases in net pricing
(Source: August 4, 2022 B&G Foods earnings release)
Author’s Chart Created From B&G’s 10-Ks and 10-Qs
As a bond investor, you, this isn’t what you want to see. You want to see a business that generates consistent and meaningful free cash flow that can be earmarked to reduce net leverage. So again, the absolute level of net long-term debt is very high here, and has remain high for a while, and free cash flow is inconsistent and relatively low in the context of its elevated absolute debt. Therefore, I urge readers not to get overly distracted by Adj. EBITDA or net interest coverage as operating cash flow and free cash flow are better metrics given the high leverage here.
There Is Risk To B&G Hitting Its Full Year FY 2022 Adj. EBITDA Figure
The bulls will argue that B&G has put in motion a number of big price increases, but given the nature of the business, there is a two to three month lag between announcing the price increases and when they show up at the grocery store. The implicit assumption is that B&G products have name brand value such that consumers won’t trade down to similar private label products to save money. To measure this, B&G’s management team frequently discusses elasticity of demand, albeit anecdotally and selectively.
If you actually read and synthesize B&G’s Q1 FY 2022 and Q2 FY 2022 conference calls, you should be able to work out that management noted elasticity to rapid price increases and as well additional reliance on higher trade spending.
Demand Elasticity To Raising Prices
Q1 FY 2022 Conference Call
Exhibit A
Net sales increased by 5.4% versus the first quarter of 2021, ahead of our expectations. Sales were driven by continued elevated demand compared to pre-COVID levels and higher pricing with relatively low elasticities.
Exhibit B
B&G Foods Q2 FY 2022 Conference Call
Q2 FY 2022 Conference Call
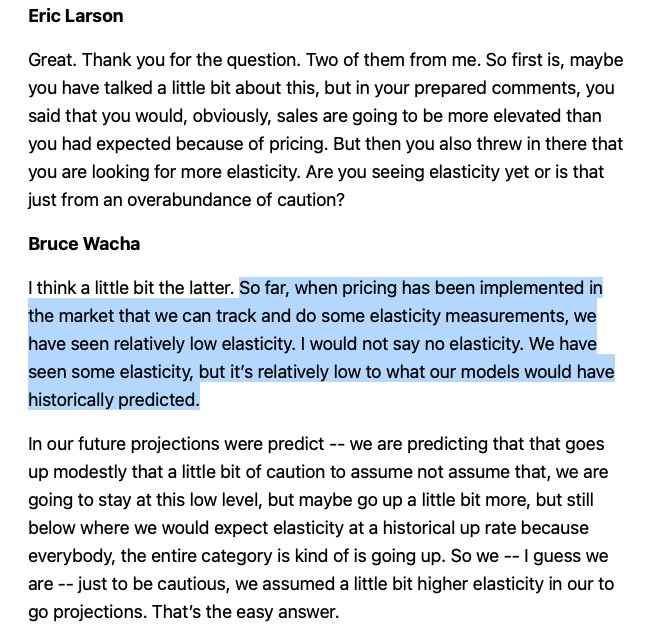
Exhibit C
We are seeing some elasticity drag, but so far these elasticity effects have been modest and are largely in line with our forecasts. Based on our June monthly performance, the execution of our pricing initiatives and some moderation in the level of commodity costs, we believe that we have seen the trust in terms of the margin compression in overall financial performance. We are cautiously optimistic with regards to the rest of the year.
Exhibit D
In addition, elasticities on some brands have increased modestly in recent weeks, although still well below historical levels.
Crisco elasticity for example is now at 0.5 to 0.6 with the last increase as a few consumers trade down to private label
Exhibit E
And although, we achieved tremendous list price increased benefits during the quarter across our portfolio, we also had some promotional programs that we needed to protect with higher trade spending, which led to delayed gratification in some of our pricing efforts.
So, if you compare and contrast, from Q1 FY 2022 to Q2 FY 2022, management’s tone has gone from sanguine about their ability to pass through big prices increases to offset rapid input inflation and maintain EBITDA margins to only guardedly optimistic.
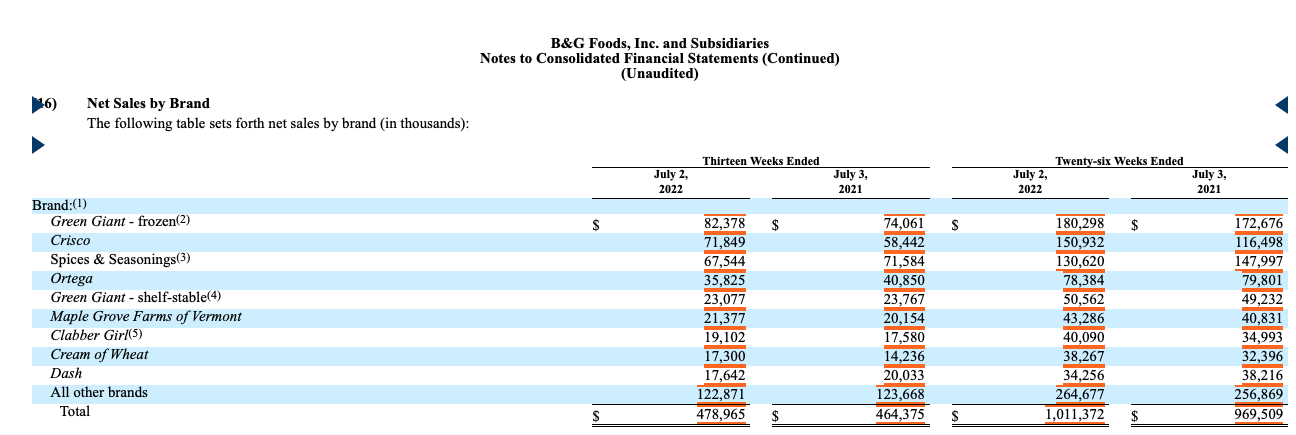
Secondly, if you are really good at synthesizing, I would argue a big reason why Adj. EBITDA has gotten dinged during the first half of FY 2022, outside of the big input cost inflation, is the higher margin spices and seasonings segment has lower volumes coming off the Covid surges.
On the Q2 FY 2022 conference call, management calls out that the spices and seasonings business is high margin.
We announced the formation of the four business units last month, they are, spices and seasonings, representing approximately 18% of B&G Foods’ net sales, and the number two player in the high margin spices and seasonings category. With a strong portfolio of consumer-facing brands, including Dash, Weber, Spice Islands, et cetera. Our aspirations are to grow this business organically in the low single digits, long term, and add new positions to the B&G Foods’ portfolio through product expansion and acquisition. This unit will be led by Jordan Greenberg, formerly B&G’s Chief Commercial Officer.
And if you look at B&G’s FY 2022 Q2 10-Q, you quickly work out that Spices and Seasonings sales were down 11.76%, during the 1st half of 2022.
B&G Foods Q2 FY 2022 10-Q
Putting It All Together
No question, the food and grocery segment is relatively defensive and it benefits from relatively stable demand as well as the fact there isn’t a big threat of getting technologically leap frogged, but as always, the devil’s in the details. Secondly, you just can’t make big sweeping general statements and apply them to every business within a sector. Just because General Mills (GIS), The Kroger Co. (KR), Kellogg Company (K), or Hormel Foods (HRL), and many others larger food companies are super defensive, that doesn’t mean B&G Foods is in the same galaxy of safe.
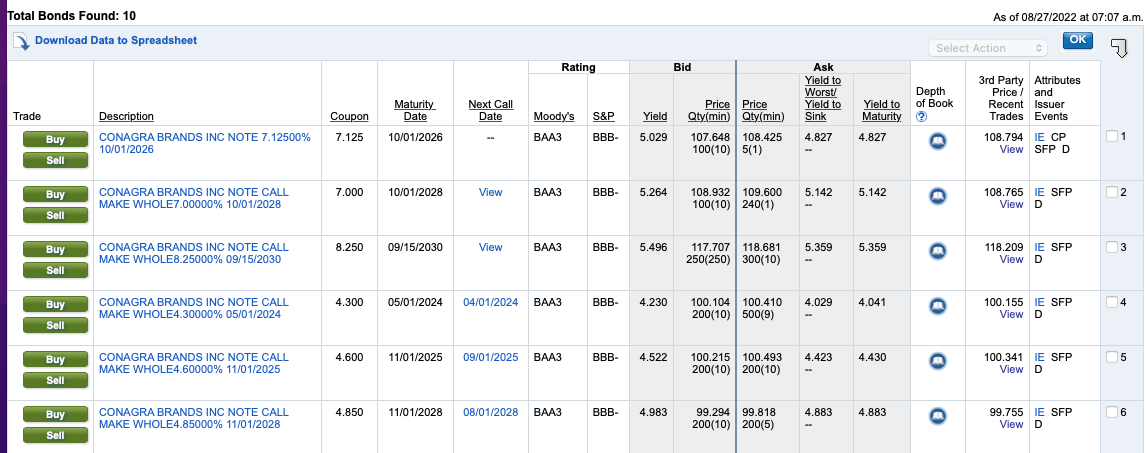
In fact, if you are looking for a safer bond, a bond where you don’t have to worry too much about your principal becoming impaired, then I would argue that Conagra Brands, Inc. (CAG) is a far better credit than B&G Foods. The Conagra bonds don’t yield as much, but they are safer.
Enclosed below, you can see Conagra has a number of bonds where you can earn close to 5%, if you are willing to move out six years, and purchase the 2028s. If you want shorter duration then the 2026s still pay close to 4.83%.
Fidelity
As for B&G, the company has way too much debt, and just doesn’t generate sizable free cash flow that can be earmarked to pay down significant amounts of debt. And the relatively inconsistent free cash flow the business does generate has been used to pay an unsustainable dividend. Moreover, like most management teams, the team at B&G gets paid to keep its stock price as high as possible. If there is a dividend cut, this would only occur if management concludes they can’t hits its Adj. EBITDA outlook, not just 2nd half 2022, but more so in FY 2023. And although a reduced dividend might benefit the bond holders, at least in the short term, the equity would get dinged and this could, ultimately, concern debt holders.
Lastly, and I plan to spent more time on this subject, albeit, periodically, it is extremely difficult to earn 500 Bps (over treasuries) and buy bonds that risk averse fixed income investors would consider low risk.
Despite the 8% yield on the B&G 5.25% 4/1/2025 bond, I just don’t think investors are being fairly compensated for the higher risk profile here.
Please note that foreign exchange and other leveraged trading involves significant risk of loss. It is not suitable for all investors and you should make sure you understand the risks involved, seeking independent advice if necessary.


Be the first to comment