

olaser
Both Realty Income (NYSE:O) and Essential Properties Realty Trust (NYSE:EPRT) are high yield triple net lease REITs with investment grade credit ratings. O has a long and impressive track record with stronger tenants while EPRT is growing faster.
In this article, we will compare them side by side and offer our take on which one is a better buy right now.
Realty Income Vs. Essential Properties Realty: Business Model
Both businesses have similar business models in that they buy primarily single tenant free-standing retail properties and then rent them out to tenants using triple net leases real estate model. In this model, tenants are responsible for recurring property expenses such as OpEx and CapEx, resulting in very stable profit margins for landlords. Furthermore, the leases are generally 10-20 years in length and are typically very safe, even sometimes during bankruptcies. This is particularly true when the landlord carefully underwrites the properties, which is true for both O and EPRT. As a result, these two REITs generally have a very stable cash flow profile with relatively low risk, as evidenced by their stable fundamental performance and high occupancy rates through recent economic cycles such as the Great Recession and COVID-19 lockdowns.
O benefits from its immense scale as the largest triple net lease REIT. Its real estate empire currently consists of 11,733 properties and 1,147 tenants spanning 79 industries. In contrast, EPRT has just 1,572 properties, making it only 13% the size of O. That said, 1,572 properties still provide plenty of diversification and it matches up better on a tenant diversification basis with 329 tenants (29% of O’s).
Moreover, with a weighted average lease term of 14-years and only 4.2% of its ABR expiring through 2026, EPRT is well positioned to weather short-term macroeconomic headwinds. In contrast, O has a much shorter 8.8 year weighted average lease term and 21% of its ABR is set to expire by the end of 2026. While these numbers are not bad, they are not nearly as near-term recession resistant as EPRT’s are.
However, one area where O has a clear advantage is that 43% of its rent comes from investment grade tenants. While O targets tenants with higher credit quality, EPRT focuses on property-level underwriting.
Having an investment grade tenant obviously has its advantages, however there are also major positives to EPRT’s approach. First and foremost, by leasing properties to tenants who lack investment grade credit, EPRT can generally command better terms such as higher initial cap rates, better contractual annual rent increases, and even better property-level economics. As a result, even if its tenant goes bankrupt, it is very unlikely to default on its lease at these properties given that they are its profit centers and are not the cause behind its bankruptcy. Furthermore, properties that are highly profitable are unlikely to go vacant after the initial lease term is up as the tenant will want to retain it for its profitability. This is why EPRT targets properties that often enjoy 4x rent coverage (its average unit-level rent coverage is 4.2x), giving it immense margin of safety. By contrast, most business development companies (BIZD) lend to similarly non-investment grade middle market companies at 2-2.5 interest rate coverage ratios. This helps to reflect how much safer EPRT’s cash flows are to those of many BDCs (which of course is compensated for in their higher dividend yields relative to EPRT).
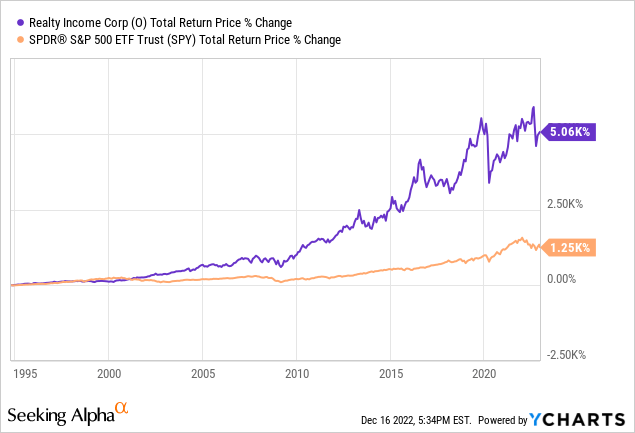
Both companies’ results speak for themselves. O has generated per share growth in 25 out of the past 26 years, is a Dividend Aristocrat, and has crushed the S&P 500 (SPY) since going public decades ago:
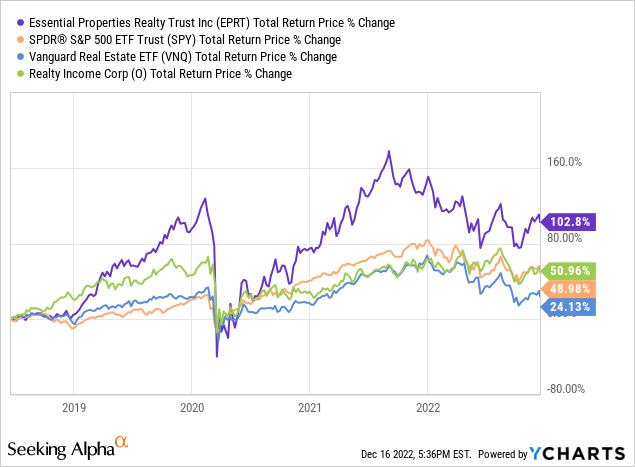
Meanwhile, EPRT has generated phenomenal performance since going public nearly five years ago, more than doubling the total returns generated by O and SPY and more than quadrupling the performance of the broader REIT sector (VNQ) over that span:
Overall, we consider this to be a toss-up. O’s lengthy track record is hard to beat and its significant exposure to investment grade tenants and massive scale are certainly admirable traits. However, EPRT is still more than sufficiently diversified, and its business model weathered the COVID-19 lockdowns quite well. Meanwhile, its total return performance since going public has been vastly superior to O, REITs, and the overall stock market, making it a hard business model to bet against.
Realty Income Vs. Essential Properties Realty: Balance Sheet
O’s A- credit rating means that it is very well positioned to withstand near-term pressures from a financial solvency perspective. It also means that it is generally able to command the best cost of capital in the sector, giving it an investment advantage over its peers. The specifics of its balance sheet support its lofty credit rating: debt maturities are well-laddered, and it has a 6.3 year weighted average term to maturity for its notes and bonds. Moreover, only 12% of its debt is floating rate and 95% of its debt is unsecured. Its fixed charge coverage ratio is 5.5x and its net debt to annualized pro forma adjusted EBITDA is 5.2x, both very solid metrics given its stable underlying cash flows. Finally, it has liquidity of over $2.5 billion.
EPRT, meanwhile, has a BBB- (stable outlook) credit rating from S&P which – while not as strong as O’s – still implies that its finances are fairly healthy. On top of that, its leverage ratio is quite low at just 4.4x, making it one of the most conservatively financed triple net lease REITs in the sector and giving it a 0.8x lower leverage ratio than O. With 4.5x to 5.5x as its stated long-term target profile, EPRT has plenty of room to leverage up to further grow cash flows per share. EPRT also has hardly any debt coming due in the near term. In fact, its only outstanding debt due before 2027 is a $200 million unsecured term loan maturing in 2024. Given where we are in the economic cycle, this is an invaluable position to be in.
Both balance sheets are clearly strong, but O gets the edge here by virtue of its superior credit rating.
Realty Income Vs. Essential Properties Realty: Dividend Outlook
Moving forward, O’s dividend growth outlook remains on par with recent history as its immense size makes outsized growth increasingly difficult to achieve. In 20922 it grew its dividend per share by 4.7% and next year, its dividend per share is expected to grow by 3%. This year, its AFFO per share is expected to have grown by an impressive 8.5% but next year it is expected to increase by only 2.9%
Meanwhile, EPRT has a much smaller portfolio, so it is able to grow its AFFO and dividend per share at a much faster clip. In 2022 alone it grew its dividend by 8.3% and is expected to grow its AFFO per share at a 13.8% rate. Next year, its dividend is expected to grow by 4.2% and its AFFO per share is expected to grow by 4.9%. While these numbers are a significant step down from 2022, they are still convincingly better than O’s.
We expect both businesses will continue to grow their dividends each year for many years to come, but believe that – at least for the next few years – EPRT’s AFFO and dividend growth rates will outpace O’s due to its smaller starting base, its lower dividend payout ratio (enabling it to retain more cash flow to reinvest in new properties), its lower leverage ratio (enabling it to take on additional leverage if needed to juice growth), and its more attractive cap rates on new acquisitions.
Realty Income Vs. Essential Properties Realty: Valuation
When comparing these REITs side-by-side, we see that – while they have similar dividend yields and price to NAV ratios – EPRT is convincingly cheaper than O on a P/AFFO and EV/EBITDA basis:
| Metric | P/AFFO | FWD Dividend Yield | EV/EBITDA | P/NAV |
| EPRT | 14.87x | 4.70% | 15.35x | 1.12x |
| O | 16.30x | 4.70% | 17.34x | 1.15x |
This makes sense because – as we discussed in the business model section – EPRT targets properties and tenants that offer higher cash flow yields in exchange for lower tenant credit quality.
Investor Takeaway
The choice here really boils down to this:
- O is the superior choice if you really like monthly dividends (EPRT pays quarterly), put a lot of emphasis on a lengthy track record, and take comfort in O’s superior credit rating and investment grade tenant exposure.
- EPRT is the superior choice if you trust their unit-level underwriting method and favor faster growth rates and greater total return potential.
At High Yield Investor, we prefer EPRT as we believe its lower leverage and superior lease expiration terms and unit-level rent coverage compensate for its other weaknesses relative to O, and the total return profile at EPRT is significantly better than it is at O. You can read our full EPRT investment thesis here.
Be the first to comment