

adaask
Magellan Midstream Partners (NYSE:MMP) and Enbridge (NYSE:ENB) are both midstream businesses with very stable cash-flowing business models. MMP’s yield is ~230 basis points greater than ENB’s and they both have sector-leading BBB+ credit ratings. That said, ENB issues a 1099 whereas MMP issues a K1.
In this article, we will compare the business models, balance sheets, growth potential, and valuation of these two companies side-by-side to determine which is the better buy today.
Magellan Midstream vs Enbridge: Business Models
While both businesses have strong business models, ENB wins by virtue of its superior scale, diversification, and the sheer quality of its contracts and counterparties. Its crude oil pipeline network is number one in North America and its network of natural gas transmission pipelines is number two in the United States. Last, but not least, ENB is the largest natural gas distributor in North America.
Its cash flows are also exceptionally stable with 98% of them linked to commodity price-proof contracts which are typically either take-or-pay or fee-based. ENB’s contracts are also quite strong given that investment grade counterparties account for 95% of the cash flow. This very consistent cash flow stream has enabled ENB to grow its dividend for 27 years in a row.
MMP, meanwhile, has grown its distribution for 20 years in a row on the back of a high quality and highly reliable asset portfolio and very disciplined capital allocation practices. It has generated an industry-best 16% 15-year average return on invested capital, which is significantly superior to ENB’s paltry 3.5% 15-year average return on invested capital.
This highly disciplined approach to capital allocation is reflected in management’s shifting capital allocation strategy. In 2019, MMP invested about $1 billion into expansion capital spending with no money spent on unit repurchases. In 2021, expansion capital spending fell to ~$100 million, whereas unit repurchases surged to ~$500 million. Moving forward, this trend is likely to continue as MMP doubles down on its high quality core assets and returns all excess cash to unitholders via distributions and unit repurchases.
MMP’s cash flows are over 85% fee-based and 72% stem from refined products and 28% from crude oil. Management expects the refined products business to boom for decades to come given the strategic location of the assets and the company’s overall competitive positioning.
MMP vs ENB: Balance Sheets
Both businesses boast industry-leading BBB+ credit ratings. This is largely due to the fact that – while ENB’s asset portfolio is far larger and better diversified – it also has a lot more leverage. ENB’s management expects the debt/EBITDA ratio to come in at under 4.7x at year-end. In contrast, MMP’s debt/EBITDA ratio is currently 3.8x.
MMP has no long-term debt maturing prior to 2025, only 17% of its total net long-term debt is due prior to 2030, and the vast majority of its debt is due in 2042 or later, giving it a very conservative debt maturity schedule.
ENB also has an exceptionally well laddered debt maturity ladder, with a large percentage of its debt maturing in the 2030s, 2040s, 2050s, 2060s, and even one note maturing in 2080:
ENB Debt Maturities (2021 Annual Report)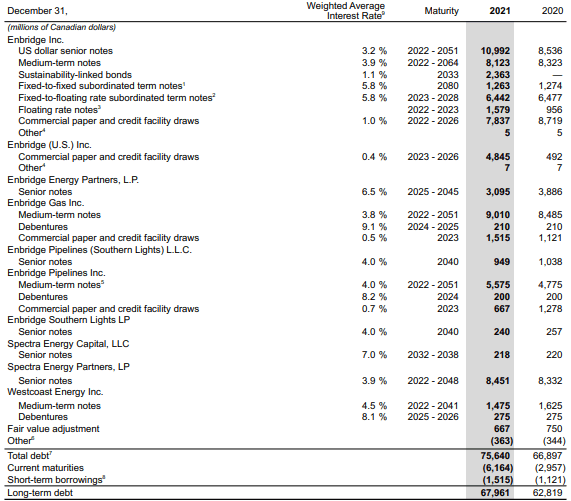
As a result, we give MMP a slight edge here, though both businesses have phenomenal balance sheets with little to no worry of financial distress for the foreseeable future.
Magellan Midstream vs Enbridge: Growth Potential
Both MPLX and EPD continue to invest in opportunistic growth projects, though ENB’s growth investments are far more aggressive than MMP’s right now.
MMP’s management has largely scaled back their capital expenditures in favor of buying back units aggressively to drive per-unit growth. Furthermore, MMP’s refined products business is poised to benefit tremendously from inflation-linked tariff increases. As a result, MMP’s distributable cash flow per unit is expected to increase by 7.2% in 2023 and then by 6.5% in 2024. However, this year’s growth rate is expected to be a meager 2.5%, so the 3-year expected CAGR is 5.4%. Meanwhile, MMP’s expected EBITDA CAGR through 2024 is 2.0% while its expected DCF CAGR is 1.9%. The reason why per unit distributable cash flow growth is expected to be so much higher than overall DCF and EBITDA growth is because MMP is expected to continue aggressively repurchase units.
In contrast, ENB is investing in several organic growth projects across its portfolio and is also rapidly expanding its renewable energy portfolio. However, many of these growth investments will take years to manifest themselves and ENB also faces some headwinds from expiring contracts. As a result, analysts only forecast distributable cash flow per share growth of 2.8% in 2023 and 3.9% in 2024. However, this year distributable cash flow per share is expected to grow by 8.1%, bringing the 3-year expected CAGR to a more respectable 4.9%. Meanwhile, ENB’s expected EBITDA CAGR through 2024 is 5.3% while its expected DCF CAGR is 4.2%. The reason why per share distributable cash flow growth is expected to be higher than overall DCF growth is because ENB is expected to repurchase some shares between now and then.
Overall, MMP and ENB appear to have similar near-term growth prospects as ENB is retaining and reinvesting more cash flow than MMP is, whereas MMP is buying back equity more aggressively and is benefiting more from inflation at the moment since more of its cash flows are indexed to inflation. In the short-term, we give MMP a slight edge here given the strong tailwind from inflation, whereas over the long-term we give ENB the edge as its more aggressive investments will begin to pay off down the line.
MMP vs ENB: Stock Valuation
MMP’s main advantage over ENB is that its distribution yield is significantly higher. However, ENB’s P/DCF multiple is meaningfully lower. When we look at the EV/EBITDA multiples, we see that MMP’s is significantly lower.
| Metric | P/DCF | Distribution Yield | EV/EBITDA |
| MMP | 9.4x | 9.3% | 11.2x |
| ENB | 8.0x | 7.4% | 12.8x |
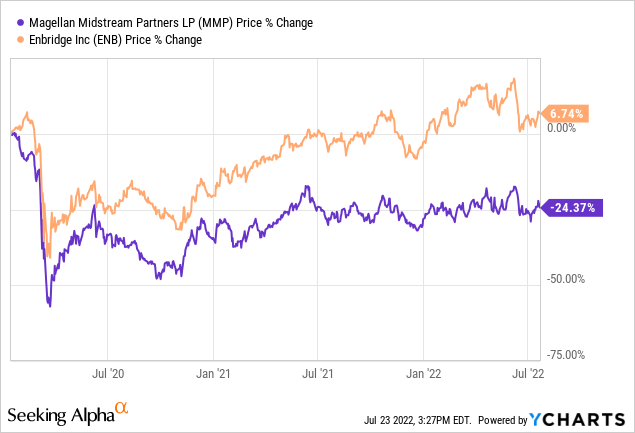
On top of that, ENB is not trading at any discount to its pre-COVID levels whereas MMP still is:
It is also worth noting that ENB’s dividend coverage ratio is expected to be 1.56x this year whereas MMP’s distribution coverage ratio is expected to be 1.25x. Given the similar risk profile as indicated by the similar credit ratings, ENB’s dividend is clearly safer than MMP’s distribution, though both look safe at the moment.
Investor Takeaway
Both MMP and ENB are phenomenal businesses and there is certainly room for both in a portfolio. MMP issues a K1 tax form whereas ENB issues a 1099 tax form, which could help some investors determine which they prefer on that factor alone. Another factor to consider is that MMP is a U.S.-based partnership whereas ENB is a Canadian company, so the tax implications are clearly different.
Overall, we believe ENB offers investors better long-term growth potential whereas MMP offers a substantially superior current yield. If we had to pick one today, we would personally choose MMP given its higher yield, lower EV/EBITDA multiple, simpler business model, lower leverage ratio, and superior returns on invested capital. However, we believe ENB has a bright future as well and rate both securities a Buy at current prices.
Be the first to comment