

shapecharge/iStock via Getty Images
This article was first released to Systematic Income subscribers and free trials on June 25.
Welcome to another installment of our BDC Market Weekly Review, where we discuss market activity in the Business Development Company (“BDC”) sector from both the bottom-up – highlighting individual news and events – as well as the top-down – providing an overview of the broader market.
We also try to add some historical context as well as relevant themes that look to be driving the market or that investors ought to be mindful of. This update covers the period through the fourth week of June.
Be sure to check out our other Weeklies – covering the CEF as well as the preferreds/baby bond markets for perspectives across the broader income space. Also, have a look at our primer of the BDC sector, with a focus on how it compares to credit CEFs.
Market Action
BDCs had a good week, along with the rest of the income space. A lower revision in University of Michigan inflation expectations along with some positive Fed-speak supported the broader market. Month-to-date, the sector return is still around -7%, however, with only one BDC up in June.
Year-to-date FDUS remains in the green with the broader sector off by around 12%.
Systematic Income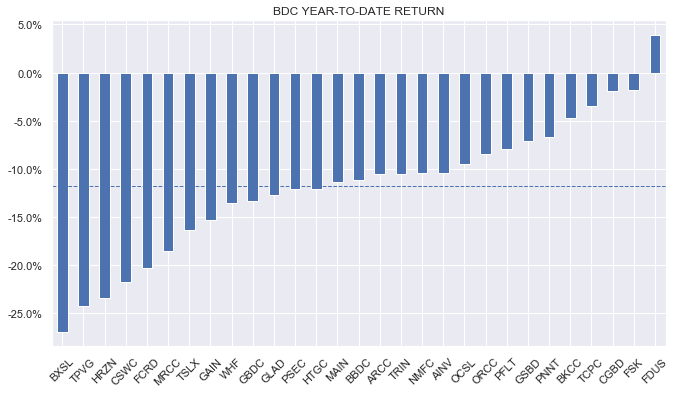
BDCs have started to dig themselves out of the recently dug hole; however, there is much more work to do.
Systematic Income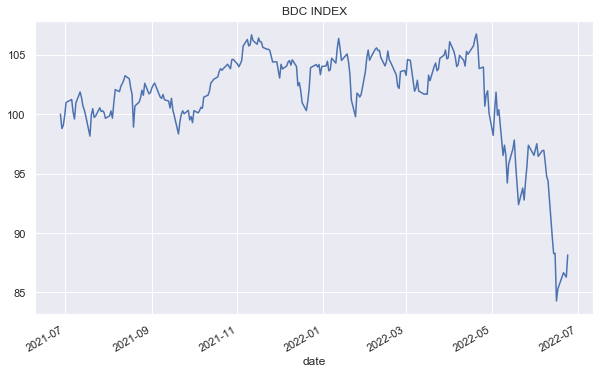
BDCs are likely to finish lower in June which would make it the third down month in a row – something the sector hasn’t experienced in more than 3 years.
Systematic Income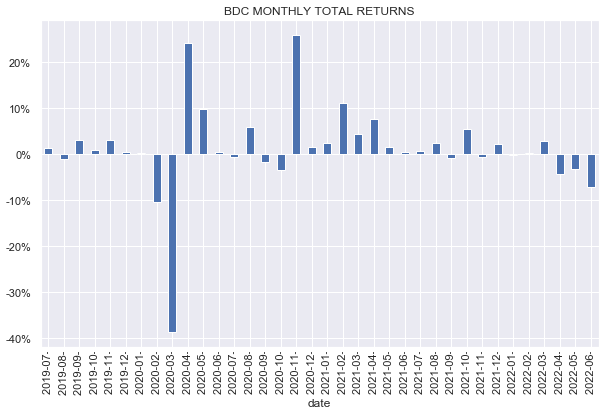
Interestingly, the recent valuation drop looks very similar to what happened in the previous Fed-driven tantrum at the end of 2018. A mild recession will probably take us below a level of 80% – a near recession in 2015 saw the sector valuation touch 80%.
Systematic Income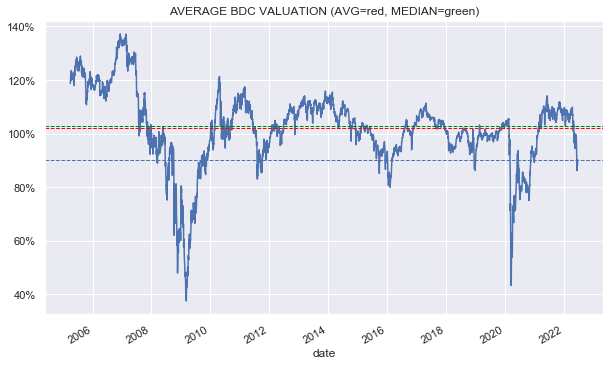
Market Themes
The convention when discussing BDC valuations is to use the current price divided by the last available NAV. The obvious challenge here is that the BDC price (as other exchange-traded income securities) is quoted “dirty” i.e. the opposite of “clean” or “stripped”, meaning the dividend is part of the quoted price. This means that when the dividend falls out on the ex-div date, the price will fall, all else equal. This is why occasionally investors see a drop in the stock’s price and get the impression that it has now become more attractively valued. The reality, of course, is that often this is just due to the dividend falling out which sends the erroneous value signal.
This effect has magnified recently for two reasons. First BDC prices are lower which cause each dividend to be a larger proportion of the stock (i.e. the yield is higher). And two, many BDCs have been increasing their dividend over the past year, driven by an expectation of higher short-term rates as well as a recovery in asset quality over 2021. Consequently, each dividend has a larger impact on the price that investors may have experienced historically.
It is particularly challenging to keep track of this dynamic because recent volatility makes 2-3% price moves (roughly what each dividend is worth) pretty common. Last year the volatility in the sector was much lower and a 3% price move in the stock was very likely to have been due to the quarterly dividend falling off which the investors could more confidently brush off as not being “real”. These days it doesn’t take much for an individual BDC to move 2-3%. The chart below shows that the 5-day moving average of the average absolute daily total return is close to 2%. This means that investors are getting a potentially false value signal much more often.
Systematic Income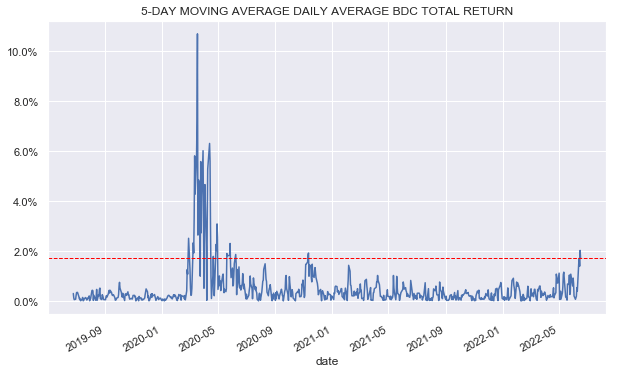
Other income securities such as CEFs don’t have this issue because the vast majority of CEFs provide daily NAVs which also take into account the impact of dividends.
One way to solve this issue is to carefully make a daily adjustment to the valuation – in effect, to come up with a bespoke valuation which takes the dividend bias into account. The way this would work is it would use both clean NAVs (i.e. NAV stripped of the accrued dividend) as well as clean prices. This process would make much more sense; however, it would run into a ton of questions from readers since it would use a different convention than what the rest of the market is used to.
A simpler way for BDC investors to mitigate the impact of the ex-div dates is to simply be aware of these dates. For example, to make this easier for our subscribers we show the latest Ex-Div date so they can be aware of this effect. Alternatively, investors can make an extra allowance for their entry points or limit orders to make sure they are not triggered by the dividend falling off rather than the valuation truly becoming more attractive.
Systematic Income BDC Tool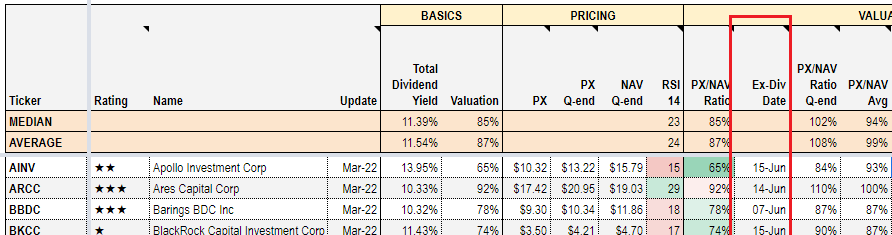
Stance And Takeaways
Q2 earnings releases will clarify a number of important things for investors – specifically, how much NAVs have come off and how much income uplift due to the rise in short-term rates we are seeing across the sector.
In the meantime, we have been adding to our BDC allocations across our Income Portfolios in response to improved valuations as well as making rotations to lock in emerging relative value opportunities.
This week we rotated from the BlackRock TCP Capital Corp (TCPC) to the Golub Capital BDC (GBDC). The valuation of TCPC has more-or-less converged with the sector average, offering less upside. It has also moved to trade at a higher level than GBDC – a fairly unusual event as the following chart shows.
Systematic Income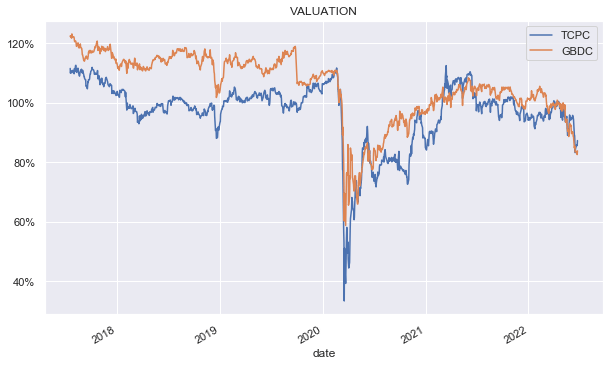
This valuation differential chart shows this more clearly with GBDC trading at a valuation of around 3% below that of TCPC (GBDC at 84% vs. TCPC at 87%).
Systematic Income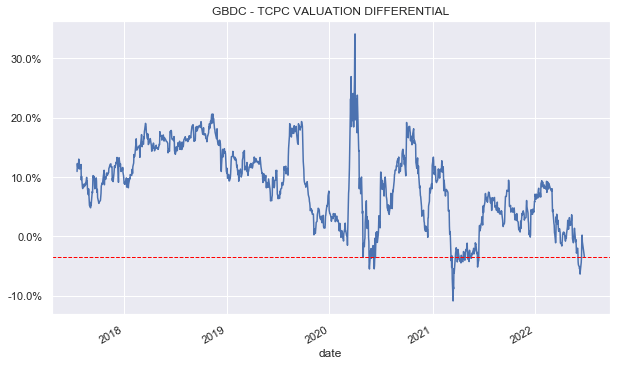
GBDC runs at a lower leverage level and a higher allocation to first-lien loans – a combination which, in addition to its greater margin-of-safety valuation, should allow it to hold up better during a macro downturn than the average BDC.
Be the first to comment