

Darren415
This article was first released to Systematic Income subscribers and free trials on July 30.
Welcome to another installment of our BDC Market Weekly Review, where we discuss market activity in the Business Development Company (“BDC”) sector from both the bottom-up – highlighting individual news and events – as well as the top-down – providing an overview of the broader market.
We also try to add some historical context as well as relevant themes that look to be driving the market or that investors ought to be mindful of. This update covers the period through the last week of July.
Be sure to check out our other Weeklies – covering the Closed-End Fund (“CEF”) as well as the preferreds/baby bond markets for perspectives across the broader income space. Also, have a look at our primer of the BDC sector, with a focus on how it compares to credit CEFs.
Market Action
This was a good week to end a great July for the BDC sector. July performance fully offset the sharp drop over June.
Systematic Income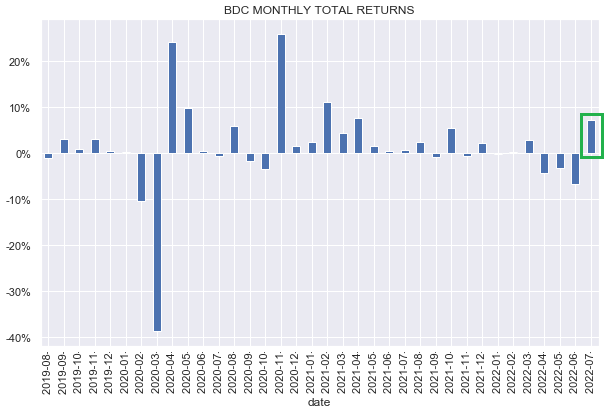
All but one BDC in our coverage were in the green, with the average total return of around 7.5%.
Systematic Income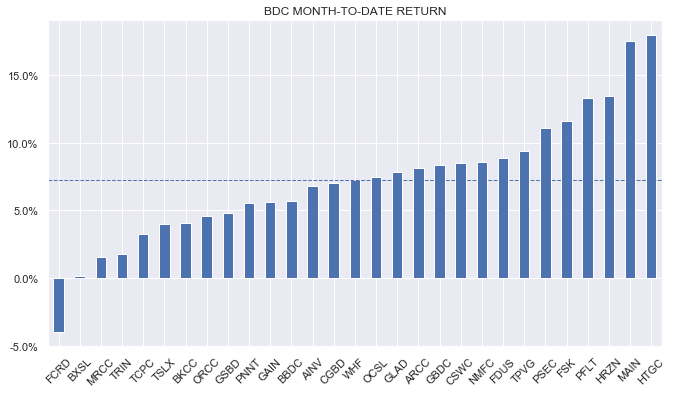
The BDC sector has clawed back close to half of its year-to-date drawdown.
Systematic Income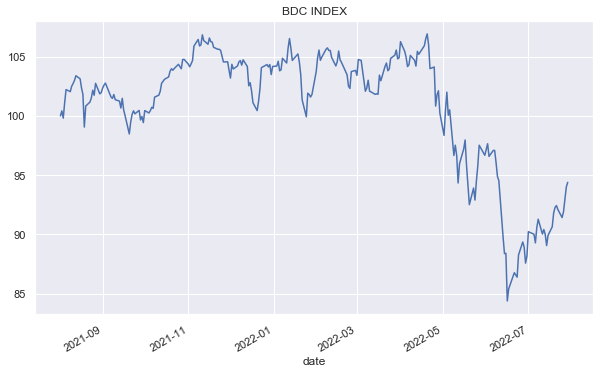
The average valuation bounced back to 97%, although this is arguably closer to 100% if we take into account the likely Q2 NAVs. This would put it right near its historic average levels.
Systematic Income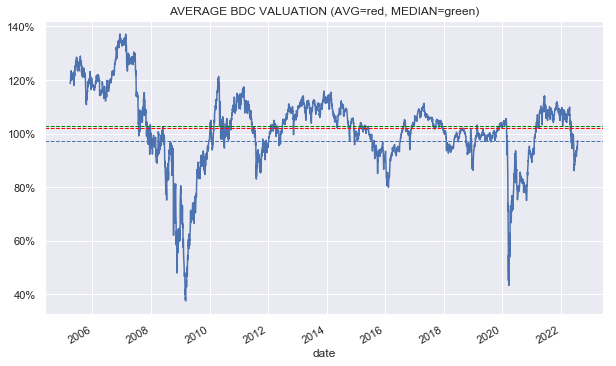
Market Themes
We have seen only a handful of Q2 BDC earnings releases as of this writing; however, a number of common themes are already emerging. So far there are no surprises – these themes are fully in line with our expectation that we have discussed over the previous few weeks.
First, as expected, prepayment / exit fees are running at unusually low levels. The risk-off sentiment across broader markets, and particularly the venture capital space, means there are fewer exit opportunities for portfolio companies via IPOs or mergers. Hercules Capital (HTGC) provides a nice chart of this trend which clearly shows this pattern. Although fees tend to be a relatively small part of overall BDC income, this dynamic continues to be a headwind for overall BDC income.
HTGC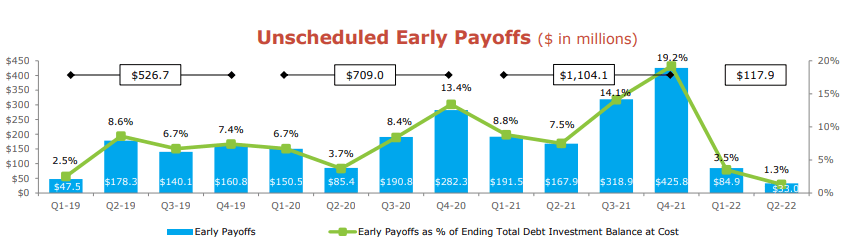
Two, NAVs have moved lower. In an admittedly small sample so far, the average NAV fall is about 3% so far – in line with our expected range. The key driver, as expected, is unrealized depreciation, driven by the widening in credit spreads.
Systematic Income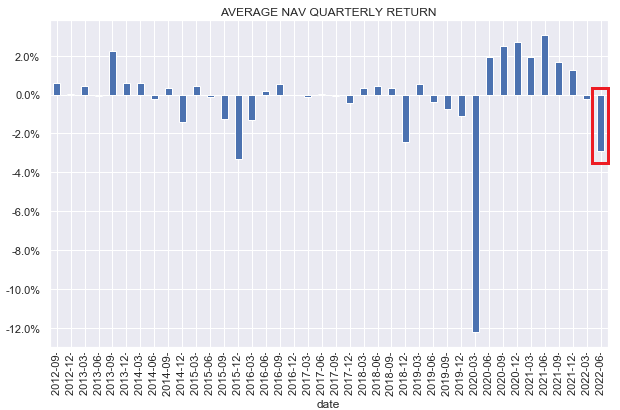
Three, the yields of newly acquired assets are higher. This is a function of two things – higher short-term rates as well as higher spreads. Ares Capital Corp (ARCC) mentioned on the call that new assets are going into the portfolio with spreads that are about 1% higher.
And thankfully now, I think we and most of our other friends and competitors in the private lending space are widening pricing out as well. So an early just preview is probably an additional 100 basis points of spread across most of the tranches as well as higher fees.
Four, net new investments are strongly positive after a relatively slow couple of quarters where a high level of prepayments made it difficult for BDCs to grow assets. The chart below is for Gladstone Capital Corp (GLAD).
Systematic Income BDC Tool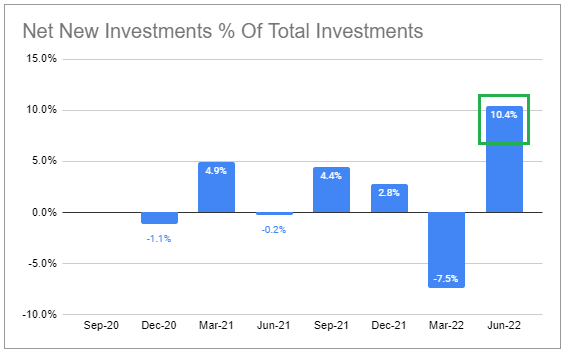
Five, non-accruals appear to be increasing. Non-accruals fell to what looked to be unsustainably low levels at the end of 2021. Given the broader slowdown in activity and higher interest expense, it makes sense for them to start moving back higher. So far, non-accruals are still running at historically low levels. The ARCC chart from our BDC Tool is shown below.
Systematic Income BDC Tool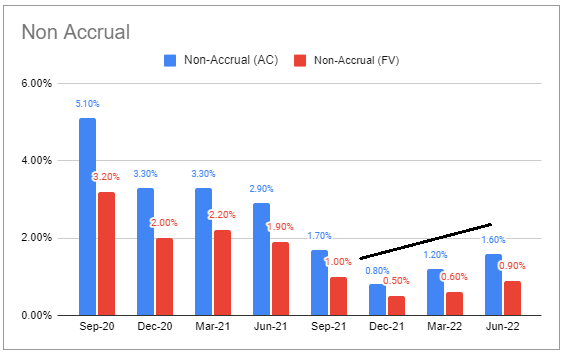
Finally, dividends are increasing. So far there are 3 income tailwinds in play at the same time in the BDC sector: rising LIBOR, increased leverage and wider spreads. Although these factors are not the only ones that drive income, they are fairly large, and they point in the same positive direction. That suggests that, unless portfolio quality falls off a cliff (i.e., non-accruals spike), net incomes will continue to increase in the sector on average, supporting prices.
Market Commentary
Ares Capital Corp reported good results. NAV fell around 1%. The company did register realized losses over the quarter for the first time in a couple of years, but most of the NAV drop was due to unrealized losses from general spread widening.
Core EPS (red bars in the chart below) rose by 10%, primarily from higher LIBOR as well as additional assets from the Annaly transaction – recall the Ivy Hill portfolio bought $2.4bn of the NLY direct lending business. This pushed ARCC leverage to a pretty high 1.23x on a net basis (i.e., net of cash). This is a good 0.2x above the sector average.
Systematic Income BDC Tool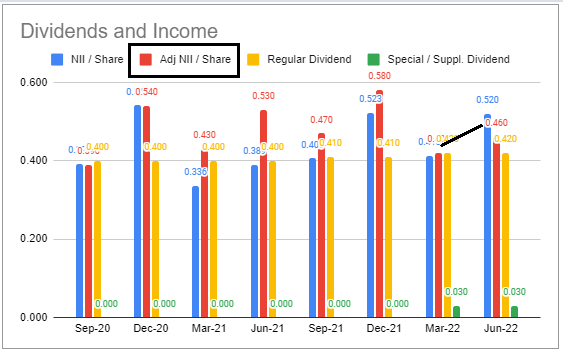
The regular dividend was increased by a penny to $0.43, which, with the $0.03 supplemental makes for a 9.5% yield as of this writing. Valuation settled at 103% after a brief post-earnings rally and a subsequent drop from another public offering.
Regular dividend coverage from Core EPS is 110% and total dividend coverage is 102%. The large spillover as well as the short-term rates rise that are yet to show up in net income suggest that the dividend is very likely to keep rising. Non-accruals rose to 0.9% on fair-value as 1 company was added to the list. Internal portfolio rating quality improved marginally, however. Overall, a very good quarter for the company.
Gladstone Capital Corp also reported results. NAV fell 4%, primarily due to mark-to-market unrealized depreciation (with about 20-30% due to credit revaluation). Leverage increased quite a bit to 0.91x from 0.69x – close to its highest level over the past 2 years – though this is still below the sector average. Net income fell 20% due to a combination of factors, but primarily from a reduction in income-generating assets over Q1 due to a strong prepayment quarter.
Systematic Income BDC Tool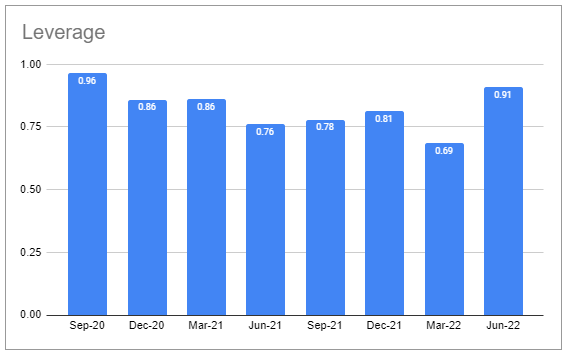
Hercules Capital posted a mixed quarter. NAV fell 3.6%; however, net income ticked higher by 7%. Leverage moved higher as net originations increased by 6%. Regular dividend was increased to $0.35 from $0.32. This is a bit ahead of the company’s NII, so they are probably baking in some of the expected rise from short-term rates over the coming quarters.
BDC Tool Update
This week, we added a new metric to the BDC Tool – net realized gains/losses. It can be useful to keep track of realized gain/losses for BDCs to give a sense of what their underwriting looks like. The metric is not perfect, since in a strong market environment an equity-overweight BDC will look better (and worse in a downturn, all else equal).
That said, it can be a good check to use before allocating – a BDC with consistent realized losses is probably one where you should discount its yield and NAV quite a bit. Persistent realized losses will also obviously make it into the total NAV return, but it can be nice to see it split out. Investors can view the quarterly chart individually as well as the trailing twelve-month chart across all BDCs at the same time. The quarterly chart for ARCC looks like the following.
Systematic Income BDC Tool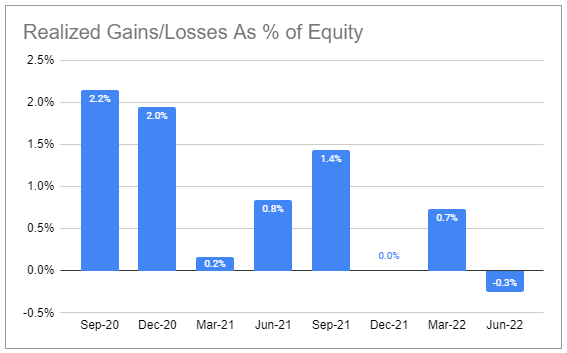
Stance & Takeaways
Having added quite a bit to our BDC holdings over the earlier drawdown, we are quite happy to see the market rally and don’t feel the need to chase higher prices. Real consumer spending is still positive while the labor market remains strong, if slowing from its previous pace. Despite two straight quarters of negative GDP prints, it doesn’t feel like recession is quite fully here.
Recent indicators show that upward pressure on wages remains strong, which suggests the Fed has much more wood to chop before inflation moves back into its comfort zone. This means that we are unlikely to see the Fed cut rates in early 2023 as the market currently expects. In other words, the Fed’s likely trajectory should be much less dovish than the market has baked in. If that’s true, we should see further volatility ahead in the BDC sector, which may open up better allocation opportunities.
Be the first to comment