


EXTREME-PHOTOGRAPHER
The remarkable asset quality improvement over the last year will likely lift BCB Bancorp’s (NASDAQ: NASDAQ:BCBP) earnings this year. Moreover, the second quarter’s outstanding organic loan growth, healthy pipelines, and economic factors will lift the loan balance for this year, leading to earnings growth. The margin will also somewhat benefit from the rising-rate environment. Overall, I’m expecting BCB Bancorp to report earnings of $2.41 per share for 2022, up 26% year-over-year. Compared to my last report on the company, I’ve revised upwards my earnings estimate mostly because I have slashed my provision expense estimate and increased my loan growth estimate. For 2023, I’m expecting earnings to grow by a further 5% to $2.54 per share. The year-end target price suggests a significant upside from the current market price. Therefore, I’m upgrading BCB Bancorp to a buy rating.
Rapidly Improving Asset Quality to Keep Provisioning at a Normal Level Despite Headwinds
The loan portfolio’s asset quality has improved drastically over the last twelve months. The proportion of nonaccrual loans in total loans has plunged, due to which the allowance level now appears somewhat excessive.
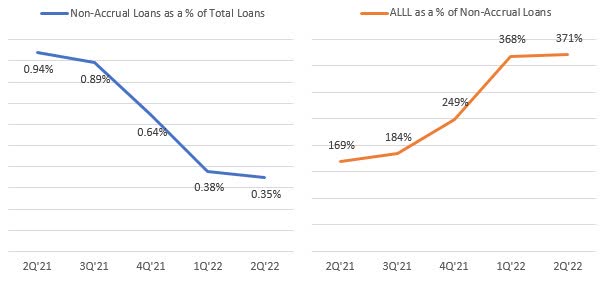
SEC Filings
Mostly because of the excessively high reserve level, I believe BCB Bancorp can easily ride out the economic headwinds foreseen for the next few quarters. These headwinds include heightened interest rates, inflation, and the possibility of a recession in the country.
Overall, I’m expecting provisioning to remain at a normal level in the second half of 2022 and full-year 2023. I’m expecting the net provision expense to make up 0.18% of total loans (annualized) in the second half of 2022 and 0.15% of total loans in 2023. In comparison, the net provision averaged 0.15% from 2017 to 2019 and 0.21% from 2017 to 2021.
Healthy Pipelines, Regional Economy to Support Loan Growth
BCB Bancorp reported exceptional loan growth of 9.4% in the second quarter of 2022, or 37.5% annualized. This growth was organic and mostly driven by the commercial real estate and multifamily segment.
Loan growth will most probably decelerate in the third quarter because the second quarter’s unusual performance is unsustainable. However, loan growth will most probably remain at a decent level partly because of the pipelines’ health. Management called the loan pipeline “substantial” in the earnings release.
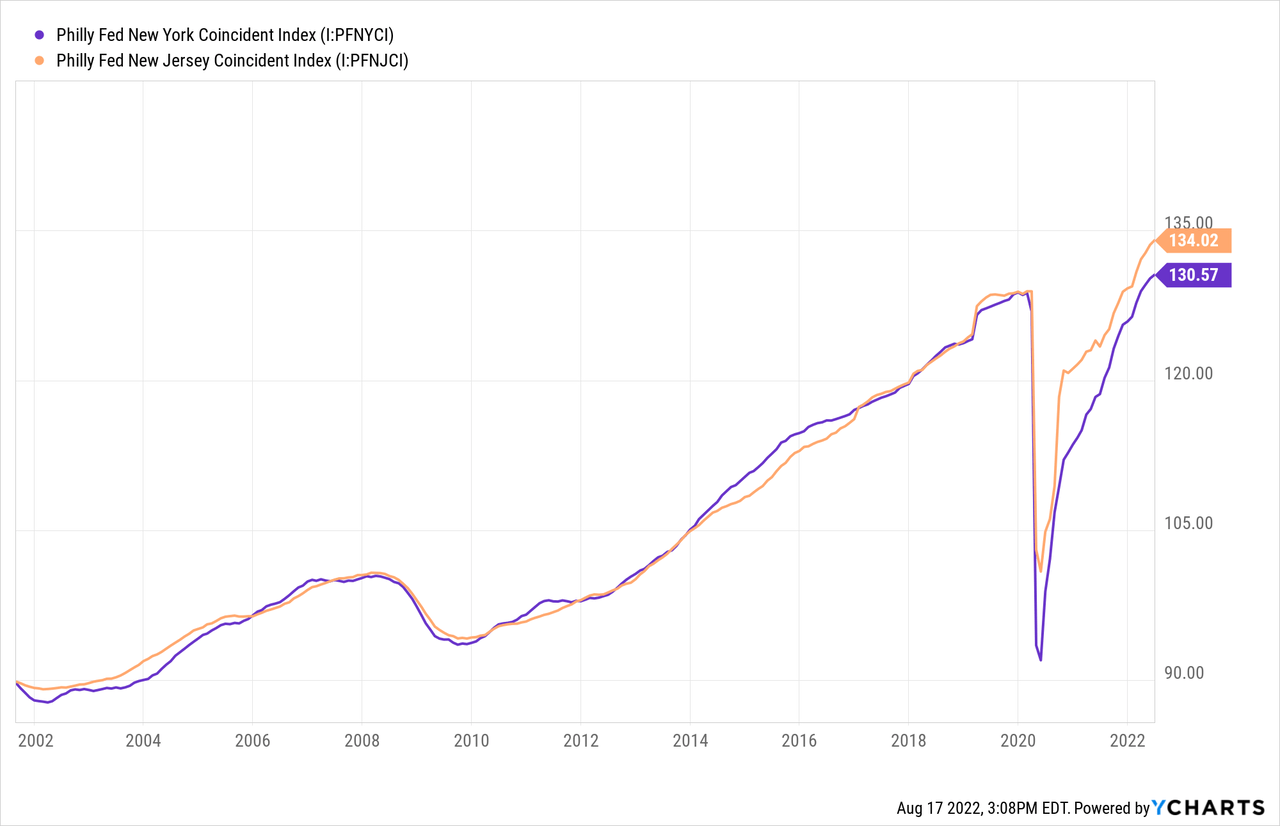
Further, regional economic factors will support loan growth. BCB Bancorp operates in New Jersey and New York, whose economies have been slowly but surely recovering. The following chart shows the coincident index for the states. Although the trend is not as steep as before, it is still positive.
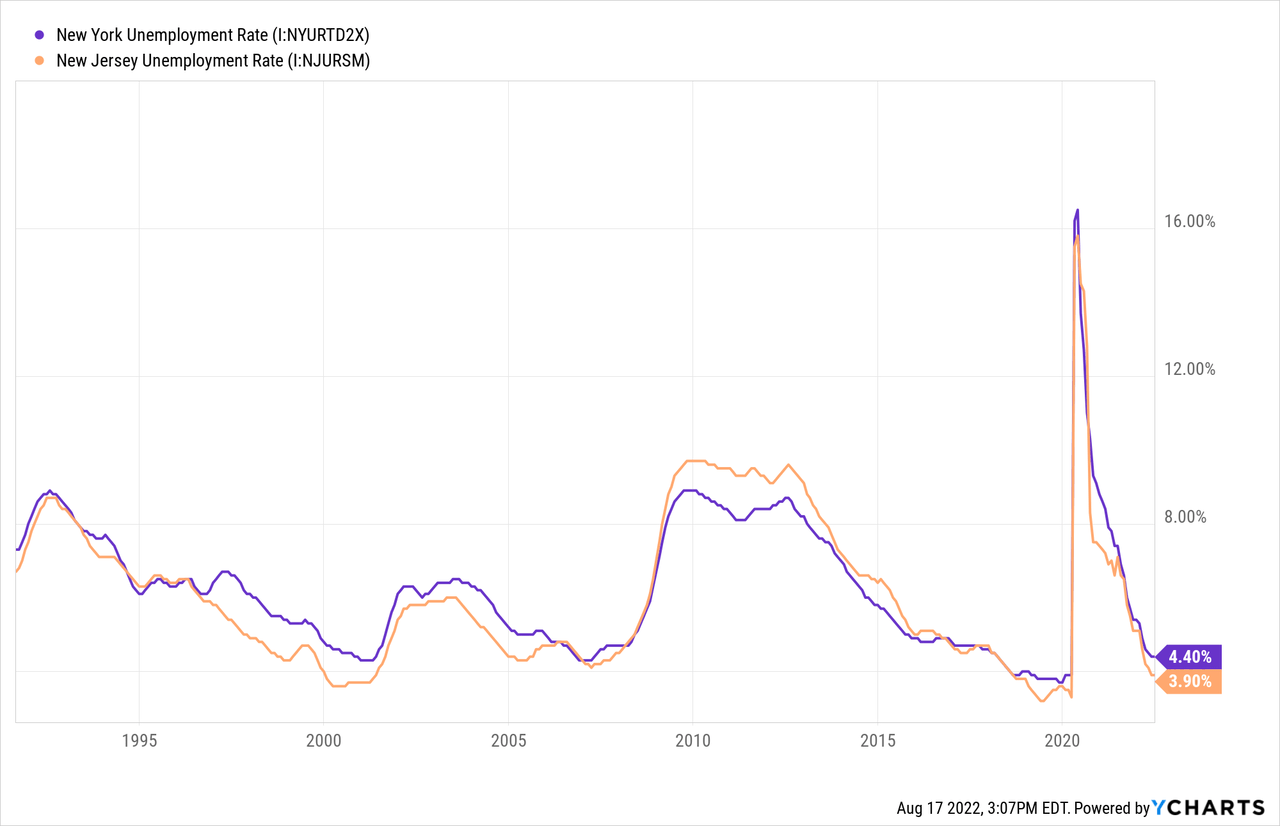
Similarly, the job market’s recovery is slower than the rest of the country but still commendable.
Considering these factors, I’m expecting the loan portfolio to increase by 2% in the second half of 2022, leading to full-year loan growth of 16.0%. Compared to my last report on BCB Bancorp, I haven’t changed my loan growth estimate for the second half of the year. However, I’ve significantly revised upward the loan growth estimate for the full year because the second quarter’s loan growth beat my expectations. For 2023, I’m expecting growth to continue at the same level as the second half of 2022. Meanwhile, I’m expecting the growth of other balance sheet items to match loan growth. The following table shows my balance sheet estimates.
| FY18 | FY19 | FY20 | FY21 | FY22E | FY23E | |
| Financial Position | ||||||
| Net Loans | 2,278 | 2,178 | 2,228 | 2,305 | 2,673 | 2,782 |
| Growth of Net Loans | 38.6% | (4.4)% | 2.3% | 3.5% | 16.0% | 4.1% |
| Other Earning Assets | 305 | 621 | 360 | 514 | 309 | 321 |
| Deposits | 2,181 | 2,362 | 2,318 | 2,561 | 2,708 | 2,818 |
| Borrowings and Sub-Debt | 282 | 296 | 243 | 122 | 140 | 145 |
| Common equity | 181 | 214 | 223 | 245 | 272 | 305 |
| Book Value Per Share ($) | 11.5 | 13.1 | 13.1 | 14.2 | 15.6 | 17.5 |
| Tangible BVPS ($) | 11.2 | 12.7 | 12.7 | 13.9 | 15.3 | 17.2 |
| Source: SEC Filings, Earnings Releases, Author’s Estimates(In USD million unless otherwise specified) | ||||||
Margin is not Very Sensitive to Rate Hikes
I don’t expect the margin to benefit much from the rising-rate environment. Firstly, around 57% of the deposit book is made up of deposits that re-price soon after every rate hike, namely interest-bearing demand, money market, and savings deposits. Therefore, the deposit beta is likely to remain somewhat high.
Moreover, BCB Bancorp’s net interest margin has actually declined during the last upward rate cycle from the fourth quarter of 2015 to the fourth quarter of 2018.
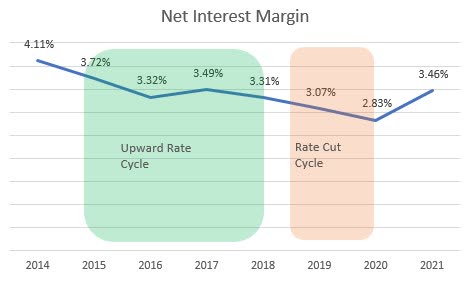
SEC Filings
Considering these factors, I’m expecting the margin to grow by 23 basis points in the second half of 2022 before stabilizing in 2023. Compared to my last report on the company, I’ve revised upward the margin estimate for 2022 because the interest rates have already risen faster and higher than I previously expected.
Expecting Earnings to Surge by 26%
The significant asset quality improvement, remarkable loan growth, and slight margin expansion will drive earnings this year. Further, the noninterest income will likely turn back to black this quarter. BCB Bancorp reported large unrealized losses on equity investments in the first half of the year, which is unlikely to be repeated in the second half. Overall, I am expecting BCB Bancorp to report earnings of $2.41 per share for 2022, up 26% year-over-year. For 2023, I’m expecting earnings to grow by 5% to $2.54 per share. The following table shows my income statement estimates.
| FY18 | FY19 | FY20 | FY21 | FY22E | FY23E | |
| Income Statement | ||||||
| Net interest income | 78 | 83 | 80 | 97 | 112 | 123 |
| Provision for loan losses | 5 | 2 | 9 | 4 | 0 | 4 |
| Non-interest income | 8 | 5 | 12 | 9 | 2 | 5 |
| Non-interest expense | 56 | 56 | 54 | 54 | 53 | 57 |
| Net income – Common Sh. | 16 | 20 | 20 | 33 | 42 | 44 |
| EPS – Diluted ($) | 1.01 | 1.20 | 1.14 | 1.92 | 2.41 | 2.54 |
| Source: SEC Filings, Earnings Releases, Author’s Estimates(In USD million unless otherwise specified) | ||||||
In my last report on BCB Bancorp, I estimated earnings of $2.22 per share for 2022. I’ve now revised upwards my earnings estimate mostly because I’ve increased both my loan growth and margin estimates. Moreover, I’ve reduced my provisioning estimate to almost zero following the first half’s outstanding performance.
Actual earnings may differ materially from estimates because of the risks and uncertainties related to inflation, and consequently the timing and magnitude of interest rate hikes. Further, a stronger or longer-than-anticipated recession can increase the provisioning for expected loan losses beyond my estimates.
Upgrading to a Buy Rating
BCB Bancorp is offering a dividend yield of 3.2% at the current quarterly dividend rate of $0.16 per share. The earnings and dividend estimates suggest a payout ratio of 25% for 2023, which is below the last four-year average of 46%. The below-average payout ratio suggests that there is room for a dividend hike. However, BCB Bancorp does not change its dividend level frequently. Therefore, I’m assuming there will be no change in the dividend level through the end of 2023.
I’m using the historical price-to-tangible book (“P/TB”) and price-to-earnings (“P/E”) multiples to value BCB Bancorp. The stock has traded at an average P/TB ratio of 1.04 in the past, as shown below.
| FY17 | FY18 | FY19 | FY20 | FY21 | Average | |
| T. Book Value per Share ($) | 13.0 | 11.2 | 12.7 | 12.7 | 13.9 | |
| Average Market Price ($) | 14.7 | 14.4 | 12.7 | 10.0 | 14.2 | |
| Historical P/TB | 1.13x | 1.29x | 1.00x | 0.79x | 1.02x | 1.04x |
| Source: Company Financials, Yahoo Finance, Author’s Estimates | ||||||
Multiplying the average P/TB multiple with the forecast tangible book value per share of $15.30 gives a target price of $16.00 for the end of 2022. This price target implies a 21.1% downside from the August 16 closing price. The following table shows the sensitivity of the target price to the P/TB ratio.
| P/TB Multiple | 0.84x | 0.94x | 1.04x | 1.14x | 1.24x |
| TBVPS – Dec 2022 ($) | 15.3 | 15.3 | 15.3 | 15.3 | 15.3 |
| Target Price ($) | 12.9 | 14.5 | 16.0 | 17.5 | 19.1 |
| Market Price ($) | 20.3 | 20.3 | 20.3 | 20.3 | 20.3 |
| Upside/(Downside) | (36.2)% | (28.7)% | (21.1)% | (13.6)% | (6.0)% |
| Source: Author’s Estimates |
The stock has traded at an average P/E ratio of around 12.2x in the past, as shown below.
| FY17 | FY18 | FY19 | FY20 | FY21 | Average | |
| Earnings per Share ($) | 0.7 | 1.01 | 1.20 | 1.14 | 1.92 | |
| Average Market Price ($) | 14.7 | 14.4 | 12.7 | 10.0 | 14.2 | |
| Historical P/E | 19.7x | 14.3x | 10.6x | 8.8x | 7.4x | 12.2x |
| Source: Company Financials, Yahoo Finance, Author’s Estimates | ||||||
Multiplying the average P/E multiple with the forecast earnings per share of $2.41 gives a target price of $29.30 for the end of 2022. This price target implies a 44.6% upside from the August 16 closing price. The following table shows the sensitivity of the target price to the P/E ratio.
| P/E Multiple | 10.2x | 11.2x | 12.2x | 13.2x | 14.2x |
| EPS 2022 ($) | 2.41 | 2.41 | 2.41 | 2.41 | 2.41 |
| Target Price ($) | 24.5 | 26.9 | 29.3 | 31.7 | 34.2 |
| Market Price ($) | 20.3 | 20.3 | 20.3 | 20.3 | 20.3 |
| Upside/(Downside) | 20.8% | 32.7% | 44.6% | 56.5% | 68.4% |
| Source: Author’s Estimates |
Equally weighting the target prices from the two valuation methods gives a combined target price of $22.70, which implies an 11.7% upside from the current market price. Adding the forward dividend yield gives a total expected return of 14.9%.
In my last report, I gave a target price of $21.5 and adopted a hold rating. I’ve now raised the target price, which suggests a higher price upside than before. Consequently, I’m upgrading BCB Bancorp to a buy rating.
Be the first to comment