


Brett_Hondow
Retail stocks might be finding their absolute and relative footings. Check out what’s happening with the SPDR S&P Retail ETF (XRT).
Ahead of a busy week of consumer company earnings, XRT has been treading water against the S&P 500 after notching a fresh 2022 low in late September. More work needs to be done by the bulls on this ETF in order to buttress a bullish retail case, though.
After naming a new CEO, is a turnaround in store for one household consumer name?
Retail Stocks Holding Steady
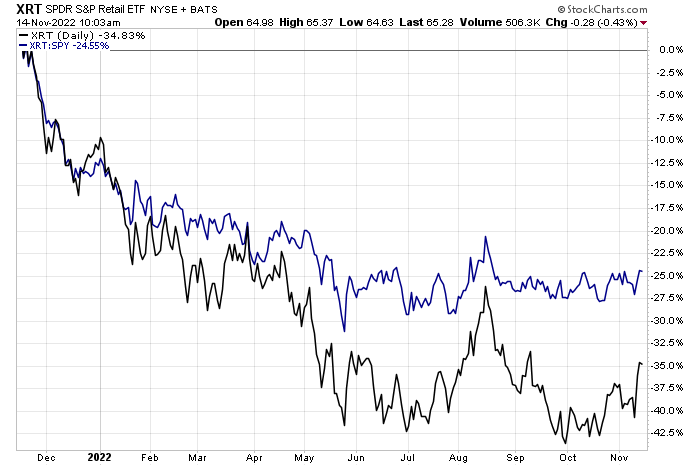
Stockcharts.com
Retail Earnings This Week
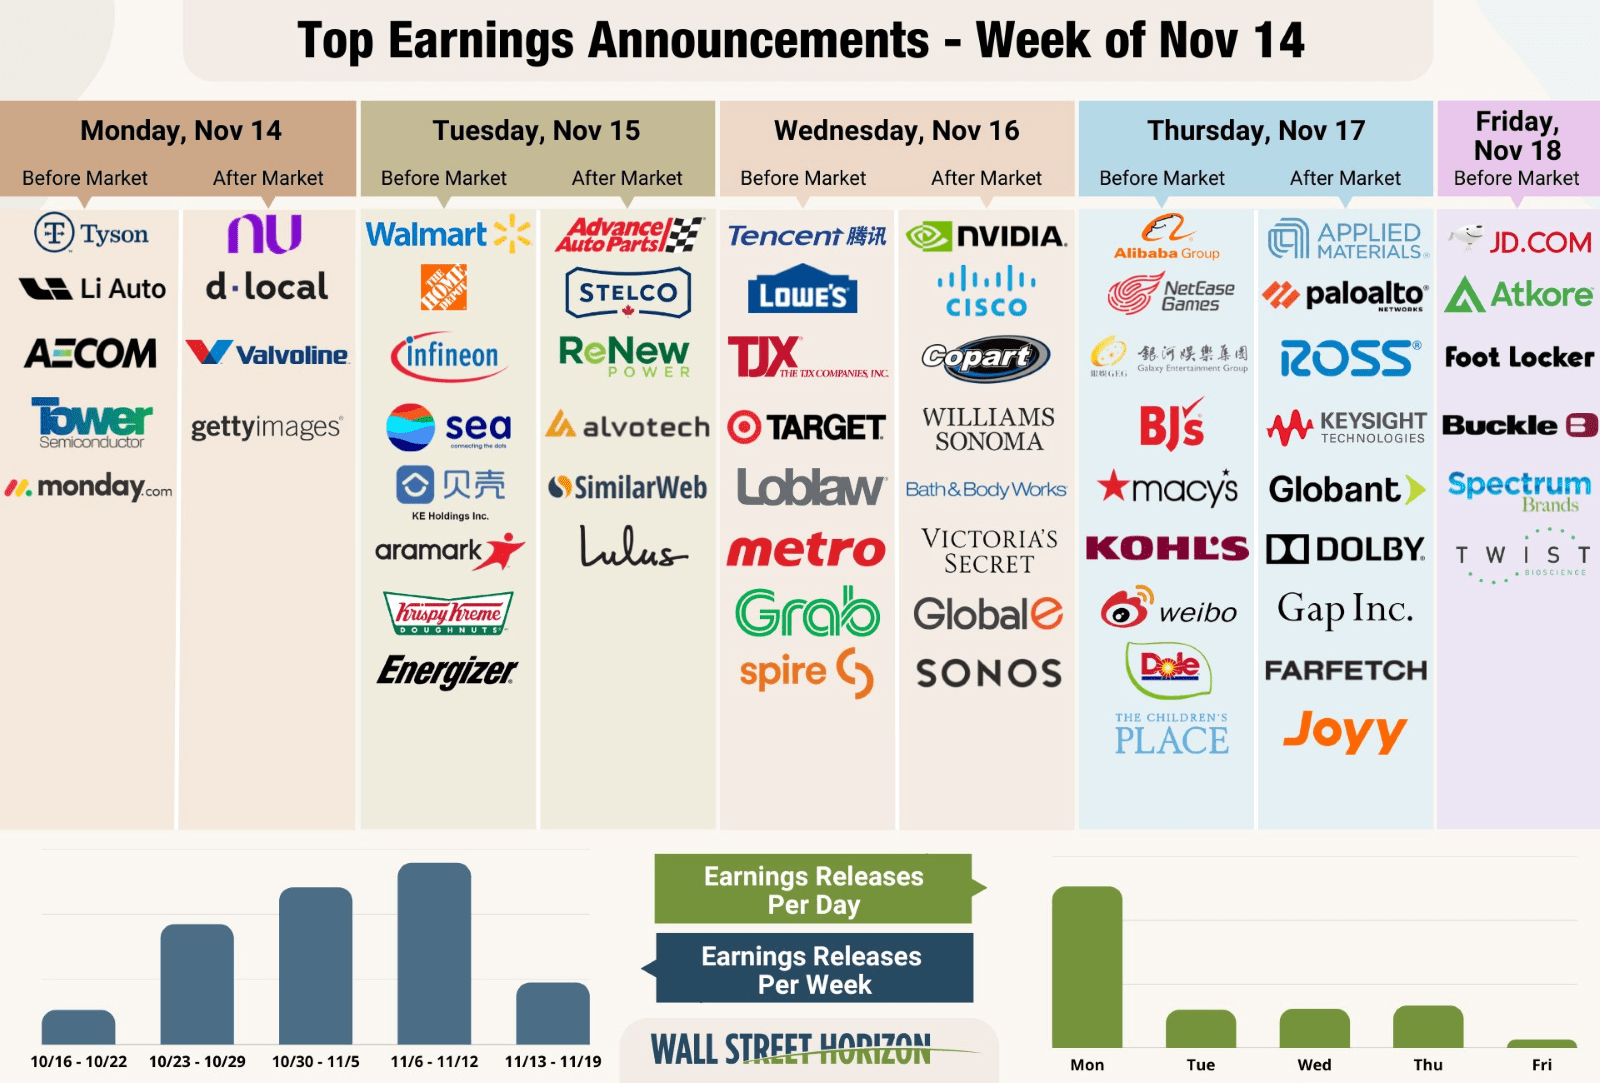
Wall Street Horizon
According to Bank of America Global Research, Bath & Body Works (NYSE:BBWI) is a retailer of personal care products. It specializes in candles, soaps, and lotions. The company distributes its products through retail stores, websites, and partner locations. Most of its operations are in the U.S., with growing Canadian and international businesses.
The Ohio-based $3.8 billion market cap Specialty Retail industry company within the Consumer Discretionary sector trades at a low 9.6 trailing 12-month GAAP price-to-earnings ratio and pays a 2.2% dividend yield, according to The Wall Street Journal. Ahead of earnings, the stock has a 7.8% short interest.
BBWI trades at a low valuation right now as retail has gotten hit hard. With strong brand loyalty, the company should be able to weather economic uncertainty in the coming quarters. Its affordable luxury position is not a bad spot to be exposed to. Still, we’ll want to monitor how margins are holding up amid higher wage costs and a consumer that is likely tightening its belt on discretionary spending.
On valuation, analysts at BofA see earnings falling hard in 2023 after a 2022 surge. The Bloomberg consensus forecast is a bit more optimistic, though. Per-share profits should then recover strongly in the following two years.
What I like about the valuation is BBWI’s solid free cash flow yield, which should allow the company to maintain its $0.80 annual dividend. Moreover, both its operating and GAAP P/Es should remain below the market’s multiple while the EV/EBTIDA ratio is low now but may grow more expensive if earnings indeed drop in the coming quarters. Overall, I like the valuation, but macro headwinds are a real risk.
BBWI: Earnings, Valuation, Free Cash Flow Forecasts
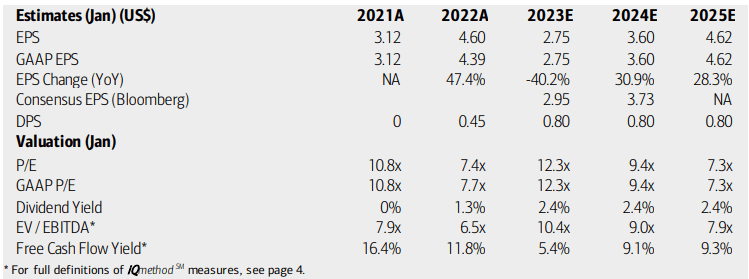
BofA Global Research
Looking ahead, data from Wall Street Horizon show a confirmed Q3 earnings date of Wednesday, Nov. 16 after market close with a conference call Thursday morning. You can listen live here. There’s also a dividend ex-date on Thursday.
Corporate Event Calendar
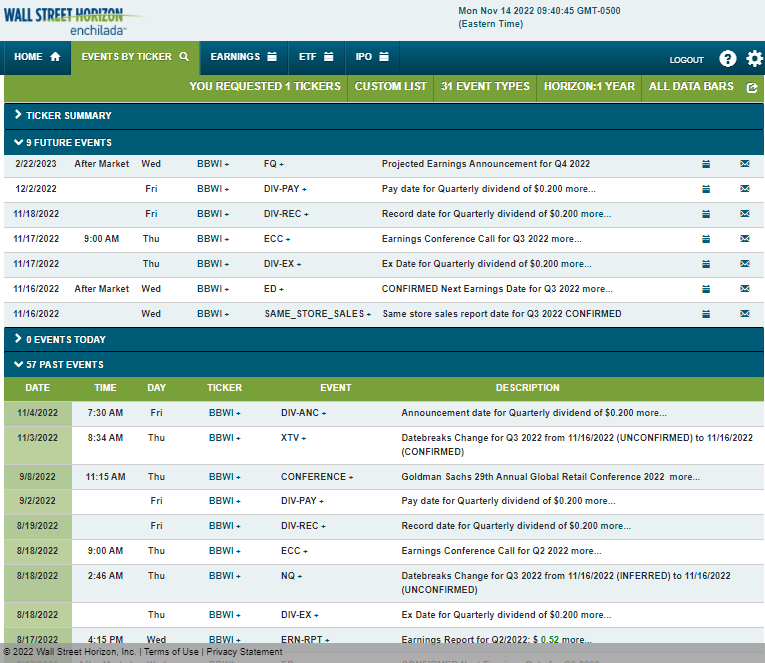
Wall Street Horizon
The Options Angle
Digging into the earnings report, data from Option Research & Technology Services (ORATS) show a consensus EPS forecast of $0.20 which would be a sharp decline from $0.92 of per-share profits reported in the same quarter a year ago.
Meanwhile, traders expect a 9.0% earnings-related stock price swing using the nearest-expiring at-the-money straddle. Shares has traded higher post-earnings in 10 of the past 12 periods, a remarkably bullish trend. The 9% implied move is high versus the last handful of reactions, so I’m inclined to fade those options prices by being a net seller of premium.
BBWI: Expensive Options, But A Strong Post-Earnings Stock Price Reaction History
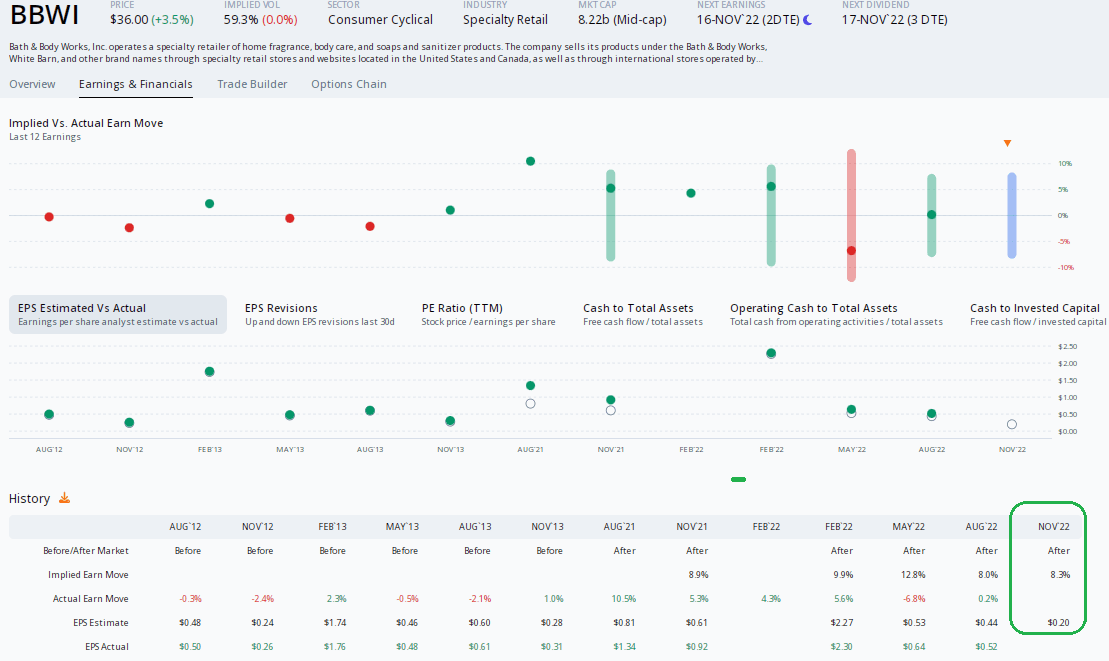
ORATS
The Technical Take
With a decent valuation and expensive options, how does the chart look? Once again, it’s a mixed bag here. BBWI has clear resistance in the $42 to $44 range, but that is significantly above the current price. I see support near $31. While stuck in a range, the RSI indicator at the top of the chart is on the move higher, so bullish momentum appears underway. Shares could find some sellers at its falling 200-day moving average currently near $41. Finally, there is a downtrend resistance line that comes into play here.
Overall, I would avoid the stock – particularly if it breaks below $31. A jump above the downtrend line could spark a bullish move to near $41.
BBWI: A Broad Downtrend With Key Levels To Watch
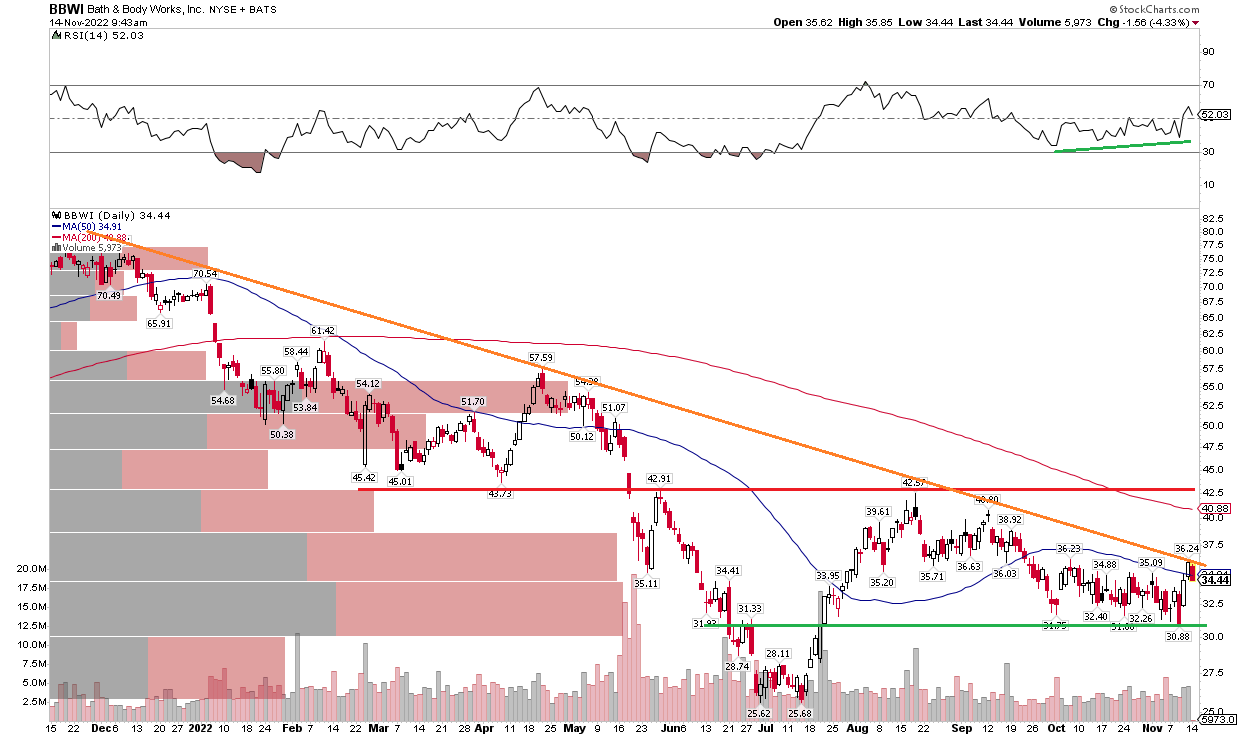
Stockcharts.com
The Bottom Line
BBWI has pros and cons, but I lean bearish. I think the value case is compelling, but there are too many macro/consumer headwinds in the near term that could weigh on shares. Also, the technical assessment is mixed while its broader trend appears lower.
Be the first to comment