

plastic_buddha/E+ via Getty Images
Price Action Thesis
We present our price action analysis on Barrick Gold (NYSE:GOLD), given its steep fall in price from its March bull trap (down 25%). We believe most of the selling pressure has likely abated, as the stock seems to be consolidating at its 200-week moving average.
However, a lack of bear trap price action indicates that the market could force another round of rapid liquidation before reversing its bearish bias. Also, we noted a near-term resistance could help stymie its near-term recovery, which is just about 7% away from its last close (June 21).
Our reverse cash flow valuation analysis indicates that long-term investors should be patient and await a better entry level. However, we also think that position and swing traders can continue to trade GOLD astutely, given its “tendencies” to create bull/bear traps over time.
Accordingly, we now rate GOLD as a Hold as we await a possible re-test of its near-term resistance or support. We will reassess our rating if we observe significant changes to its price action moving forward.
Trade GOLD, But Don’t Hold On To It
GOLD price chart (monthly) (TradingView)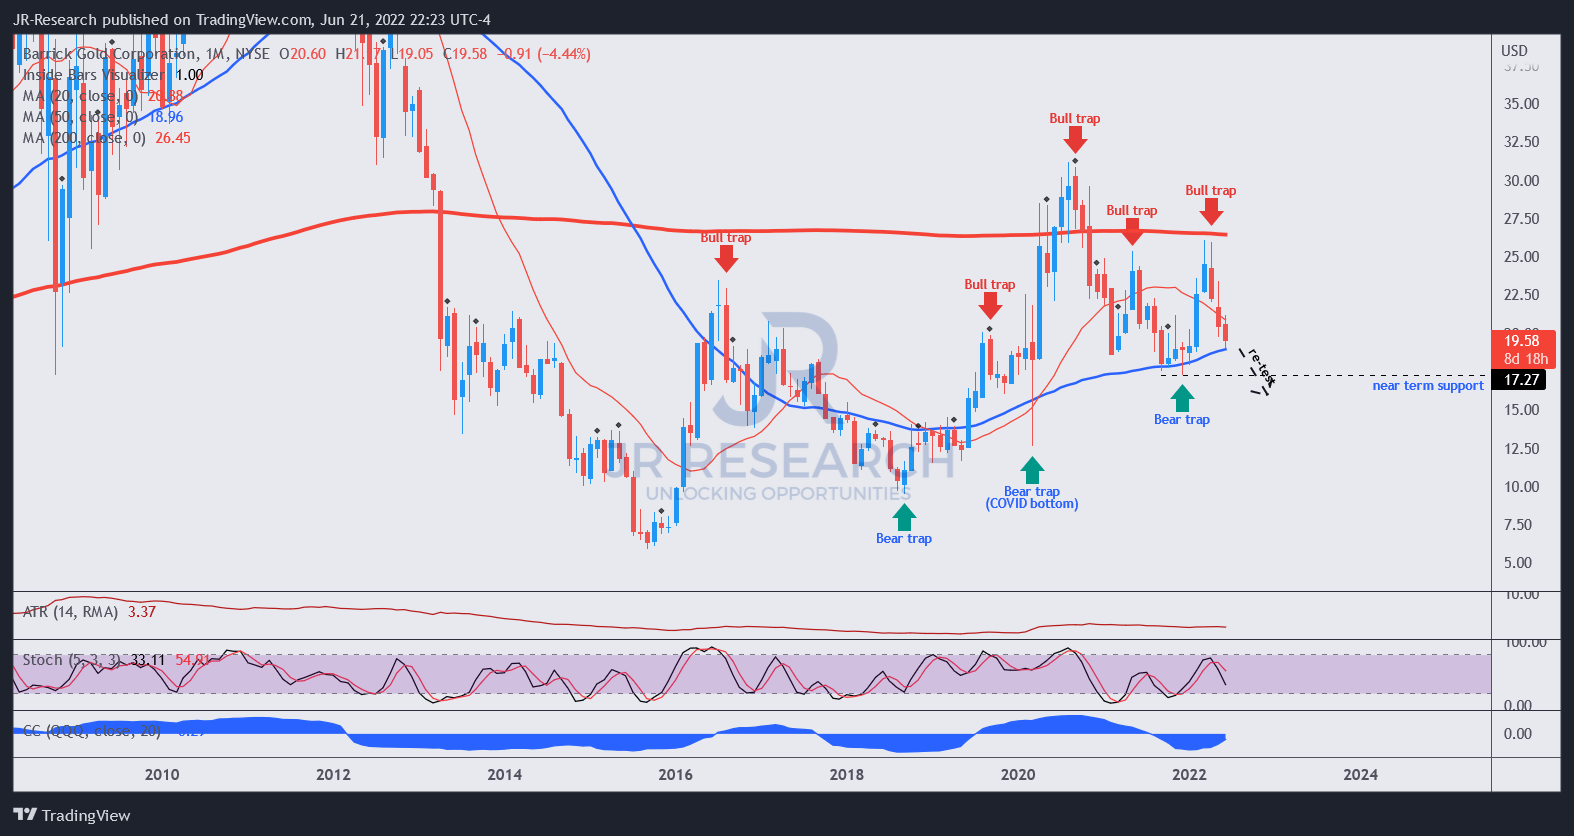
A cursory glance over GOLD’s long-term chart unveils several opportunities for nimble short/long investors or traders to capitalize on its bull/bear traps over the years. Therefore, we do not encourage investors to hang onto the bag on GOLD over time. Instead, investors should watch its price action and use those traps to execute their set-ups (long/short) accordingly.
Notably, GOLD has managed to reclaim its long-term upward bias relatively successfully. However, a series of lower-high bull traps have continued to impede its recovery.
We also note a potential re-test of its near-term support, held by a validated bear trap from December 2021 ($17.27 level).
GOLD price chart (weekly) (TradingView)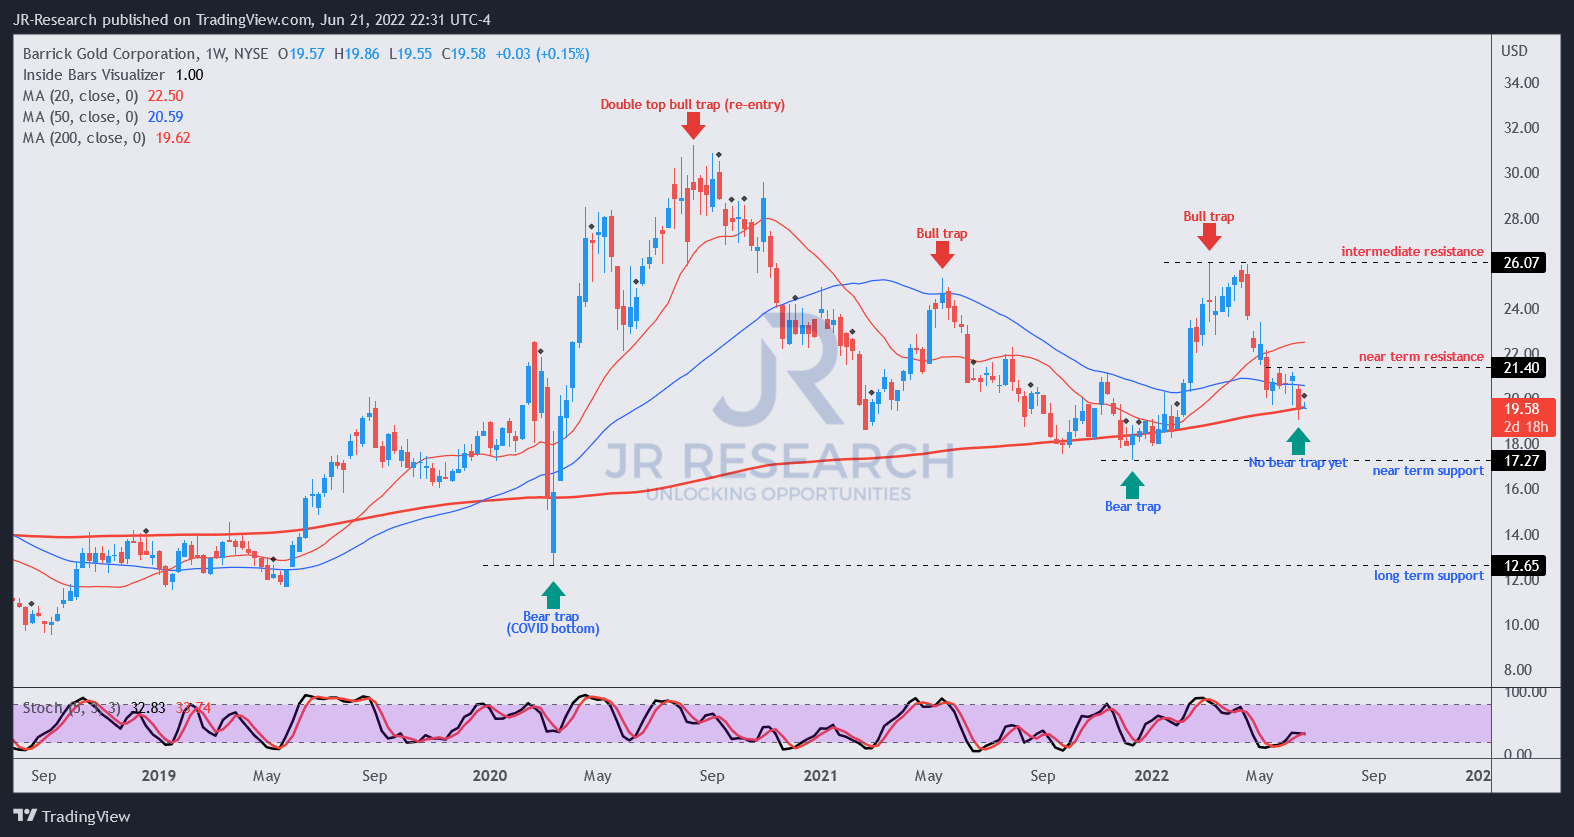
Moving closer to its weekly chart, we can observe these traps more clearly. Notably, investors should observe the double top bull trap from August 2020 that sent GOLD into negative flow until December 2021. Therefore, investors are reminded to watch for double tops and respect their early warning signals of a potentially significant trend reversal.
However, a validated bear trap in December 2021 helped reverse its bearish bias. Notwithstanding that trap has been resolved with another bull trap in March 2022, which subsequently sent GOLD tumbling 25% to its current levels.
We have not observed a bear trap price action trigger to indicate a sustained bottom. Also, as seen above, there’s a near-term resistance, which could hinder its near-term recovery momentum.
As a result, we believe the price action signals are uncertain for now.
Long-Term Investors Should Be Patient
Investing in GOLD for long-term investors has been a story of hits and misses. However, the significant bear trap from its 2020 COVID bottom helped investors notch a 3Y CAGR of 12%, outperforming the SPDR S&P 500 ETF’s (SPY) 9% CAGR. It also outperformed the iShares Global Gold Miners ETF’s (RING) 3Y CAGR of 9.11%.
However, investors who held GOLD over the last five years underperformed significantly, as GOLD posted a 5Y CAGR of 4.51%. Therefore, we believe investors should consider being more nimble with their positions and trade those bull/bear traps, going short/long, respectively.
| Stock | GOLD |
| Current market cap | $34.27B |
| Hurdle rate (CAGR) | 10% |
| Projection through | CQ2’26 |
| Required FCF yield in CQ2’26 | 6% |
| Assumed TTM FCF margin in CQ2’26 | 21% |
| Implied TTM revenue by CQ2’26 | $14.34B |
GOLD stock reverse cash flow valuation model. Data source: S&P Cap IQ, author
But, let’s say that some investors still intend to hold the stock without the “hassle” of going through active portfolio management with GOLD. That’s fine.
However, we believe they need to be more circumspect with their valuation analysis so that they can buy the stock at prices that help GOLD outperform.
Our reverse cash flow model indicates that GOLD could disappoint at the current levels for long-term investors. Using a hurdle rate of 10% (lower than its 3Y CAGR of 12%), we require Barrick Gold to deliver a TTM revenue of $14.34B by CQ2’26.
The consensus estimates are modeling relatively anemic growth in its topline, suggesting that Barrick Gold would likely miss our revenue target.
However, if we reduce our entry price to $17.50 (close to its near-term support in our charts), Barrick Gold needs to post a TTM revenue of $13.03B by CQ2’26. That’s much closer to the Street’s consensus. As a result, it can help investors maintain at least a 10% hurdle rate or higher (depending on the market’s expectations of its forward FCF yields).
So, long-term investors are encouraged to be patient with GOLD stock. Let it come to you. If it doesn’t come to you, move on to other opportunities.
Is GOLD Stock A Buy, Sell, Or Hold?
We rate GOLD as a Hold for now. We have not observed a significant bear trap that could sustain a bottom and reverse its bearish momentum. However, we will reassess our rating if there are significant price action developments.
Our valuation analysis indicates that long-term investors should continue to be patient with GOLD stock.
Be the first to comment