

Ceri Breeze/iStock Editorial via Getty Images
Bar Harbor Bankshares’ (NYSE:BHB) topline will benefit from economic factors, including strength in the regional job market and higher interest rates. On the other hand, earnings will suffer from the impact of higher interest rates on credit quality and consequently the net provision expense. Overall, I’m expecting the company to report earnings of $2.71 per share, up 4% year-over-year. The year-end target price suggests a high upside from the current market price. As a result, I’m adopting a buy rating on Bar Harbor Bankshares.
Loan Growth to Decelerate to a Normal Level
After two years of declines, the loan portfolio surged by a remarkable 4.9% in the first quarter of 2022, or 19.5% annualized. This growth was unsustainably high; therefore, it is unlikely to be repeated. However, loans will likely continue to grow at a lower rate that is closer to a normal level. The economic activity appears to be back at the pre-pandemic level, which will likely drive the loan growth normalization.
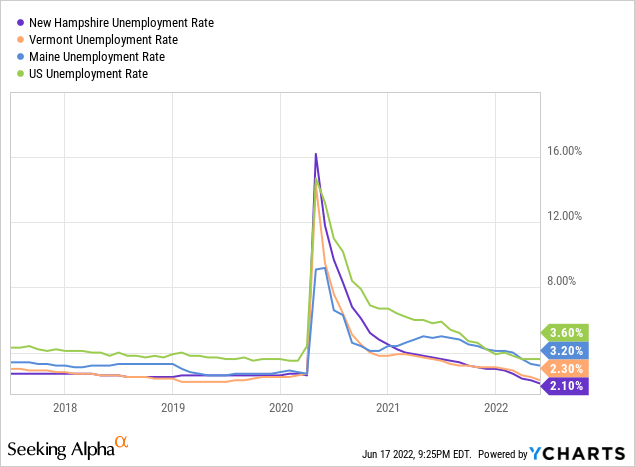
Bar Harbor Bankshares operates in Maine, New Hampshire, and Vermont. All three states have very low unemployment rates which bode well for the growth of the loan portfolio, especially residential mortgages for new homes.
Considering the state of the regional economy, I’m expecting loan growth of 4% (annualized) in the last nine months of 2022. Due to the strong performance in the first quarter of the year, the full-year loan growth will likely be around 8% for 2022. Meanwhile, other balance sheet items will likely grow in line with loans for the remainder of the year. The following table shows my balance sheet estimates.
| FY17 | FY18 | FY19 | FY20 | FY21 | FY22E | |
| Financial Position | ||||||
| Net Loans | 2,473 | 2,476 | 2,626 | 2,544 | 2,509 | 2,711 |
| Growth of Net Loans | 121.1% | 0.1% | 6.0% | (3.1)% | (1.4)% | 8.0% |
| Other Earning Assets | 717 | 761 | 704 | 822 | 848 | 707 |
| Deposits | 2,352 | 2,483 | 2,696 | 2,906 | 3,049 | 3,140 |
| Borrowings and Sub-Debt | 830 | 724 | 531 | 336 | 179 | 184 |
| Common equity | 355 | 371 | 396 | 407 | 424 | 427 |
| Book Value per Share ($) | 23.2 | 23.8 | 25.4 | 26.7 | 28.2 | 28.3 |
| Tangible BVPS ($) | 23.2 | 23.8 | 17.3 | 18.3 | 19.8 | 19.9 |
|
Source: SEC Filings, Author’s Estimates (In USD million unless otherwise specified) |
Benefits of Rate Hikes to Come with a Lag
Bar Harbor Bankshares mostly concentrates on real estate loans, including residential and commercial real estate, which made up 81% of total loans at the end of March 2022. Due to the real estate-heavy loan portfolio, the impact of higher interest rates on interest income will be felt with a lag.
Unfortunately, unlike the loan portfolio, a majority of the deposit book will re-price soon after every rate hike. This is because money market, savings, and NOW (negotiable order of withdrawal) deposits altogether made up 66% of total deposits at the end of March 2022, as mentioned in the annual shareholder meeting presentation.
The management’s interest-rate sensitivity analysis given in the 10-Q filing shows that a 200-basis points increase in the interest rate could boost net interest income by 6.6% in the first twelve months of a rate hike. In the second year of the rate hike, the net interest income could jump by a whopping 16.4% mostly because of the lagged impact on the loan portfolio.
I’m expecting the fed funds rate to increase by a further 175 basis points in the remainder of this year to close the year at 3.5% (upper limit). Considering my interest rate outlook and the expected repricing of loans and deposits, I’m expecting the net interest margin to increase by 34 basis points in the last nine months of 2022 from 2.95% in the first quarter of the year.
Higher Interest Rates Threaten Credit Quality
Thanks to the improvement in the asset quality, Bar Harbor Bankshares’ allowance coverage has improved substantially over the last year. The allowances-to-nonaccrual loan ratio rose to 252% at the end of March 2022 from 168% at the end of the same period last year.
Nevertheless, the coverage is not excessive enough to warrant any significant reserve releases given the economic environment. The current high rate environment calls for discretion and disallows big reserve releases. The last time the federal funds rate was as high as it is now, the delinquency rate on all loans for the banking industry was at least 50 basis points higher than the current levels. The following table shows the trend of the delinquency rate (source: St. Louis Fed) and the effective fed funds rate.
St. Louis Fed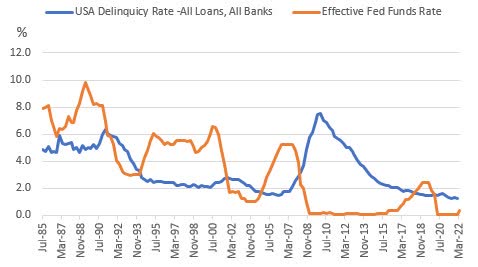
The anticipated loan additions mentioned above will likely require a normal level of provisioning for expected loan losses. For now, I’m expecting the provision expense, net of reversals, to remain at a normal level. However, if interest rates rise faster and greater than expected, then I may revise my estimates in the coming months. Overall, I’m expecting the net provision expense to make up 0.10% of total loans in 2022, which is the same as the average for the last five years.
Expecting Earnings to Grow by 4%
The anticipated loan growth and margin expansion will lift the top line, and consequently earnings, this year. On the other hand, provision normalization will likely drag earnings on a year-over-year basis. Further, non-interest income will be lower because of a reduction in income from mortgage refinancing activity. Overall, I’m expecting Bar Harbor Bankshares to report earnings of $2.71 per share for 2022, up by just 4% year-over-year. The following table shows my income statement estimates.
| FY17 | FY18 | FY19 | FY20 | FY21 | FY22E | |
| Financial Summary | ||||||
| Net interest income | 92 | 91 | 90 | 99 | 96 | 104 |
| Provision for loan losses | 3 | 3 | 2 | 6 | (1) | 3 |
| Non-interest income | 26 | 28 | 29 | 43 | 42 | 38 |
| Non-interest expense | 73 | 76 | 90 | 95 | 91 | 89 |
| Net income – Common Sh. | 26 | 33 | 23 | 33 | 39 | 41 |
| EPS – Diluted ($) | 1.70 | 2.12 | 1.45 | 2.18 | 2.61 | 2.71 |
|
Source: SEC Filings, Author’s Estimates (In USD million unless otherwise specified) |
Actual earnings may differ materially from estimates because of the risks and uncertainties related to inflation, and consequently the timing and magnitude of interest rate hikes. Further, the threat of a recession can increase the provisioning for expected loan losses.
High Price Upside, Good Dividend Yield
Bar Harbor Bankshares is offering a high dividend yield of 4.1% at the current quarterly dividend rate of $0.26 per share. The earnings and dividend estimates suggest a payout ratio of 37.6% for 2022, which is below the five-year average of 43%. Therefore, there is room for a rate hike. However, I have not incorporated a dividend hike in my investment thesis because Bar Harbor has already raised its dividend in the second quarter. Another dividend hike so soon is unlikely.
I’m using the historical price-to-tangible book (“P/TB”) and price-to-earnings (“P/E”) multiples to value Bar Harbor Bankshares. The stock has traded at an average P/TB ratio of 1.28 in the past, as shown below.
| FY17 | FY18 | FY19 | FY20 | FY21 | Average | |
| Tangible BVPS ($) | 23.2 | 23.8 | 17.3 | 18.3 | 19.8 | |
| Average Market Price ($) | 29.3 | 28.1 | 24.9 | 20.2 | 27.7 | |
| Historical P/TB | 1.26x | 1.18x | 1.44x | 1.10x | 1.40x | 1.28x |
| Source: Company Financials, Yahoo Finance, Author’s Estimates | ||||||
Multiplying the average P/TB multiple with the forecast tangible book value per share of $19.9 gives a target price of $25.5 for the end of 2022. This price target implies a 3.1% upside from the June 17 closing price. The following table shows the sensitivity of the target price to the P/TB ratio.
| P/TB Multiple | 1.08x | 1.18x | 1.28x | 1.38x | 1.48x |
| TBVPS – Dec 2022 ($) | 19.9 | 19.9 | 19.9 | 19.9 | 19.9 |
| Target Price ($) | 21.5 | 23.5 | 25.5 | 27.4 | 29.4 |
| Market Price ($) | 24.7 | 24.7 | 24.7 | 24.7 | 24.7 |
| Upside/(Downside) | (13.1)% | (5.0)% | 3.1% | 11.1% | 19.2% |
| Source: Author’s Estimates |
The stock has traded at an average P/E ratio of around 13.5x in the past, as shown below.
| FY17 | FY18 | FY19 | FY20 | FY21 | Average | |
| Earnings per Share ($) | 1.70 | 2.12 | 1.45 | 2.18 | 2.61 | |
| Average Market Price ($) | 29.3 | 28.1 | 24.9 | 20.2 | 27.7 | |
| Historical P/E | 17.2x | 13.3x | 17.1x | 9.3x | 10.6x | 13.5x |
| Source: Company Financials, Yahoo Finance, Author’s Estimates | ||||||
Multiplying the average P/E multiple with the forecast earnings per share of $2.71 gives a target price of $36.6 for the end of 2022. This price target implies a 48.2% upside from the June 17 closing price. The following table shows the sensitivity of the target price to the P/E ratio.
| P/E Multiple | 11.5x | 12.5x | 13.5x | 14.5x | 15.5x |
| EPS 2022 ($) | 2.71 | 2.71 | 2.71 | 2.71 | 2.71 |
| Target Price ($) | 31.2 | 33.9 | 36.6 | 39.3 | 42.0 |
| Market Price ($) | 24.7 | 24.7 | 24.7 | 24.7 | 24.7 |
| Upside/(Downside) | 26.2% | 37.2% | 48.2% | 59.2% | 70.1% |
| Source: Author’s Estimates |
Equally weighting the target prices from the two valuation methods gives a combined target price of $31.0, which implies a 25.6% upside from the current market price. Adding the forward dividend yield gives a total expected return of 29.8%. Hence, I’m adopting a buy rating on Bar Harbor Bankshares.
Be the first to comment