


JHVEPhoto
Last week, the Bank of Canada (BoC) surprised investors by hiking its policy rate by a whopping full percentage point. At 2.5%, our friends north of the border now have a more restrictive interest rate policy versus the U.S. FOMC. Of course, the gap will collapse later this month when the Fed raises the Federal Funds rate by at least 0.75 percentage points on July 27.
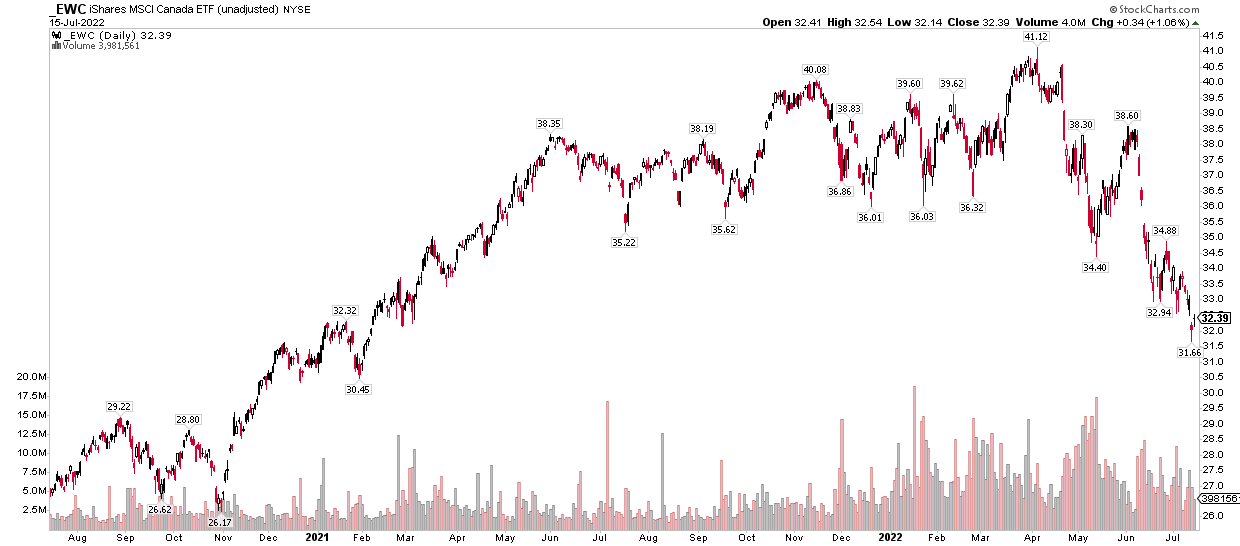
Unfortunately, Canadian stocks, as measured by the iShares MSCI Canada ETF (EWC) settled at a fresh 17-monthly low (on a weekly closing basis) on Friday. EWC is currently in a bear market, down more than 21% from its April all-time high. Canada had been an impressive area of relative strength during the first half of the year as many resource stocks, which are domiciled in the country, surged. That bullish trend quickly turned bearish as commodity prices collapsed and rates rose.
Canada: From All-Time High to Bear Market
StockCharts
Turning to Canadian banks, according to BofA Global Research, Bank of Montreal (NYSE:BMO) is the fourth largest Canadian bank by market cap and offers a wide array of financial services offerings across Canada and in the U.S. Midwest. BMO is more concentrated on commercial lending than its Canadian peers, with large C&I books in both Canada and the U.S. Recently, BMO has taken action to drive greater efficiency within Canadian banking, per BofA analysts. BMO should benefit from higher rates and still solid loan demand.
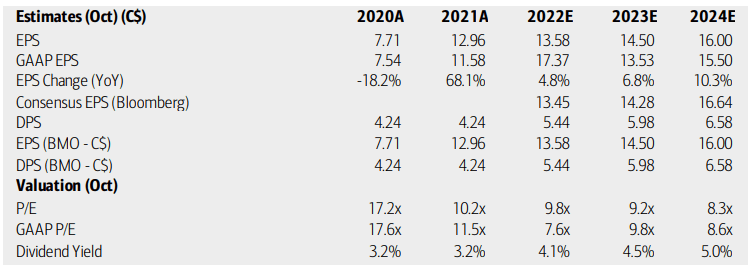
Earnings growth is forecast to accelerate through 2024 according to both BofA and the Bloomberg consensus estimate. Its price-to-earnings ratio appears attractive, and BMO sports a yield well above that of the typical S&P 500 stock.
BMO Earnings, Valuation, Dividend Yield Forecasts
BofA Global Research
BMO’s price-to-book ratio is also more attractive these days. It has fallen below the 10-year average—currently at just 1.3x. Buyers have stepped in around 1.2x book over the last decade aside from the plunge seen around the Covid crash.
BMO Price-to-Book Ratio: Below the 10-Year Median

Koyfin Charts
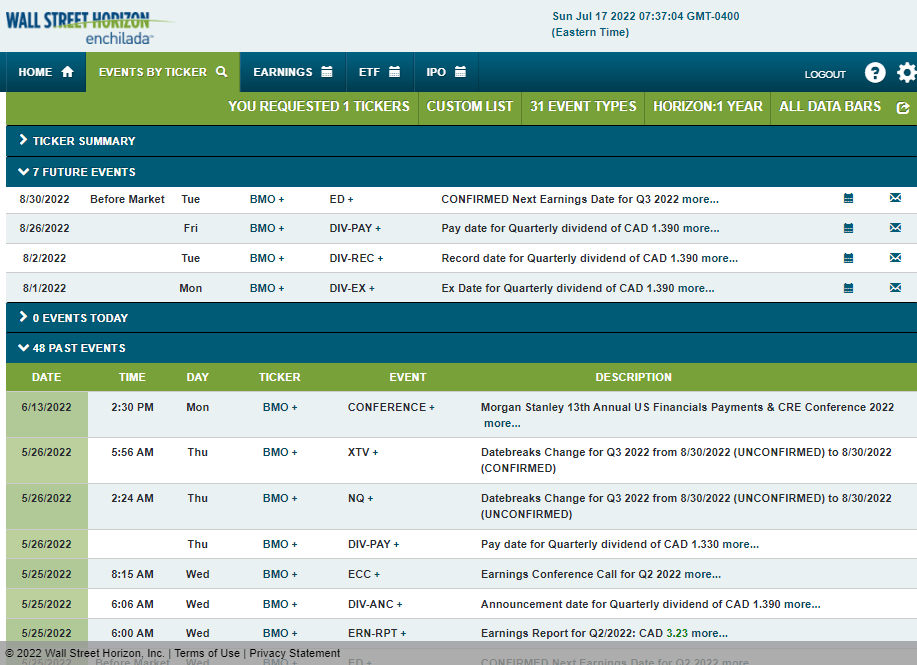
Looking ahead, we will not get an earnings update until the end of August, according to Wall Street Horizon’s corporate event data.
BMO Corporate Event Calendar: Earnings Aug 30
Wall Street Horizon
The Technical Take
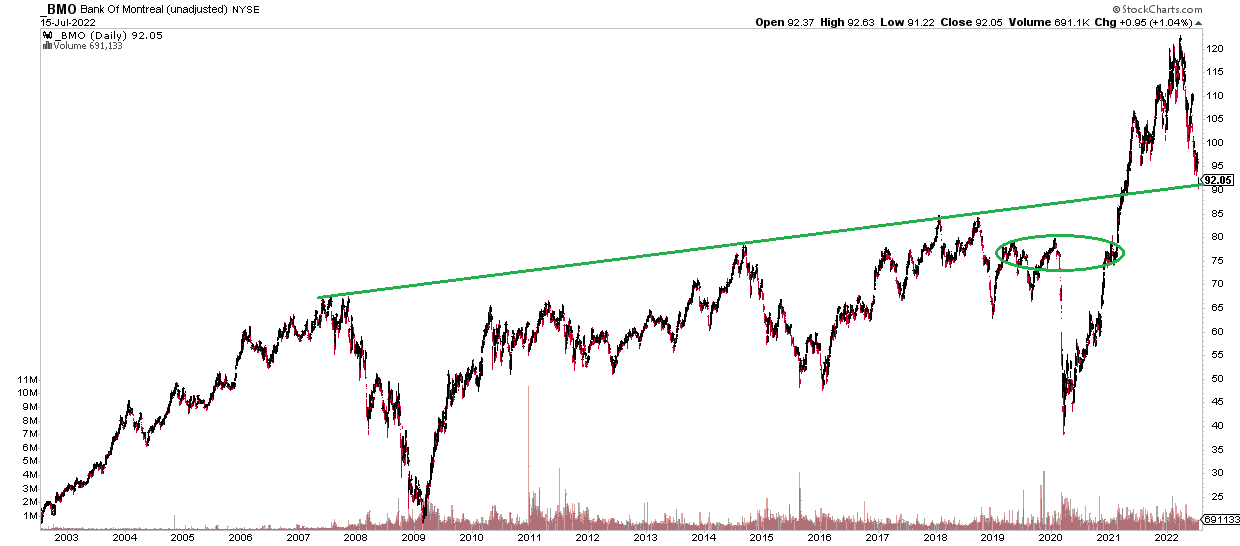
I like what I see with the valuation and forecast earnings growth with BMO. And its dividend yield is a nice bonus. But what does the technical picture tell? I see interesting support right now based on a long-term upward trendline. Normally I don’t like to put too much emphasis on trendlines (that are upward or downward sloping) as I prefer horizontal lines since they better illustrate battleground areas between bulls and bears.
In BMO’s case, however, I could not help but notice how potentially pivotal the current uptrend line is with respect to the latest share price. There’s a further area of support from back during Covid in the $75 to $80 range. While the stock is in a 25% drawdown, I think there could be a bounce here. The upside could be capped in the $98 to $100 area based on that being support last December and in May before becoming resistance in June and July.
BMO: Long-Term Support In Play, Watch $75-$80
StockCharts
Near-Term Resistance: $98-$100
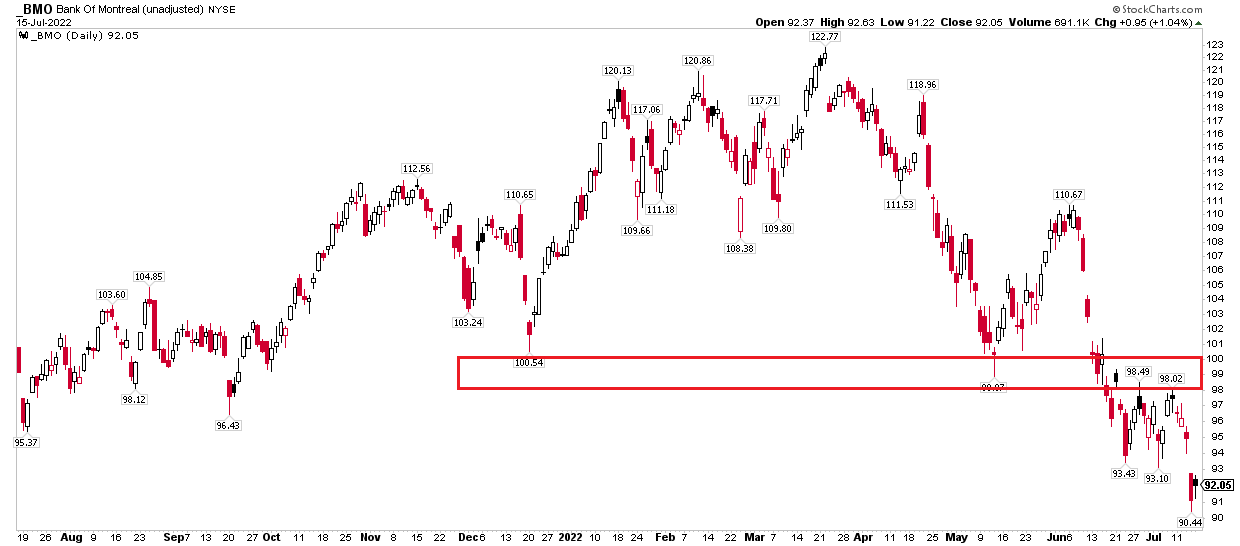
StockCharts
The Bottom Line
BMO looks good from a valuation perspective, and I see shares bouncing a bit, but gains might be capped. Long-term, $75 to $80 appears to be a great area to hold shares with a longer-term outlook.
Be the first to comment