

Canada’s Situation
For those of us in the U.S., it’s natural to lose sight of how our economic and population data compares to other countries. It’s important to regain focus when we evaluate global dividend stocks that have a strong presence in or are domiciled in a foreign country.
All five of Canada’s “Big Five” Banks concentrate their operations in Canada but have systematically and methodically expanded outside of their home market. Most have stayed close to home, but others, like Scotiabank (NYSE:BNS), have traveled much farther. Let’s discuss why that’s necessary for Canada’s “Big Five.”
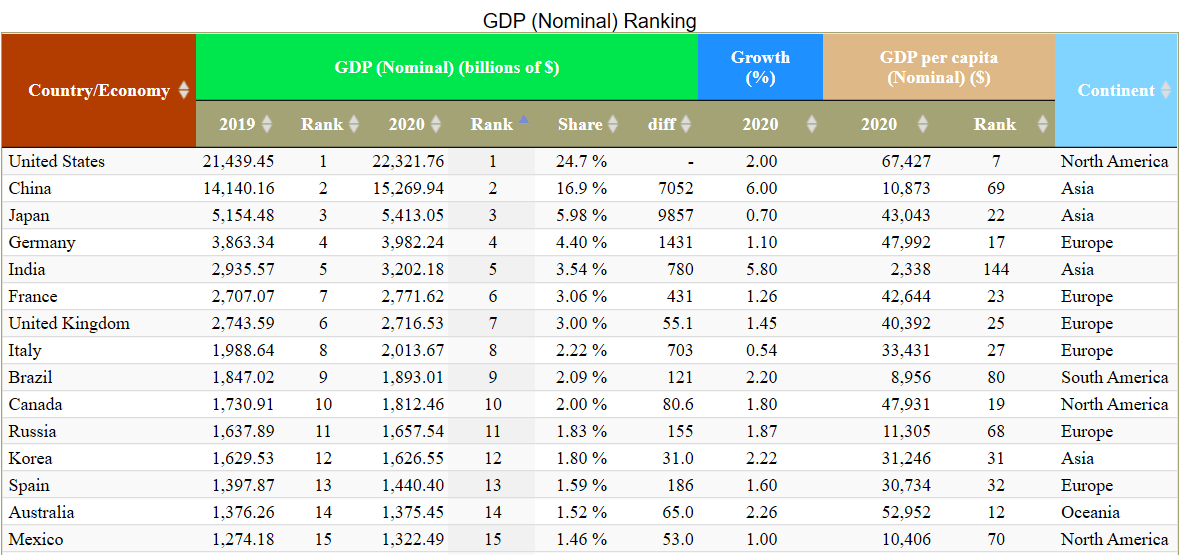
Canada’s most recent GDP figures put it at 10th globally, an impressive feat, given its population of 37.6 million. It’s a sophisticated economy with above-average per capita levels of education and wealth. Canada’s immigration policy is quite different than most other nations in that it hand-selects most who enter the country, and there is minimal illegal immigration. Mandates on job creation and or tax payments are often involved. That said, the country’s ability and willingness to grow its labor force through “tactical” immigration have potentially benefited the country economically. For context, the 38 million residing in Canada is considerably less than the number of people who call California home. As we alluded to previously, however, that state’s rank is fifth globally in GDP if it was its own nation. Being smaller than California by population or economy doesn’t mean much. California’s GDP is greater than the U.K., Italy, or France, and many times that of Russia’s economy. Given all the headlines about Russia and the U.S. conflicts, a nation of California’s size economically wouldn’t likely consider Russia a major threat outside of the nuclear option.
Canada’s economy is comparable to Texas, another energy heavyweight. In 2019, the U.S. produced more oil and natural gas than any other country. Texas alone represented 40% and 25% of the nation’s oil and gas production, respectively, and the state’s Permian Basin outproduced Saudi Arabia’s famed Ghawar field that year. Comparing Canada’s economy to Texas is a testament to how relevant our northern neighbor is on the global stage.
Despite Canada’s success, the Big Five have outgrown their home market, though the majority of their operations and business remain there. Scotiabank is well-known in the investment community for its foray into Latin America, while the remaining members of the Big Five have entered the U.S. market with varying levels of enthusiasm and commitment. Now that we have a good grasp on Canada and its standing within the world’s economy, we’ll move to Bank of Montreal (NYSE:BMO).
Track Record Matters – But Isn’t Absolute
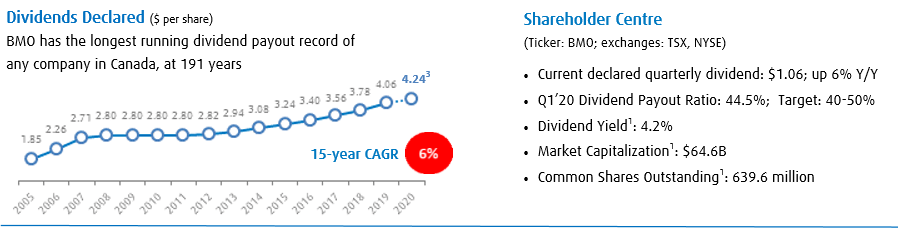
Source: Corporate Fact Sheet
Bank of Montreal has paid dividends, without interruption, for over 191 years. Given none of us are presumably half that age, we’ll add context. In June 26, 1830, King George IV of England died and William IV ascended to the throne. This occurred a year after BMO’s dividend track record begins. BMO started paying consistent dividends before the Mormon religion existed (1830), The Treaty of Constantinople was signed (1832), the Battle of the Alamo occurred between the nations of Texas and Mexico (1836), and well before Florida (1845) or California (1850) become states.
BMO had paid dividends for over 80 years before the Austrian Archduke Francis Ferdinand was assassinated leading toward World War I. The bank was over 100 years into its uninterrupted dividend payment history prior to Germany’s invasion of Poland in 1939. Without increases, a consistent dividend is only worth so much. In BMO’s case, it increased its distribution by 6% annually for the last 15 years, which includes the Great Recession.
We’ve all heard the adage past performance is not indicative of future results. Most sayings that have passed the test of time have merit even if we don’t like to admit it. The more accurate but less succinct version of this idea is: past performance is not indicative of future results without consistency in the driving factors of that performance.
Past Versus Present

One of the most popular topics on Seeking Alpha is the Dividend Aristocrats. These firms have not only paid but raised dividends annually for at least 25 years. Many income investors allocate aggressively to these names primarily, if not exclusively, because of their inclusion in this index. This reminds me of another classic truth in investing: buy the rumor, sell the news.
The goal shouldn’t be to purchase a company when it joins the Dividend Aristocrats. The objective should be to invest in growing companies that eventually become members. What investors seek is the increase in cash flows and durable business models that produce Dividend Aristocrats. The focus, however, in line with flawed human thinking, is to purchase the companies after the fact.

It’s better to buy the rumor and sell on the news the rumor turns out right.
Extremely compelling returns can still be had even after missing out on a Dividend Aristocrat’s fastest-growing early years. Investors’ concerns should shift toward ensuring that the variables and conditions that permitted the 25+ years of dividend growth are still in place.
We all know that stock prices today are based strictly on cash flows and asset values in the future, yet most articles are focused on the past. Nowhere is that more true than discussions around Dividend Aristocrats.
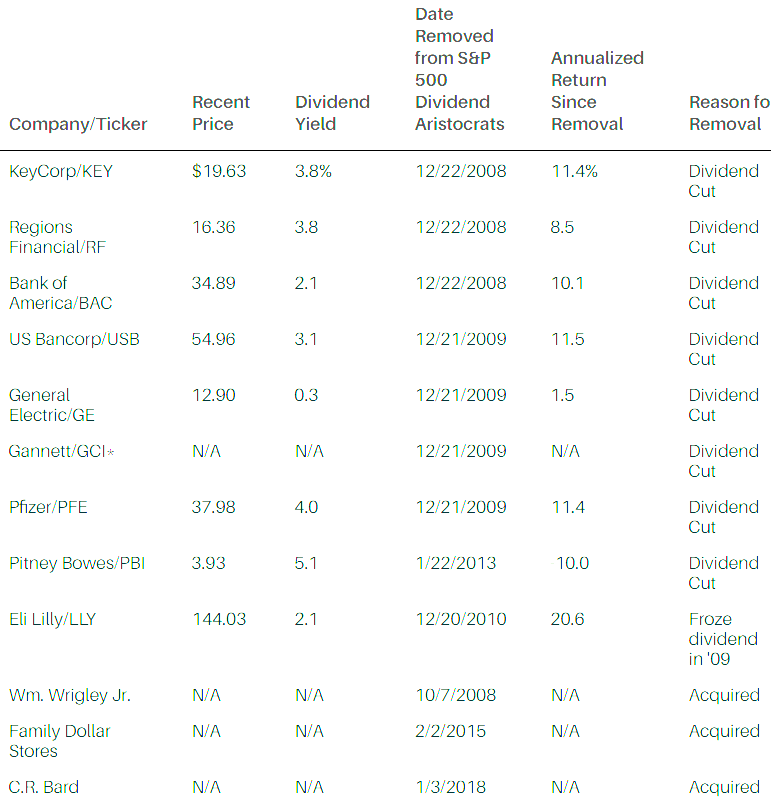
Source: Barron’s
This is a list you’ve probably never seen. It shows the list of companies that were once part of the Dividend Aristocrats but no longer are. 75% of those kicked out the last 10 years were due to dividend cuts/freezes while the remaining 25% were acquired. Depending on the source, there are about 57 current members in the S&P 500 Dividend Aristocrats index, though I have a feeling that number will shrink before it grows. In the past 10 years, that means over 15% of Dividend Aristocrats failed to maintain their status. General Electric (NYSE:GE) is the easy target as their leverage and cash flow profile was visibly collapsing for many years prior to the distribution cut, but there were many seemingly solid financial services companies in the above list.
Bank of Montreal – Q1 2020 Results
Foreign companies often run at a slightly different reporting schedule than those in the U.S.; Q1’s data is already available for BMO.
Net income of $1,592 million and adjusted net income of $1,617 million, both up 5%
Reported EPS of $2.37 and adjusted EPS of $2.41, both up 4%
Revenue, net of CCPB, of $6,031 million, up 8%
Provision for credit losses (PCL) of $349 million; includes PCL on performing loans of $25 million
ROE of 13.3%, compared with 13.6%; adjusted ROE of 13.5%, compared with 13.9%
Common Equity Tier 1 Ratio of 11.4%
Across the board, BMO generated strong growth in Q1 2020 versus Q1 2019. Return on equity figures (“ROE”) were consistent but down slightly versus the prior period.
Highlights include very strong performance within the BMO Wealth Management division, including net income of $291 million, an increase of $53 million or 22%, and adjusted net income was $300 million, an increase of $52 million or 21% from the prior year. BMO Capital Markets did even better with reported net income of $356 million, an increase of $100 million or 39%, and adjusted net income was $362 million, an increase of $99 million or 38% from the prior year. Canadian Banking (“P&C”) saw healthy growth of 8% with a net income of $700 million. The weakest area was U.S. P&C with a net income of $351 million compared to $444 million in the previous period. This was a result of modestly higher provisions for credit losses. Corporate Services, by far the smallest division, saw its net loss grow from $76 million to $106 million over the time period.
Provisions for credit losses (“PCLs”) are of the more informative areas of a large bank’s activities. In BMO’s case, total PCLs were $349 or an increase of $212 million from the prior year. On a percentage basis, total PCLs were only 31 basis points or 0.31% but significantly higher to the trend level of 13 basis points. Part of this seemingly negative rise in PCLs was due to portfolio growth.
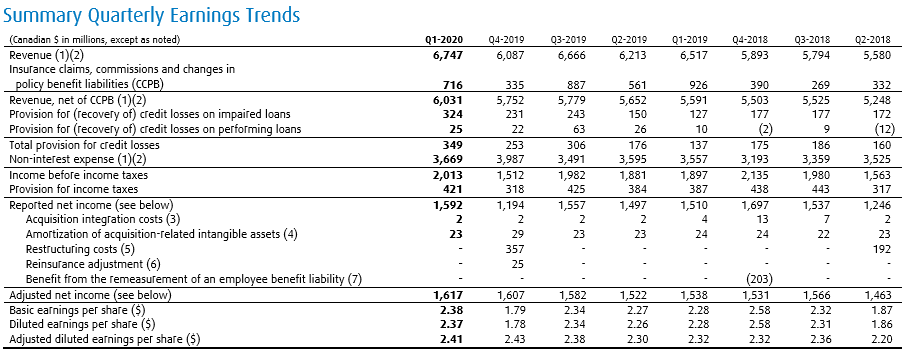
Let’s look at specific financial aspects over time.

Source: BMO 1st Quarter Report 2020
We’ve highlighted aspects that are at their best levels compared to the past 12 months. In general, all revenue and profit-related line items are at cyclical highs.
Source: BMO 1st Quarter Report 2020
This extends back many quarters as shown above.
Durability
Strong current financial performance relative to past periods is one of the key aspects of a firm to gauge if the future will be as bright as the past. BMO has that box checked, so let’s move on.
Concerning the distribution, a firm can theoretically raise it a penny per share for decades without actually generating cash flow growth per share. It might sound silly, but many companies do just that. We want meaningful cash flow and dividend growth. The distribution payout ratio is an easy lever to manipulate to increase dividends without increasing underlying financial performance. In BMO’s case, it maintains exceptional discipline and stays within a 40-50% EPS dividend payout ratio. BMO’s last figure was 44.5%, providing significant flexibility if profitability experiences intermittent volatility. BMO’s distribution policy is designed to withstand any crisis and has been that way for a long, long time, including both World Wars.
Source: BMO 1st Quarter Report 2020
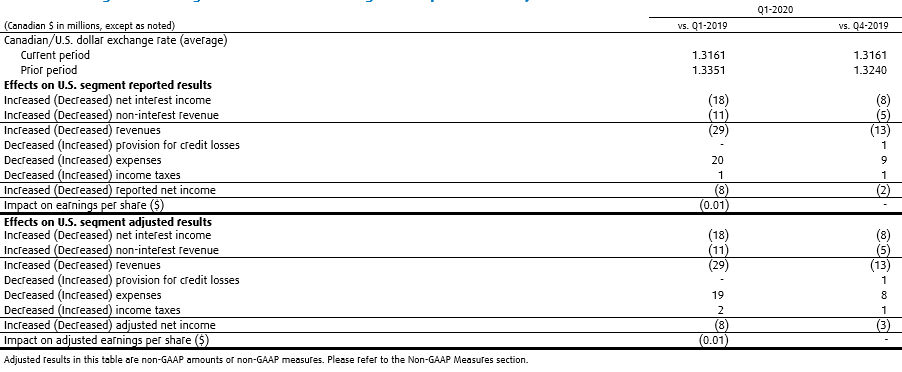
One thing you can no longer knock the big banks for is detailed financial reporting. Here, we can see the impact of the USD and CDN in substantial detail. In short, it doesn’t have a major impact on BMO.
Source: BMO 1st Quarter Report 2020
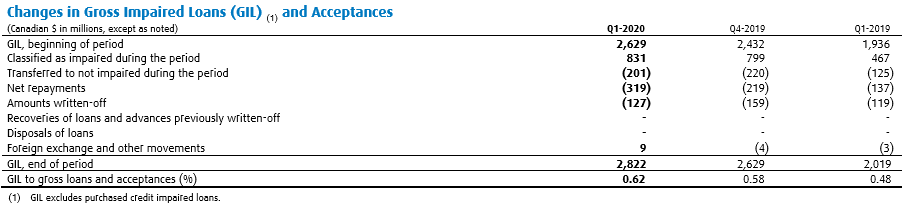
The dollar amounts related to the PCS discussed previously are provided above. There has been a notable increase but not to an extent that it will materially harm the bank’s financial position or profitability. Note that the firm just achieved its highest levels of revenues and profit at the same time these PCLs rose. Provisions for credit losses are accounted before net income, so they are included.
Source: BMO 1st Quarter Report 2020
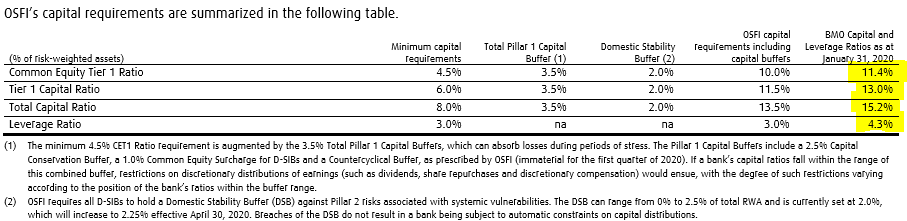
We highlighted BMO’s capital ratios, all of which are well above minimum requirements with most more than double necessary levels.
Another key aspect is the firm’s leverage ratio. Total assets for BMO increased $27.5 billion to $879.7 billion. Liabilities increased similarly by $26.4 billion to current levels of $827.5 billion. This is a healthy ratio for a bank like BMO.

Source: BMO 1st Quarter Report 2020
Banks and other financial institutions with complex balance sheets utilize Value-at-risk (“VaR”) calculations to gauge risk. These figures are all on the conservative side but have been trending modestly higher, though they remain well below period highs.
What about interest rate sensitivity?
Source: BMO 1st Quarter Report 2020
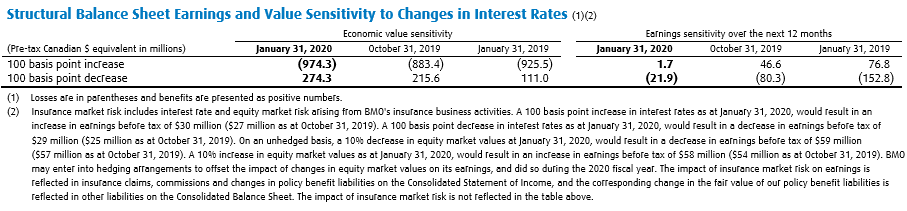
The bank isn’t particularly sensitive to a 100 basis point change in rates in either direction. BMO experiences a small decrease in earnings if rates decrease, but a more significant increase in asset value. When rates fall, income rises a minute amount, but asset values decline to the tune of about $975 million. Let’s keep in mind that the firm’s net equity is well over $60 billion, and its total assets are nearly $900 billion.
Does the firm have enough liquidity to endure a crisis?
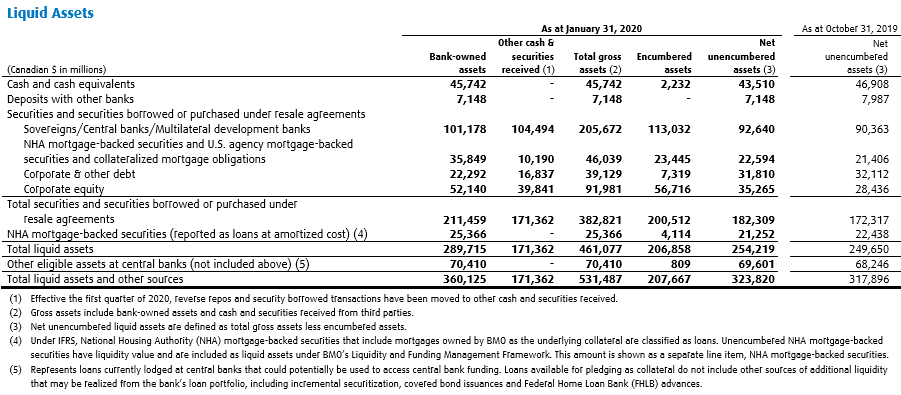
Source: BMO 1st Quarter Report 2020
BMO maintained total liquid assets of $360.1 billion at the end of the last quarter or well over one-third of total assets.

Source: BMO 1st Quarter Report 2020
We also carefully analyze banks’ ratio of encumbered to total assets. BMO scores well here too, with only about 25% encumbered or tied to financing.
To summarize, BMO’s payout distribution ratio, earnings trends, liquidity, capital ratios, and interest rate sensitivity are all excellent. The firm’s increase in PCLs is not optimal but partly due to increased portfolio growth. While BMO has some exposure to the oil and gas industry, it’s immaterial in the context of its broader asset pool, and the firm has invested through more commodity crashes than just about any other company operating today.
Valuation
BMO’s dividend yield is an excellent way to measure stock’s worth since it is so reliable and tied directly to the firm’s cash flows. BMO’s dividend yield reliably tells investors what 45% of its annual earnings per share is relative to the current stock price. Note that those earnings are in Canadian dollars yet distributions paid to U.S. investors are in USD – that means BMO has had periods where it maintained or increased the dividend, but U.S. investors recognized a small decrease. Over time, however, developed nations’ currencies normalize, and U.S. investors have enjoyed similar compound annual returns to CDN investors.
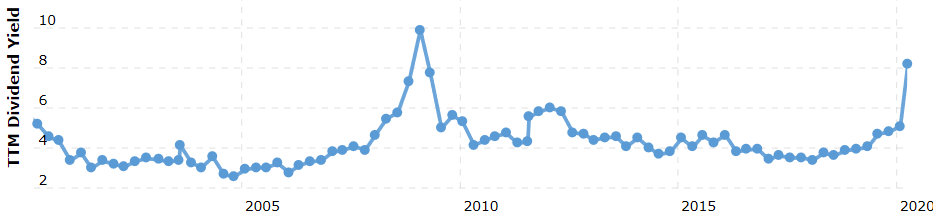
Source: Macrotrends.com
Looking back over the last 20+ years, there has only been one period where investors could have obtained BMO even close to current valuation levels: 2008/2009.

Source: Yahoo Finance
For a short window of October 2008 through April of 2009, it was possible to obtain BMO at a better valuation today on the surface. In the proper context, however, BMO is a far better value today. The last recession was directly connected and attributable to a miss-pricing of risk in the global financial system – BMO was deeply integrated into that system. The real and perceived risk to BMO’s earnings and balance sheet was an order of magnitude more severe than we experience today. The market priced in much higher potential loan write-offs and earnings declines. When reviewing actual data from the period, such as this Q3 2010 earnings call transcript, BMO’s PCLs were actually in the range of $200 to $300 million and very manageable. EPS was 50% lower back than compared to today as well, so today’s ~$50.00 closing price is akin to ~$33.30 during the Great Recession. That’s quite close to the bear market lows of as shown above.
It’s true that there is plentiful bad news circulating, including about 10% of mortgages on the Big Five’s balance sheets entering deferral. Those Canadian loans are full recourse, unlike here in the U.S., and the average loan-to-value is a much lower fraction as well. For those that have followed Williams Equity Research’s many articles on the Canadian Banks, people have been predicting their demise because of the Canadian residential real estate market for more years than we can count.
The market is pricing in a worse-than-2008 type of crisis, but the data related to BMO doesn’t reconcile with that. We expect a 12-25% hit to EPS for at least a couple quarters and potentially for all of 2020. Including this sharp decline, BMO trades at 9x EPS multiple compared to a historical average of 12x to 14x. Once earnings stabilize back to 2019 levels, which we suspect will occur in 2021, a 12x multiple on $6.30 EPS results in a target sell price of $75.60 or >51% higher than today’s close.
Our Crisis Buy Range for BMO is reserved for subscribers, but we wrote this article when it was within the range. Despite the market’s recent rally, the stock remains at the upper end of what we consider a very favorable long-term entry point. Our lead portfolio has purchased shares in BMO in the $60s and $50s and plans on allocating more if the stock touches its 52-week lows. He maintains significant personal investments in Royal Bank of Canada (NYSE:RY), Toronto-Dominion (NYSE:TD), and BMO. We like the other Canadian banks as well but prefer these three. We reserve risk ratings for subscribers, but our confidence in BMO in the near and long term is evident throughout the article.
Want to take advantage of the sell-off but worried about choosing the wrong stock or buying too early? After thoroughly assessing the current environment, we built a brand new “Crisis” portfolio to aid our subscribers with fresh recommendations on REITs, BDCs, and high-quality dividend stocks. It includes crisis buy ranges, company quality ratings, risk-tolerance commentary, and more to navigate the volatility with confidence based on today’s circumstances, not the old paradigm.
Start a free trial of our Institutional Income Plus service. We explain how institutional investors source, analyze, and manage their investments but with the individual investor in mind. Join the growing community!
Disclosure: I am/we are long TD, RY, BMO. I wrote this article myself, and it expresses my own opinions. I am not receiving compensation for it (other than from Seeking Alpha). I have no business relationship with any company whose stock is mentioned in this article.
Additional disclosure: The Canadian banks currently make up a 3.5% of the Crisis IIP Portfolio and 53% of Financials Services exposure within the Global Dividend Stocks category.
Be the first to comment