


conejota/iStock via Getty Images
Introduction
We review our Bank of America Corporation (NYSE:BAC) investment case after shares have fallen 13% in December so far and continued to head towards the 52-week low reached in September 2022:
|
Bank of America Share Price (Last 1 Year) 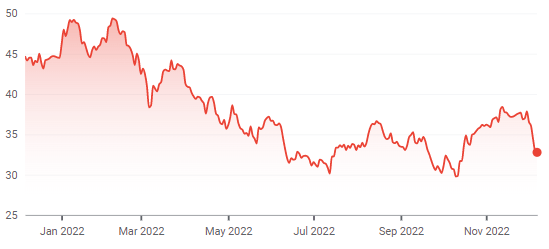 Source: Google Finance (07-Dec-22). |
BAC has been a core holding in our portfolio for more than a decade, and we initiated our coverage of BAC on Seeking Alpha with a Buy rating in October 2019. Since then, BAC shares have returned 27% (with dividends) in just over 3 years, despite having fallen 34% from their peak in January 2022.
BAC shares are at 1.55x Price / Tangible Book Value (“P/TBV”), which we believe implies a normalized P/E of just over 10x. Excluding the COVID-19 shock in March 2020, BAC shares had previously troughed at around 1.4x TBV. Net Interest Income (“NII”) is up 24% year-on-year as of Q3, thanks to the Fed’s rate hikes and the resumption of loan growth. Non-Interest Revenues are coming down from COVID highs, but the net impact should be relatively modest. Management expects to limit cost growth and achieve substantial operational leverage in the next few years. Credit costs, even in the event of a recession, should be manageable. BAC stock is at a 17% discount to JPMorgan (JPM) on a P/TBV basis, more than is justified in our view. Our return forecasts indicate a total return of 82% (22.5% annualized) by 2025 year-end. The Dividend Yield is 2.7%. Buy.
Bank of America Investment Case Recap
We believe large U.S. banks like Bank of America and JPMorgan can grow their earnings at “GDP +”, thanks to their scale, diversified franchises and leading market positions:
- Large banks achieve NII on favourable Net Interest Yields, thanks to their cheap deposit funding; yields had shrunk in recent years due to Quantitative Easing (“QE”), but are now rising again
- They have large Non-Interest Revenues such as Investment Banking Fees, which tend to become elevated during periods of QE as cheap money stimulates corporate and market activity, offsetting NII weakness
- Their cost ratios tend to be stable or improving, as economies of scale and use of technology help them become more efficient
- They are now far less vulnerable to economic downturns than in the past, thanks to central banks’ willingness to deploy QE and much larger capital buffers after the 2008 crisis
The core of our investment case is that BAC will maintain a mid-teens long-term Return on Tangible Book Equity (“ROTCE”) on a growing capital base:
|
BAC Group ROTCE (Since 2013) 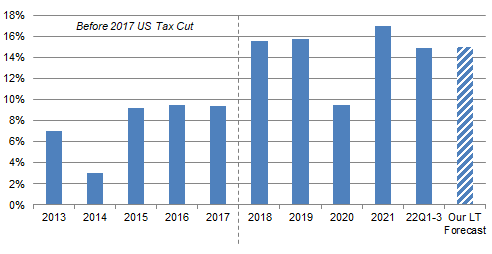 Source: BAC results supplements. NB. Excludes $2.07bn First Data JV impairment in 2019. |
Compared to its peer JPMorgan (also Buy-rated; see our review of Q3 2022 results) BAC is more weighted towards U.S. retail banking, its low-cost deposit franchise means it should benefit more from rising interest rates, and it faces less stringent regulatory capital requirements as it continues to grow in size.
BAC’s valuation has shrunk significantly even as its investment case remains on track, as we will explain below.
BAC Stock Key Metrics
At $32.98, BAC stock is trading at 1.55x its Q3 2022 TBV of $21.21. Relative to our assumed long-term ROTCE of 15%, this implies a P/E of 10.4x.
BAC’s current market capitalization is $269.1bn. Compared with Net Income of approximately $30bn in both 2019 and 2021, the implied P/E is around 9x. Compared with Net Income of $16.5bn in 2021, which was after $11.3bn of credit costs, the P/E is 16x.
BAC stock pays a dividend of $0.22 per quarter, or $0.88 annualized, representing a Dividend Yield of 2.7%. Management targets a Payout Ratio of around 30%, and the dividend was raised by 5% (from $0.21) in July.
BAC Stock Typically Troughed at 1.4x TBV
Since 2018, BAC stock has troughed in December 2018, March 2020 and then September 2022:
|
Bank of America Share Price (Last 5 Years) 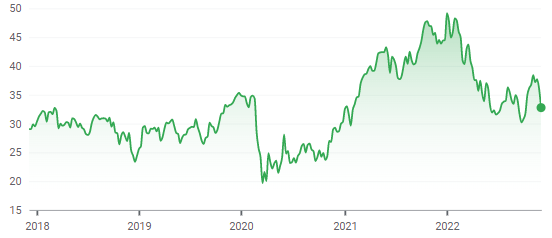 Source: Google Finance (07-Dec-22). |
The March 2020 trough, following the start of COVID lockdowns in the U.S. and Europe, saw BAC’s P/TBV multiple fell to around 1x. That was clearly exceptional and, at the other two troughs, BAC’s P/TBV multiple was around 1.4x:
|
BAC Stock Price & Valuation Troughs (Since 2018) 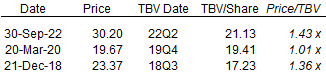 Source: Google Finance (07-Dec-22). |
With BAC’s P/TBV currently at 1.55x, we believe further downside in the stock is limited.
Post-2018 Years Represent the “Real” BAC
BAC’s ROTCE took a step change in 2018, jumping from below 10% in the years preceding it to mid-teens after (except the COVID-impacted 2020). The average ROTCE across 2018 to Q1-3 2022 is 14.6%. We believe the post-2018 years represent the “real” BAC, after it has resumed normal loan growth and regular expense control with the completion of its restructuring following the 2008-9 Global Financial Crisis. Because BAC’s ROTCE had a step change in 2018, only P/TBV values from 2018 onwards is relevant to the present.
A comparison of the 2016 and 2018 P&L statements shows how 2018 represents the “real” BAC (we have skipped 2017 because it contained one-off tax items related to the U.S. tax cut that year). With respect to the $10.3bn increase in Net Income, NII growth was the biggest contributor at $7.1bn (pre-tax), Non-Interest Expense reduction was next biggest at $1.9bn, and Income Tax Expense was $0.8bn lower despite a higher Pre-Tax Income:
|
BAC Key P&L Items (2016-18) 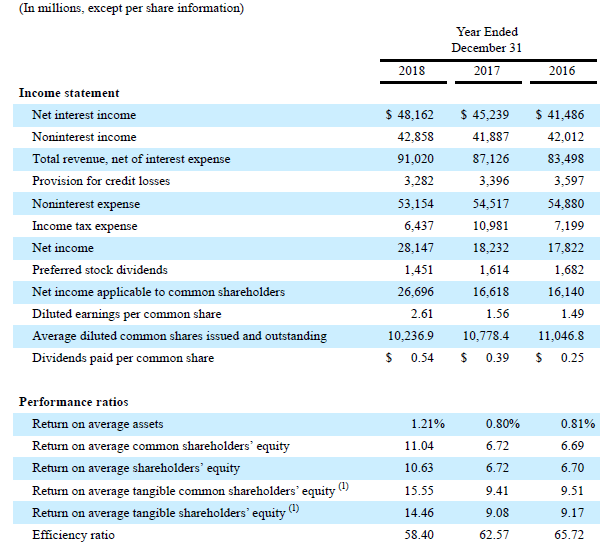 Source: BAC results supplement (Q4 2018). |
The 16% NII growth in 2016-18 was driven by both balance sheet growth and higher rates, with Total Interest-Earning Assets growing 6.1% and Net Interest Yield on Earning Assts growing 8% from 227 bps to 245 bps:
|
BAC Earning Assets & Net Yields (2016-18) 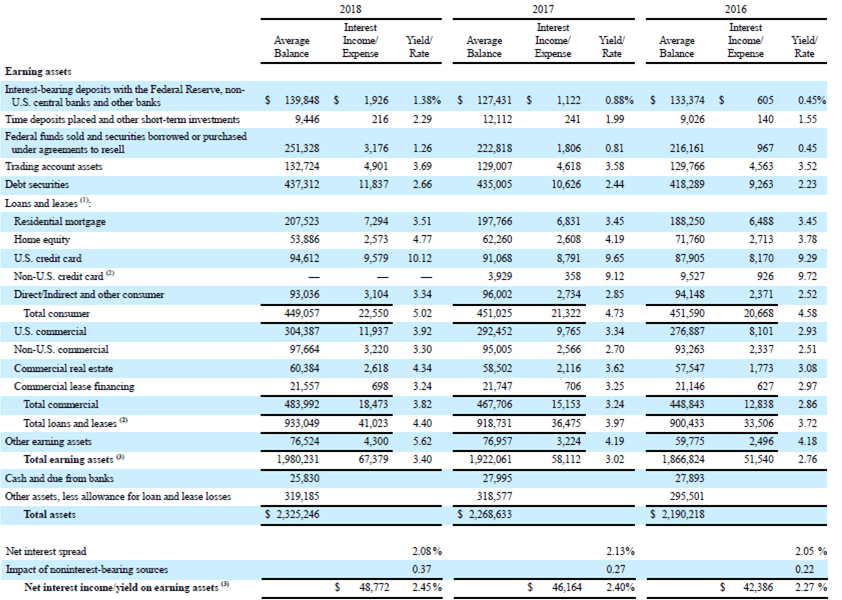 Source: BAC results supplement (Q4 2018). |
BAC’s Net Yield on Interest-Earning Assets was just 206 bps in Q3 2022, and we believe there is potential for NII to in show similar growth in coming years as it did in 2016-18.
BAC’s Strong Interest Income Tailwinds
BAC’s NII has been growing rapidly this year, thanks to the Fed’s rate hikes and the resumption of loan growth.
In the past 5 quarters, BAC’s Net Interest Yield (as reported) has risen by 23% from 168 bps to 206 bps:
|
BAC Net Interest Yields (FTE Basis) (Last 5 Quarters) 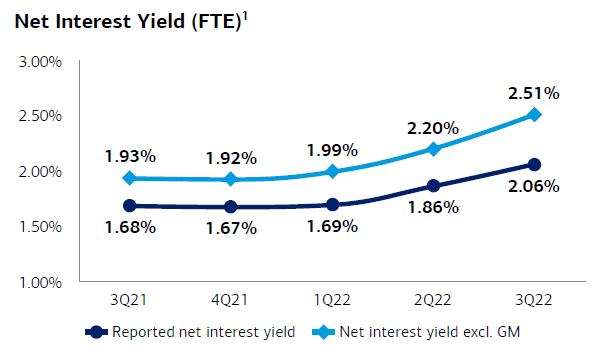 Source: BAC results presentation (Q3 2022). |
Growth in Net Interest Yield has been helped by a mix shift in Interest-Earning Assets to Loans & Leases, which represents 39% of Interest-Earning Assets but has a Net Yield that is about one third higher (394 bps vs. 294 bps in Q3 2022). In the past 5 quarters, BAC’s Total Average Loans & Leases have risen 12% year-on-year:
|
BAC Average Total Loans & Leases (Last 5 Quarters) 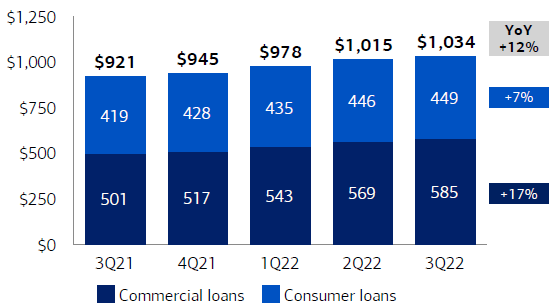 Source: BAC results presentation (Q3 2022). |
Together these have helped NII grow 24% year-on-year as of Q3 2022:
|
BAC Net Interest Income (FTE Basis) (Last 5 Quarters) 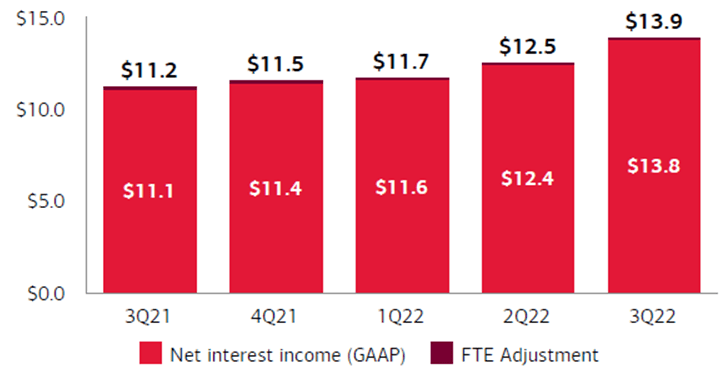 Source: BAC results presentation (Q3 2022). |
BAC CEO Brian Moynihan expressed confidence about further loan growth and NII increases at an investor conference this week:
”We’ll be up somewhere between $900 million and $1 billion (in NII) this quarter …We feel pretty good about loans growing mid-single digits. Ebbs and flows, but mid-single digits”
NII growth will also be helped by the continuing strength of BAC’s low-cost deposit base, which has remained stable since Q3 quarter-end and includes a large component (about $600bn out of $1.9 trillion) of stable consumer deposits in checking or equivalent accounts.
Modest Headwinds in Non-Interest Revenues
Non-Interest Revenues are coming down from COVID highs, but the net impact will be relatively modest. While BAC is the global #3 in Investment Banking (“IB”) fees and have benefited from the boom in M&A and capital markets activity, it had a relatively modest (about $3bn) increase in IB fees between 2019 and 2021:
|
BAC Non-Interest Revenues (FTE Basis) 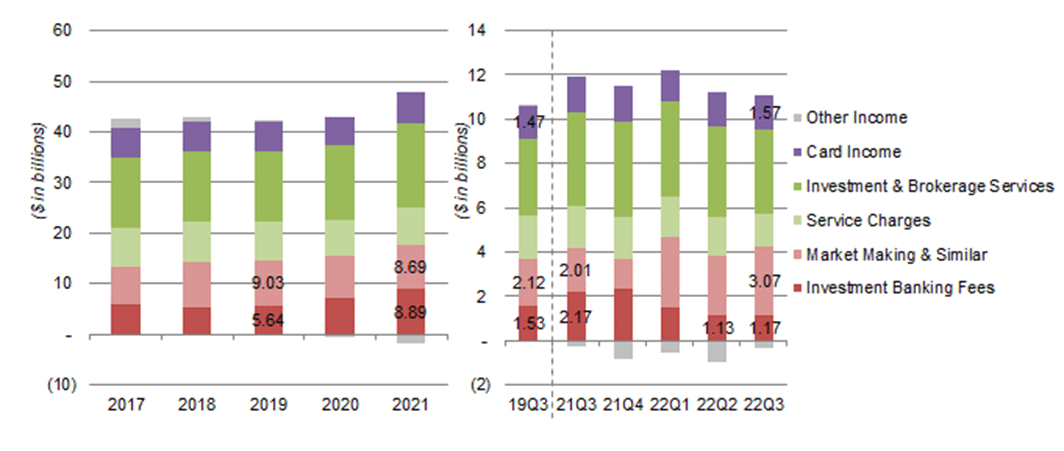 Source: BAC results supplements. |
Figures from the most recent quarter tells the same story, with IB fees having risen from $1.53bn in Q3 2019 to $2.17bn in Q3 2021, but falling back to $1.17bn in Q3 2022. This was offset by higher Market Making & Similar revenues, which we believe is now on a permanently higher base after management allocated more capital to Markets in 2021.
Q4 2022 is likely to be similar. Moynihan stated at the same investor conference this week that investment banking revenues were down 55-60% year-on-year in Q4, but offset by Markets revenues being 10-15% higher, the latter due to Equity revenues being “flattish” but Fixed Income revenues growing 20% thanks to market volatility.
More Cost Control & Operational Leverage
BAC has kept its total expenses at $15.3bn in the last 3 quarters, despite elevated inflation, and its Efficiency Ratio has continued to improve (to 62% by Q3), towards to high 50s level that prevailed before COVID-19.
|
BAC Total Non-Interest Expenses ($bn) (Last 5 Quarters) 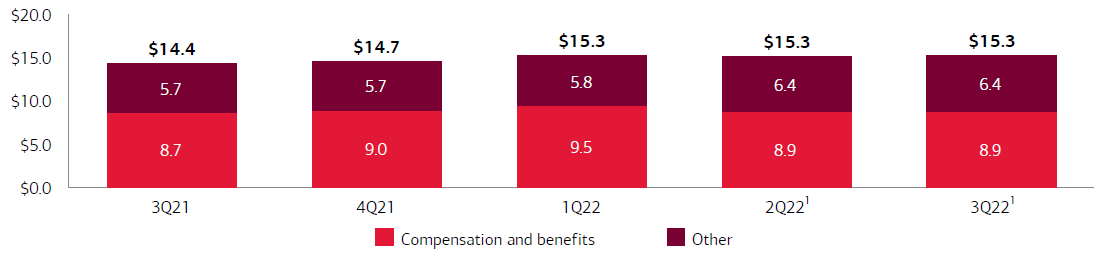 Source: BAC results presentation (Q3 2022). |
At this week’s investor conference, CEO Brian Moynihan reiterated management’s intent to keep costs relatively flat in 2023 and achieve operational leverage in the next few years:
“We said we’d be flattish this quarter, we’ll probably be $15.3-15.5 billion … So say $15.5 billion, you take that, times 4, that’s $62 billion. You had the $500 million in FDIC that we got landed on us after earnings. We’re comfortable with that … increasing our investment next year for $300 million plus in technology spend and absorbing in that $60-62.5 billion run rate …
Longer term, we think we give a couple of hundred basis points of operating leverage on a given year. And this year, it’s exceeded that, but that’s because of the NII”
We believe BAC will be able to deliver these.
Manageable Credit Costs Even In a Recession
Credit costs, even in the event of a recession, should be manageable.
BAC has demonstrated this during COVID-19. Under CECL accounting standards since the start of 2020, banks have had to reserve for all expected credit losses upfront (albeit using probability-weighted figures from a range of scenarios). BAC nonetheless has stayed profitable every quarter, including in Q1 and Q2 of 2020 when $7.6bn were added to reserves:
|
BAC Earnings, Provisions & Pre-Tax Profit by Quarter (Since 2020) 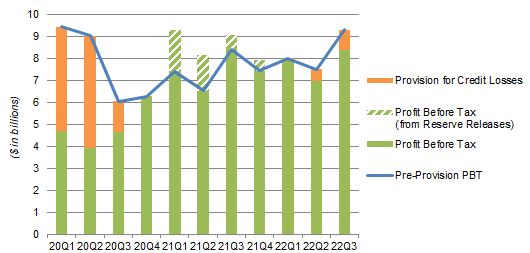 Source: BAC results supplements. NB. Figures on managed basis. |
BAC credit reserves peaked at $21.1bn, or 1.96% of loans and leases outstanding, at Q2 2020 (compared to $13.5bn and 1.27% respectively at the start of 2020). They stood at $13.8bn and 1.20% respectively as of Q3 2022, after substantial releases in 2021 as the economy stabilized.
In the event of a recession, its severity would be unlikely to exceed the unprecedented disruption caused by COVID-19 in 2020, so we would expect the required credit costs to be lower. This means BAC would almost certainly again achieve profitability every quarter and continue to add to its TBV.
Moreover, BAC has Common Equity Tier-1 (“CET1”) Capital of $175.6bn as of Q3 2022, with a CET1 Ratio of 11.0% (compared to minimum requirement of 10.4%, though this will rise to 10.9% at the start of 2024). This means that even a repeat of the $7.6bn reserve build in Q1-2 2020 would represent a relatively modest figure next to BAC’s TBV.
BAC Discount Against JPM Stock is Too Large
BAC stock is at a 17% discount to JPMorgan on a P/TBV basis:
- BAC: Share price $32.98, TBV/Share $32.98, P/TBV = 1.55x
- JPM: Share price $131.59, TBV/Share $69.90, P/TBV = 1.88x
While JPM has historically achieved a higher ROTCE than BAC, we do not believe the difference justifies the valuation gap. For Q1-3 2022, BAC had a ROTCE of 14.9%, JPM’s ROTCE is only 13% higher at around 17%.
More importantly, we believe BAC earnings have more room to grow than JPM’s, as shown by this Q3 snapshot:
|
Q3 P&L – JPM vs. BAC (2019, 2021 & 2022) 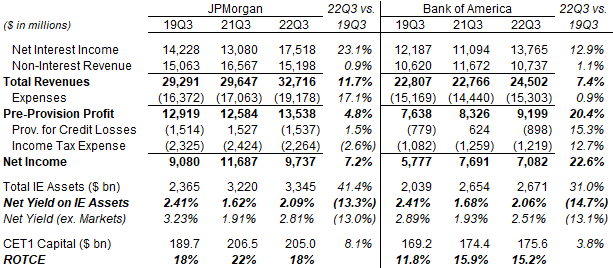 Source: Company results supplements. |
BAC’s Pre-Provision Profit has grown by more than JPM’s on both a year-on-year basis and when compared to 2019. (The same is true for Net Income.) This is because, while BAC’s revenues have grown less quickly, it has been able to achieve this growth with essentially flat expenses; JPM expenses have grown by 17% since 2019.
In addition, we also believe JPM faces tougher headwinds because it gained more in M&A and capital markets activity during 2021-22 (its 2021 IB fees were $5.8bn higher than in 2019, compared to BAC’s being $3.6bn higher), and because its balance sheet has reached a size that triggered more higher capital ratios. (JPM has reached G-SIB Bucket 4 while BAC remains in Bucket 3, which means an extra 50 bps in its minimum CET1 ratio.)
BAC Stock Forecasts
We keep the assumptions in our forecasts unchanged:
- ROTCE to be 15.0% for all years
- From 2023, Net Income to be 15% retained for growth, 30% paid out as dividends and 55% on buybacks
- Buybacks to be carried out at a P/TBV of 1.7x
- 2025 year-end P/E of 13.5x
Our new 2025 EPS forecast remains unchanged at $4.17:
|
Illustrative BAC Return Forecasts 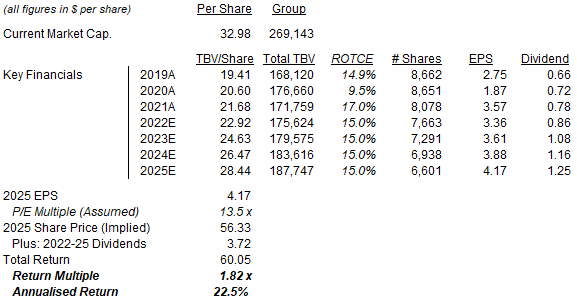 Source: Librarian Capital estimates. |
With shares at $32.26, we expect an exit price of $56 and a total return of 82% (22.5% annualized) by the end of 2025.
Most of the upside is expected to come from an upward re-rating in BAC’s P/E, but the Dividend Yield (currently 2.7% and growing) and the forecasted 4% EPS CAGR during 2021-25 alone should give a high-single-digit annualized return.
Is BAC Stock A Buy, Sell, or Hold?
We reiterate our Buy rating on Bank of America Corporation stock.
Be the first to comment