

Kevin Frayer
Implementing effective AI solutions requires large investments in technology and there are not many companies that are investing as much and for as long as Baidu Inc. (NASDAQ:BIDU).
I cite as an example the automotive market where in China EV sales are growing by 100% year on year (China is now the largest EV market in the world). Baidu has been investing in autonomous driving for 10 years and with an almost unparalleled set of data and analyses made, it is one of the main candidates to take advantage of this trend (robotaxi is one of the core applications).
In this highly innovative and technological context, Baidu is configured as a veteran company with many years of experience behind it, with double-digit revenue growth in the last 10 years and with highly respectable P&L ratios. On the other hand, a ‘slow’ growth in margins and free cash flow and a Return on Capital Employed that is still too low should be underlined.
From my point of view, the share price incorporates a large amount of future growth and this, if past growth rates persist, would allow an adequate return on investment risk over a very long time. This is the reason why I don’t feel like entering a long position where the purchase price may be too high. My rating is on Hold.
Quick Overview
Baidu, Inc. has a clear mission to use technology to make a better world. The company was born in 2000 and its first product was the search engine platform. The company was also one of the first to use artificial intelligence (or AI) in 2010 to facilitate the use of online content
In 2022 Baidu represents a Company fully integrated into AI with the internet base of all the operations.
The first product is Baidu App which is the first search app in China but the company has a very highly diversified product portfolio (from AI Cloud to Autonomous vehicle driving) that covers a very broad market share with hundreds of millions of users, developers, and enterprises as final customers.
Baidu became a public company in 2005 on the NASDAQ, and in 2021 was also listed on the Stock Exchange of Hong Kong.
Financial & Highlights
Revenue and Profitability
BIDU 10-K Form + Author Graph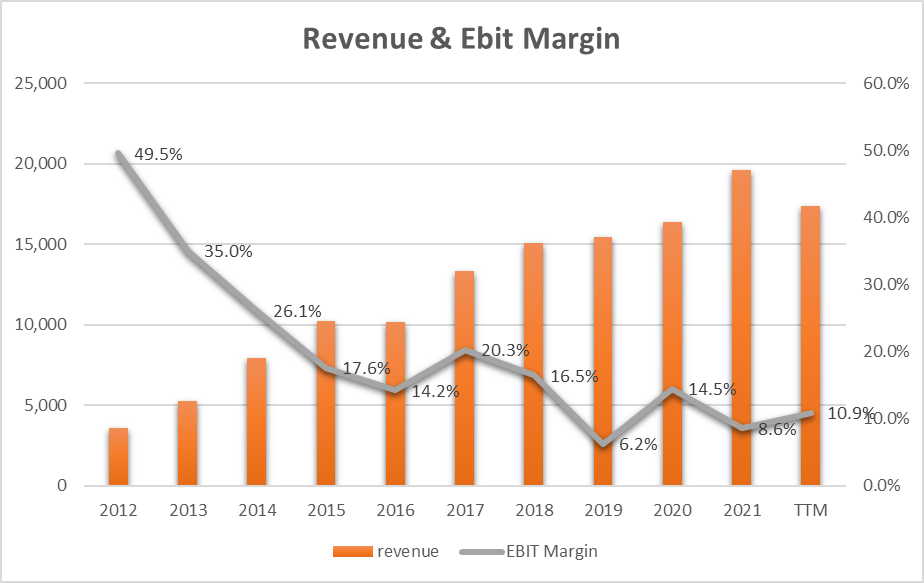
The orange bars show revenue over the past 10 years. We can see a strong growing trend with an annual growth rate (or CAGR) of 17.1%. The figure is impressive even if 2022 marks, for the first time, an important decline of 11% to date.
The gray line instead shows the trend of the EBIT margin and we can instead see how this is in constant descent going from 49.5% in 2012 to a more modest 10.9% in 2022. It must be said that starting from 2019 some interventions implemented by the company have laid the foundations for a reversal of the downward trend in profits and this deserves a more in-depth analysis at the Quarter level over the last year.
BIDU 10-K Form + Author Graph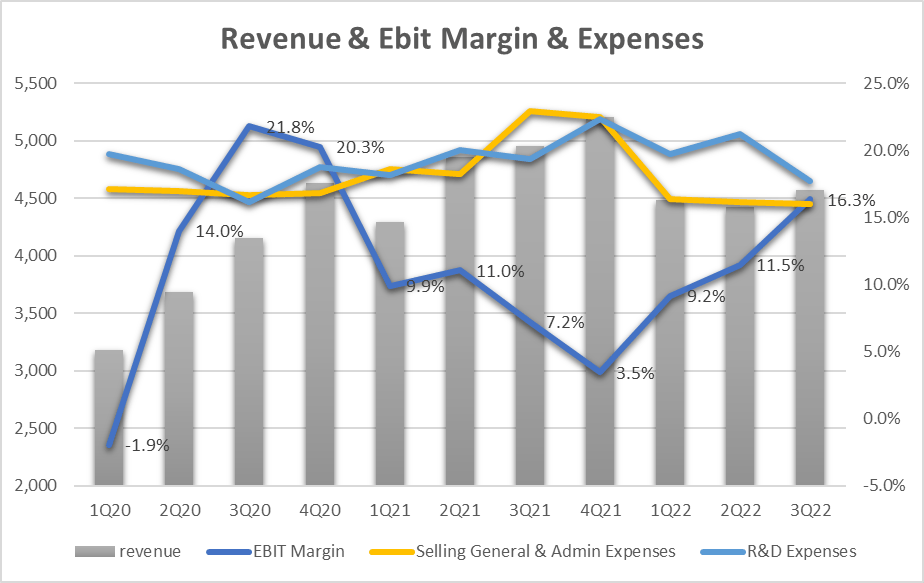
The gray bars show the revenue trend per quarter and we can see that in the last 2 quarters of 2022 (2Q and 3Q) there was a marked drop in revenue which stood at around $4.5B compared to $4.9B in the same quarter of the last year.
According to Baidu Management the Business Revenue
“was negatively affected by the resurgence of COVID. Throughout Baidu’s history, however, we have experienced many challenging environments.”
Settled and accepted that the revenue may have been conditioned by factors exogenous to the company, what instead has been controlled and well managed turns out to be the margins. If we look at the EBIT Margin (blue line), we can see how this has resumed a growing trend right from Q4-21 and precisely the margin has gone from 3.5% to 16.3% (a figure of absolute respect).
Analyzing the reasons for this result, we can see that the merit lies mainly in the gross margins and more precisely in the company’s ability to reduce overheads (yellow line) and R&D (blue line).
BIDU 10-K Form + Author Graph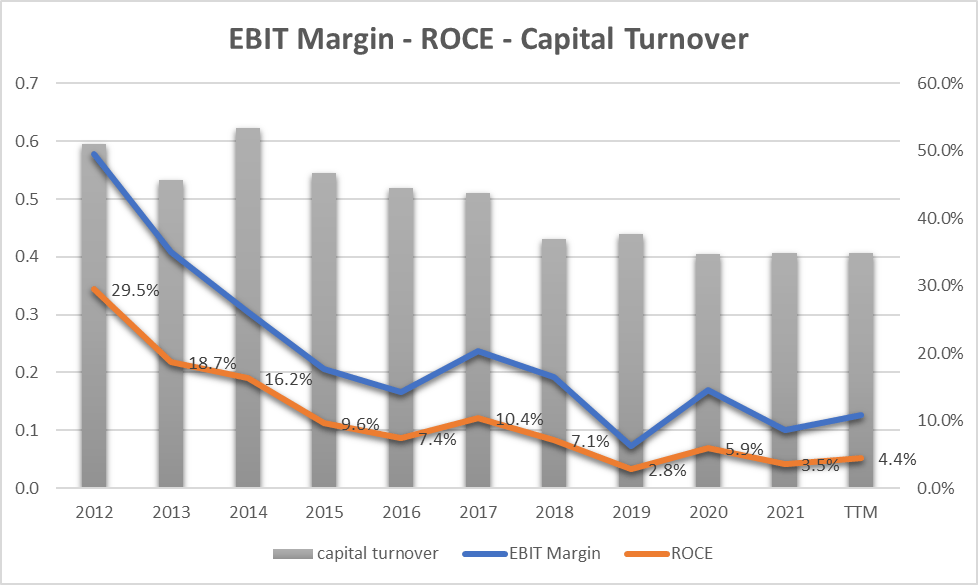
Moving on to analyze the profitability of the capital employed, we can see how the gray bars of the graph (Capital turnover) have a downward trend and that especially in the last 3 years (since 2020) the Capital Turnover has remained at 0.4 and has not improved. This underlines a high use of capital against a Revenue that does not grow as much as the use of capital. The ROCE (Return on Capital Employed – orange line) consequently also has a decreasing trend and stands at 4.4% (or TTM) which is a figure greater than 0 but which still requires improvement in the long term.
Free Cash Flow and CapEx
BIDU 10-K Form + Author Graph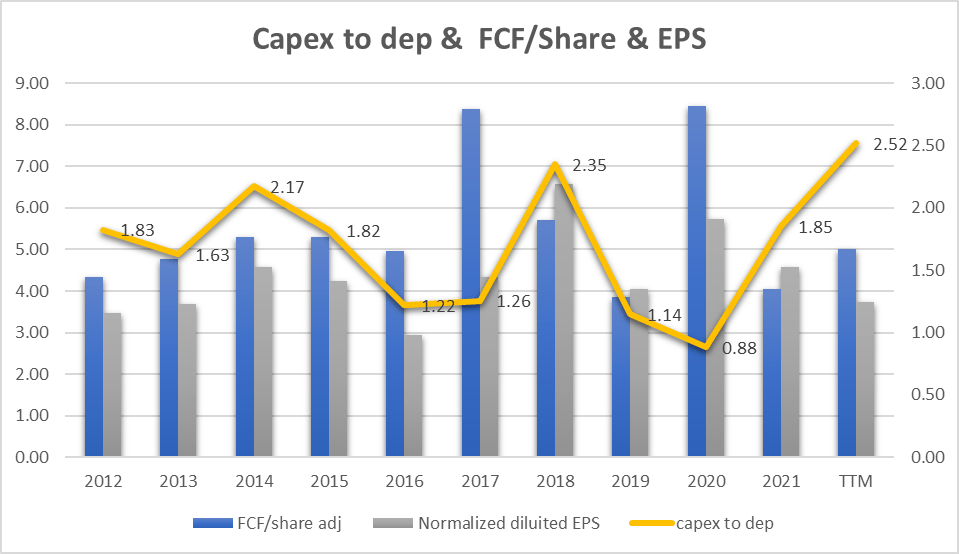
In the graph above we can see how the EPS (grey bars) have an almost constant trend in the last 10 years (the annual growth was 0.8%). The important thing that is underlined in the graph is the Free Cash Flow per share (blue bars) that closely follows the EPS trend. This means that the company can consistently transform earnings into free cash flow despite heavy technology investments. The yellow line shows the ratio between the CapEx and the Depreciation and we can see how this is almost always greater than one to indicate that the funds destined for investments are always greater than the value of the assets. This is a positive aspect (for this kind of company) with a view to growth well supported by adequate constant investment. 2022 also marks the highest value (2.52) in the last 10 years and this implies the great effort that the company is making in technological investments for growth.
Valuation
Since cash flow, in my opinion, could be the parameter that defines the potential of Baidu, I decided to use it for the evaluation of the share price. Using Cash Profit as the main metric to analyze and evaluate the share’s value, I decided to identify the cash yield or interest rate of return as parameters. The parameter tells us how much every single share makes in cash.
In a very simple way the evaluation formula is the following:
cash interest rate = cash profit per share/share price
at a current price of $108
cash interest rate= 5/108 = 4.6%
4.6% is not so bad but it is too low for such a risky investment and we have also to take into consideration that future earnings growth is also considered in the current share price.
Therefore, wanting to define how much value the current price takes into account the future profit growth, we can set up a calculation based on the future growth rate of the FCF/Share. I used 1.4% as an estimation of the future growth rate FCF/Share and is based on the growth rate of the last 10 years (FCF/share went from $4.33 in 2012 to $5 in 2022 with a compounded annual growth rate of 1.4%).
|
Year |
Cash per Share |
Growth |
Buying price |
Cash Yield |
|
0 |
5 |
0 |
108 |
4.6% |
|
1 |
5.07 |
1.4% |
108 |
4.7% |
|
2 |
5.14 |
1.4% |
108 |
4.8% |
|
3 |
5.21 |
1.4% |
108 |
4.8% |
|
4 |
5.29 |
1.4% |
108 |
4.9% |
|
5 |
5.36 |
1.4% |
108 |
5.0% |
|
6 |
5.43 |
1.4% |
108 |
5.0% |
|
7 |
5.51 |
1.4% |
108 |
5.1% |
|
8 |
5.59 |
1.4% |
108 |
5.2% |
|
9 |
5.67 |
1.4% |
108 |
5.2% |
|
10 |
5.75 |
1.4% |
108 |
5.3% |
The low yield means that investors are paying for future growth and in this case, it will take 10 years of 1.4% growth in cash profits to get a 5.3% return on the $108 buying price. It will take another 10 years to get a further 1% return on top.
As we can see, at the price of $108 the share is overvalued and requires a long time at the current growth rate to get an acceptable return (12% at least from my point of view).
Peers Comparison
To compare BIDU with similar companies in terms of market capitalization in the Interactive Media and Services industry, I have defined the following peers:
- Pinterest, Inc. (PINS)
- ZoomInfo Technologies Inc. (ZI)
- Meta Platforms, Inc. (META)
- Weibo Corporation (WB)
Using Seeking Alpha’s Quant Ratings, we have a ‘Buy’ verdict related to the ‘Hold’ rating of the other companies.
Seeking Alpha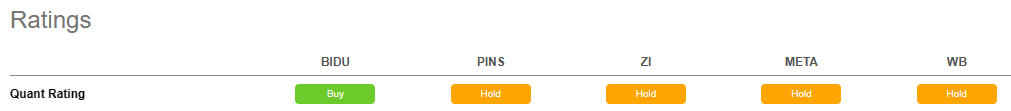
Seeking Alpha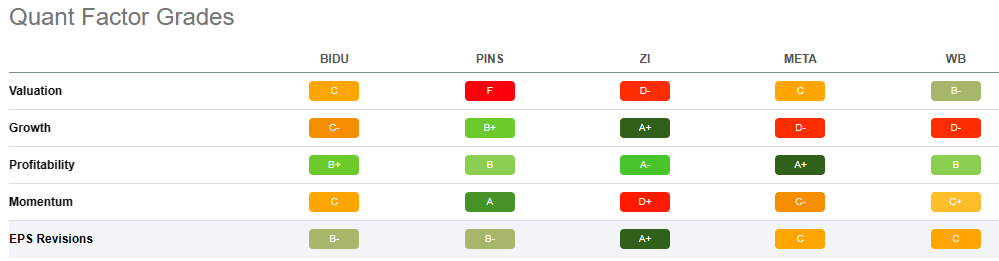
From the Quant Factor Grades point of view, we can see how Baidu does not excel in any of the assessments for single Factor Grades indeed, for each metric, there are one or more peers who have obtained a better score. Baidu gets the best score in profitability with a ‘B+’ but we can also see how META and ZI are better or preferable with ‘A+’.
Baidu’s strengths are expressed by the collective of all Factor Grades and put together they define a company that holds up well in all areas of evaluation. This is not the case for other Peers where perhaps they excel in a single area but get a bad rating in another.
Slow growth represents the greatest risk element
We have seen how revenue has grown by 17.1% annually in the last 10 years but we have also seen how the same has decreased by 11% during 2022 (or TTM). EPS grew by 0.8% again in 10 years (from $3.46 to $3.74) Free Cash Flow/Share grew by 1.4%. Capital Turnover decreased from 0.6 to 0.4. The reasons for this somewhat slow growth can be found in the most varied reasons but for 10 years, I think that the negative effects can be offset by as many positive effects and therefore the ratios portray a fairly correct figure.
Growth is present and the fundamentals are also positive, but the growth rate, in such a fast market, is, in my opinion, too slow and represents an element of high risk, above all in consideration of the share price which contains within it a value for very high growth rate.
Bottom Line
Baidu, Inc. is a highly innovative company in a market with very high growth rates (AI + EV). Revenue is growing at a high rate but if we look at 2022 (or TTM), we will record a rather worrying decrease of 11%. In terms of margins, the EBIT Margin stands at a positive value of 10.9% while the ROCE is much lower at 4.4%. This identifies a much higher growth in invested capital than Revenue and this could represent a risk element in the long term.
The share price valuation is high due to a strong growth component that is currently struggling to be identified. My rating is currently neutral with Hold.
Editor’s Note: This article discusses one or more securities that do not trade on a major U.S. exchange. Please be aware of the risks associated with these stocks.
Be the first to comment