

Oat_Phawat
Introduction
Vancouver-based gold miner B2Gold Corp. (NYSE:BTG) released its third-quarter of 2022 gold production results on October 17, 2022.
Note: I have been regularly covering B2Gold on Seeking Alpha since 2019. This article is an update of my preceding article, published on August 22, 2022.
1 – 3Q22 Gold Production Snapshot
B2Gold posted a solid gold production of 227,016 Au ounces (including 12,113 Au ounces for its 30.8% Calibre Mine) in the third quarter of 2022. The company reaffirmed that it was on track to meet annual guidance for 2022 with a total of 990K-1,050K.
| B2Gold |
Gold Production |
|||
|
Mine |
Q3 2022 |
YTD 2022 |
FY 2022 Revised Guidance |
|
|
Fekola |
oz |
129,933 |
354,647 |
570,000 – 600,000 |
|
Masbate |
oz |
49,902 |
164,041 |
215,000 – 225,000 |
|
Otjikoto |
oz |
35,068 |
101,546 |
165,000 – 175,000 |
|
B2Gold Consolidated (1) |
oz |
214,903 |
620,234 |
950,000 – 1,000,000 |
|
Equity interest in Calibre (2) |
oz |
12,113 |
39,770 |
40,000 – 50,000 |
|
Total |
oz |
227,016 |
660,004 |
990,000 – 1,050,000 |
Note: B2Gold holds 93.332 million shares in Calibre Mining (OTCQX:CXBMF), representing a 30.08% stake approximately. The company received 12,113 Au Oz from the Calibre Mine in the third quarter of 2022.
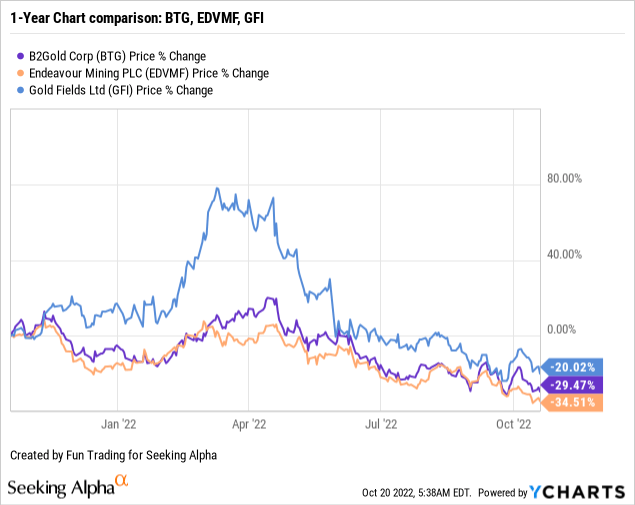
2 – Stock Performance
B2Gold is underperforming Gold Fields (GFI), which can be considered similar and is now down 29.4% on a one-year basis. The gold price is struggling with the strength of the US dollar and the Fed’s action again rampant inflation.
3 – Investment Thesis
BTG’s flagship Fekola mine is located in Mali, West Africa. Thus, assessing the risk of doing business in West Africa is crucial and should be factored into your investment imperatively.
The situation in Mali is getting normalized again after the recent announcement by ECOWAS of the removal on July 3, 2022, of the economic, financial, and diplomatic sanctions imposed on Mali in January 2022.
However, the situation is still tense, and on August 15, France announced the withdrawal of its last remaining forces from Operation Barkhane in Mali. In February, France said it would terminate the regional counter-terrorism operation in Mali because of escalating tensions with Mali’s transitional authorities.
Mali’s political transition to revive constitutional order is an ongoing critical issue. The new timetable for achieving the transition is March 26, 2024.
B2Gold’s Fekola mine is located in the Southwest part of Mali at the border with Senegal. The region is considered relatively safe.
BTG Fekola (BTG website)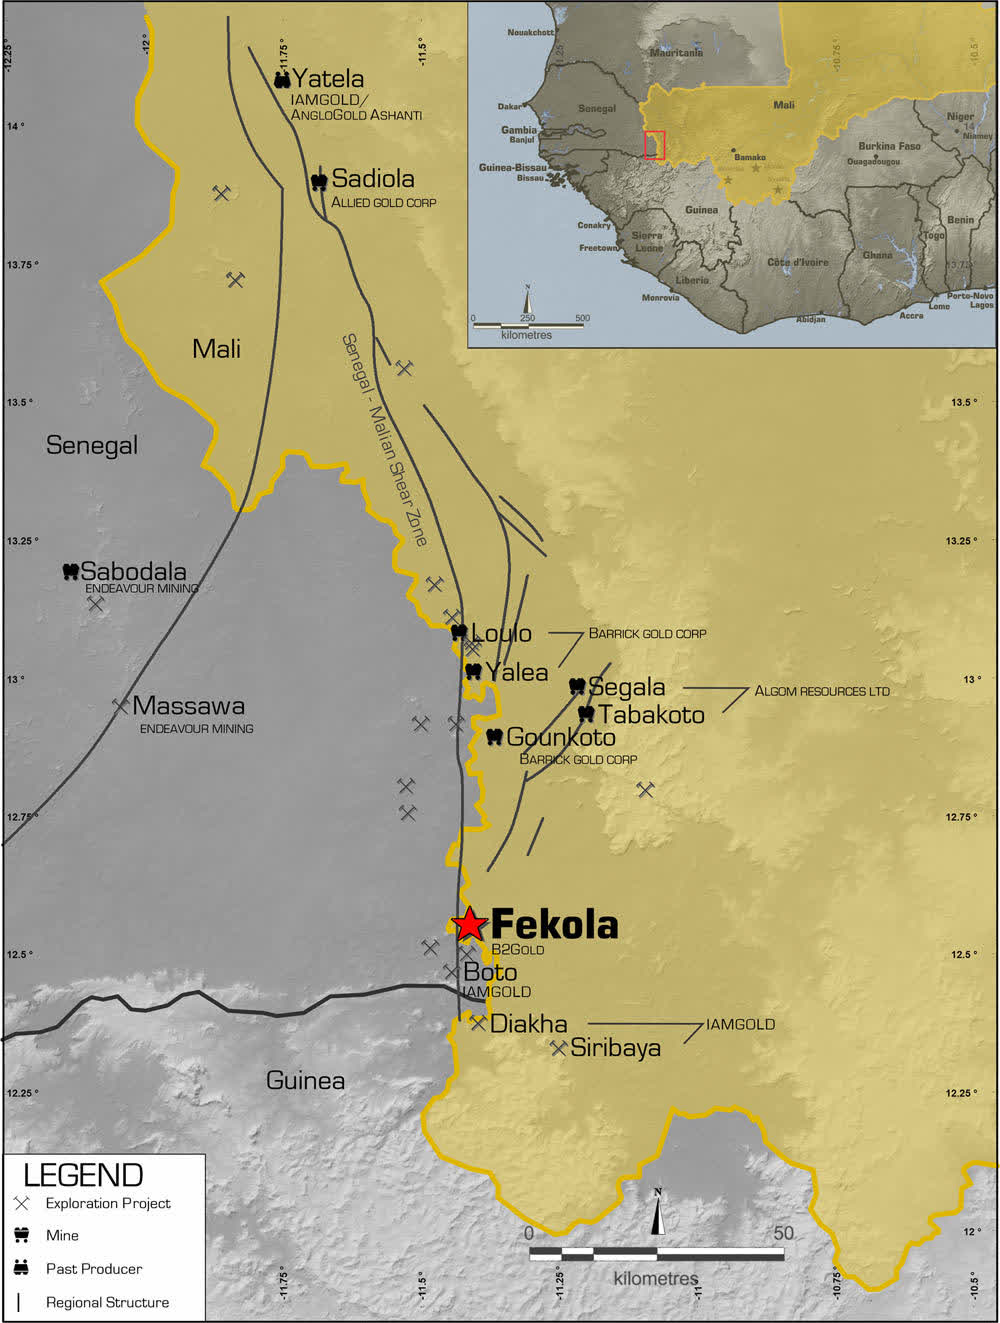
One working strategy that I often recommend for this sector in my marketplace, “The Gold and Oil Corner,” is trading LIFO about 50%-60% of your total position and keeping a core long-term position for a much higher payday.
The gold market is highly volatile and weakening due to the Fed’s hawkish action in response to very high inflation. The Fed is expected to hike interest by 75-point again in November.
Thus, trading LIFO allows you to take advantage of short-term volatility while positioning for a possible future uptrend.
B2Gold – 3Q22 Balance Sheet And Production Trend (Preliminary) – The Raw Numbers
| B2Gold | 3Q21 | 4Q21 | 1Q22 | 2Q22 | 3Q22 |
| Total Revenues in $ Million | 510.86 | 526.11 | 365.58 | 381.99 | 393.0 |
| Net Income in $ Million | 123.11 | 136.94 | 80.72 | 37.80 | – |
| EBITDA $ Million | 335.77 | 360.19 | 222.42 | 188.78 | – |
| EPS diluted in $/share | 0.12 | 0.13 | 0.09 | 0.04 | – |
| Cash from Operations in $ Million- | 320.28 | 266.29 | 107.31 | 124.88 | – |
| Capital Expenditure in $ Million | 63.56 | 112.50 | 67.97 | 132.49 | – |
| Free Cash Flow in $ Million | 256.73 | 153.79 | 39.39 | -7.62 | – |
| Total cash $ Million | 546.51 | 673.00 | 648.76 | 586.69 | – |
| Total Long-term Debt in $ Million | 29.58 | 75.10 | 72.7 | 66.6 | – |
| Dividend $/share | 0.04 | 0.04 | 0.04 | 0.04 | 0.04 |
| Shares outstanding (diluted) in Billion | 1.061 | 1.061 | 1.061 | 1.068 | – |
| Production | 3Q21 | 4Q21 | 1Q22 | 2Q22 | 3Q22 |
| Total Production gold | 310,261 | 304,897 | 209,365 | 223,623 | 227,016 |
| AISC from continuing operations/consolidated | 795 | 888 | 1,036 | 1,111 | – |
| Gold Price | 1,782 | 1,800 | 1,874 | 1,861 | 1,711 |
Data Source: Company press release
Analysis: Revenues And Gold Production
1 – Quarterly Revenues were $393 Million For 3Q22
BTG Quarterly Revenues history (Fun Trading) The company announced consolidated gold revenues of $393 million in the third quarter of 2022, down 23.1% from the year-ago period and up 2.9% sequentially (see table above for details and history).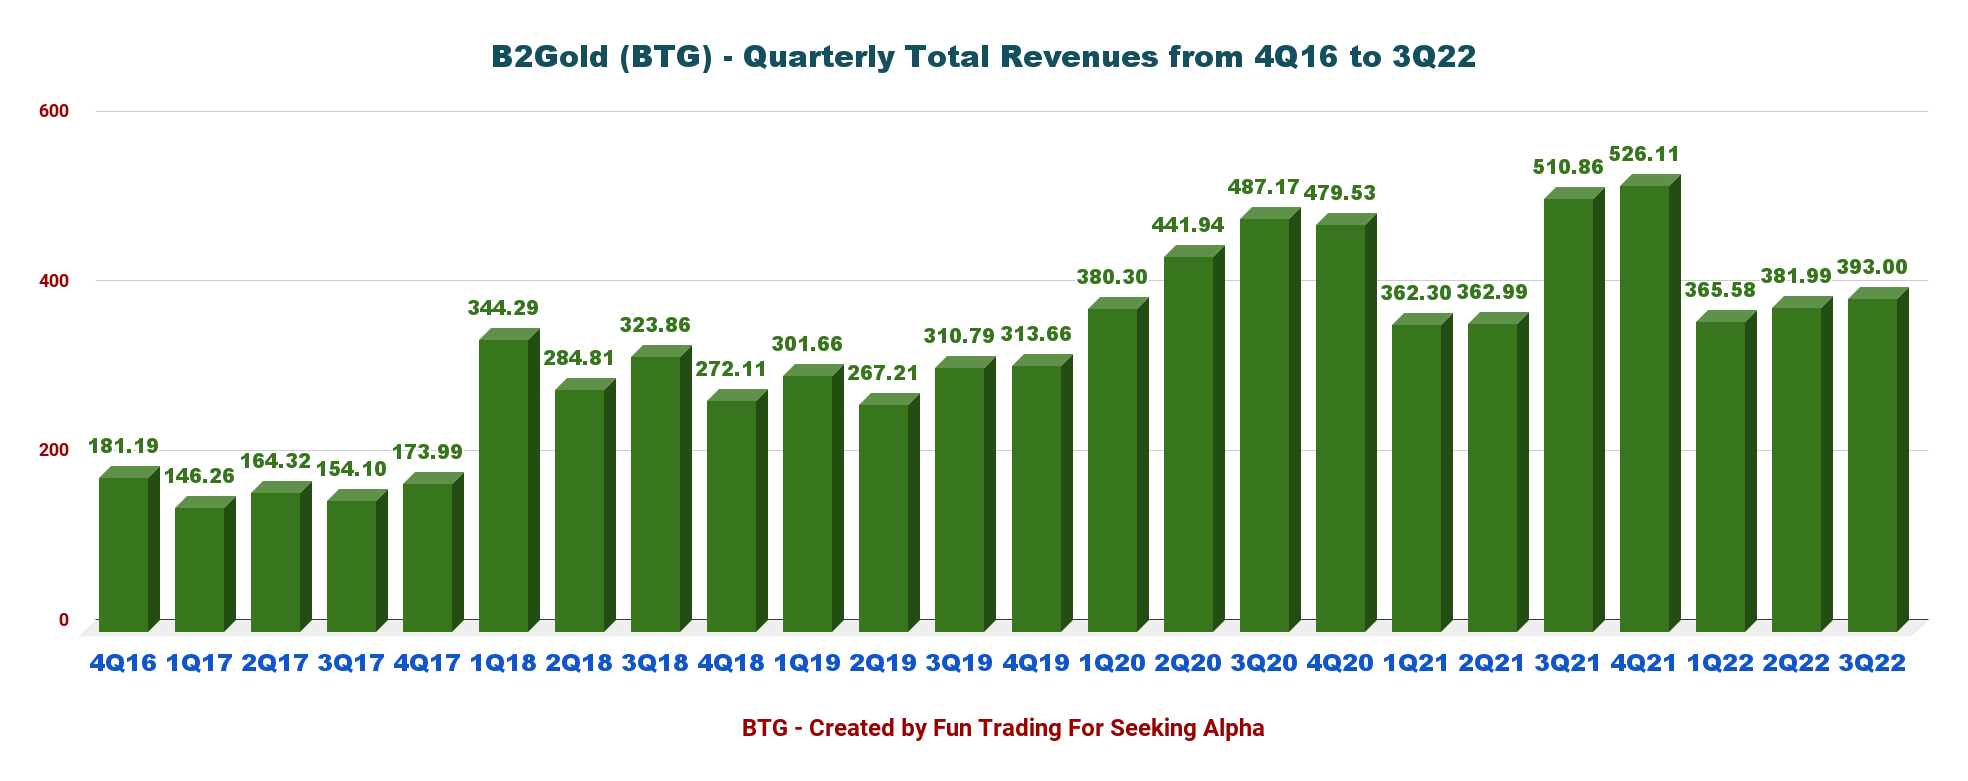
The gold price for 3Q22 averaged $1,711 per ounce, significantly below the $1,861 per ounce realized the previous quarter.
BTG Quarterly Gold Price history (Fun Trading)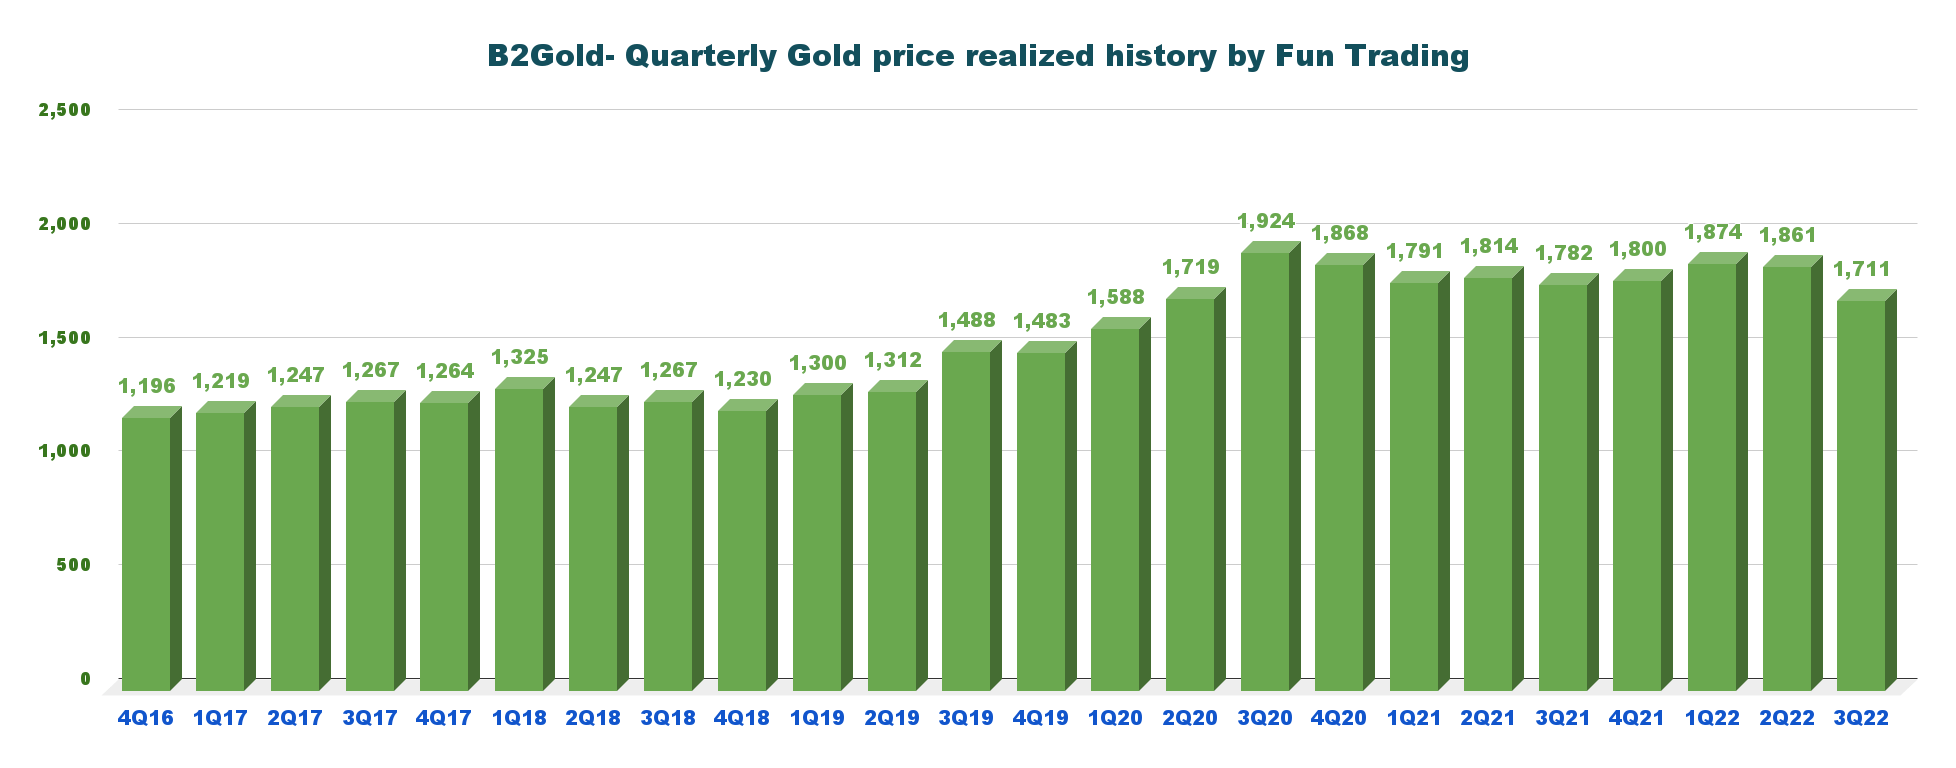
2 – Quarterly Production Analysis
Gold production for the third quarter of 2022 was 227,016 Au Oz (including 12,113 Au Oz at the Calibre Mine). The company sold 229,400 Au Oz in 3Q22.
BTG Quarterly Gold production history (Fun Trading) 2.1 – Production detail: Production comparison 2Q22 versus 3Q22 per mine BTG Quarterly gold production per mine 2Q22 versus 3Q22 (Fun Trading)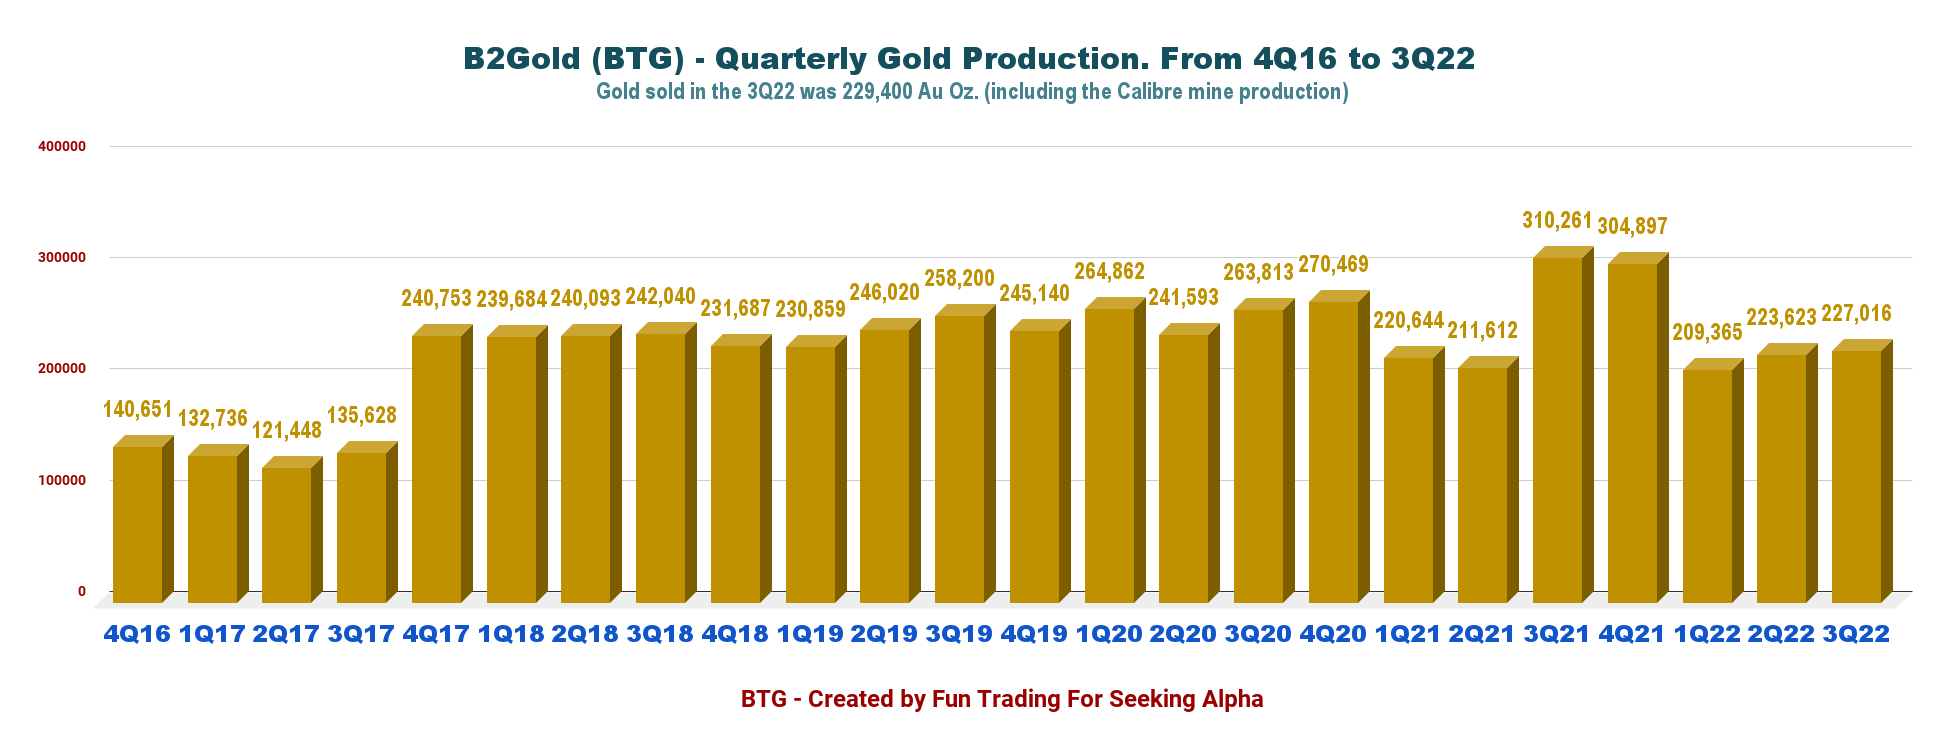
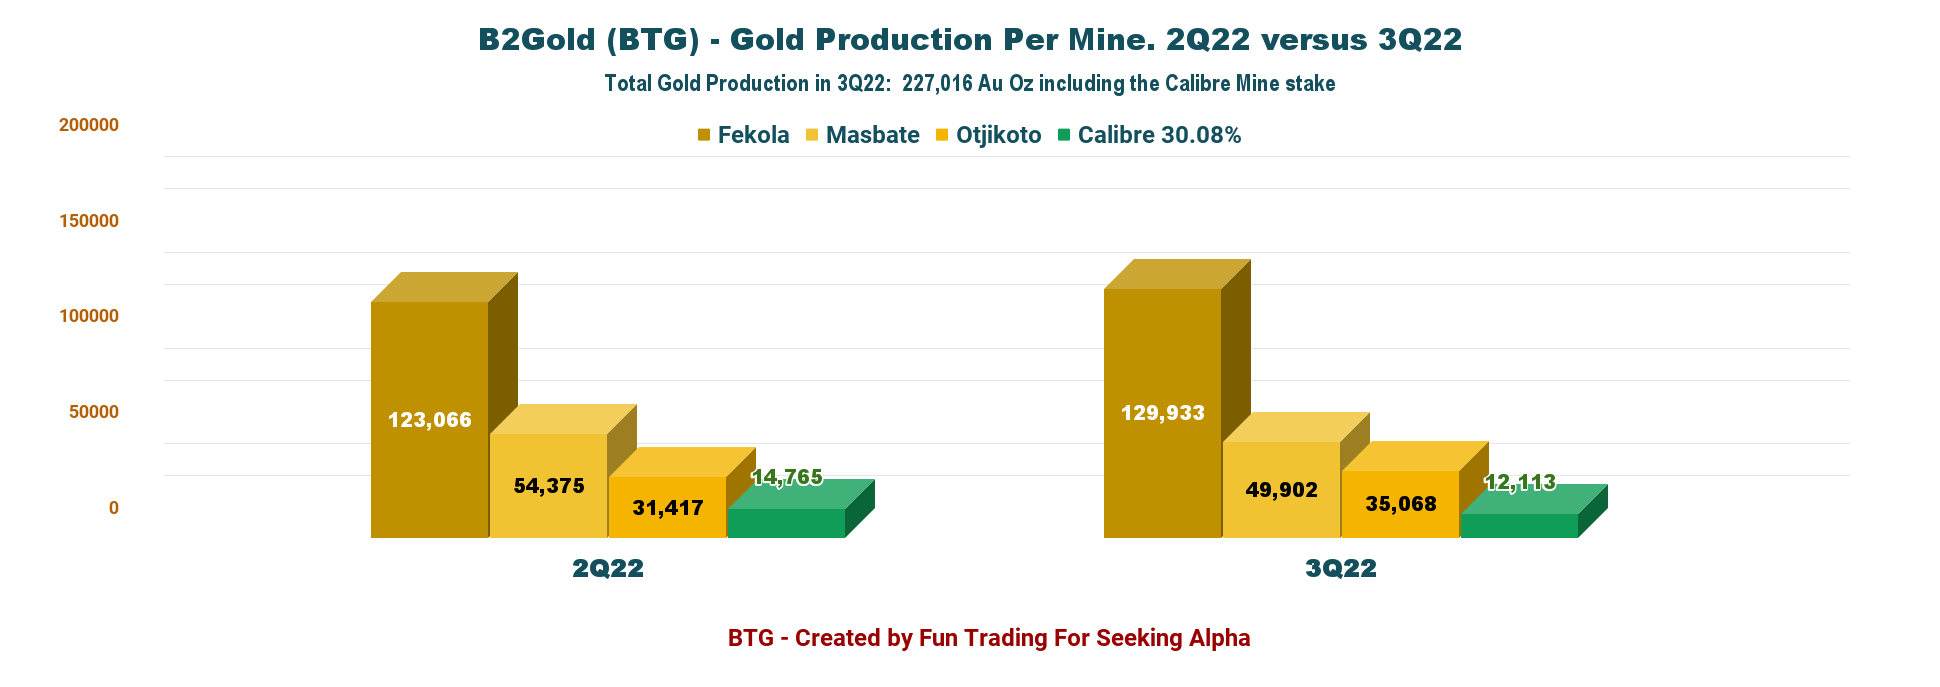
- The Fekola Mine In Mali: Gold production was 129,933 ounces in the third quarter of 2022. Fekola experienced a challenging rainy season which delayed access to higher-grade ore from Fekola Phase 6. The ore from Fekola Phase 6, which is currently mined in the fourth quarter of 2022, is anticipated to average between 3.4 to 3.5 grams per tonne (“g/t”) of gold.
BTG Quarterly gold production history (Fun Trading)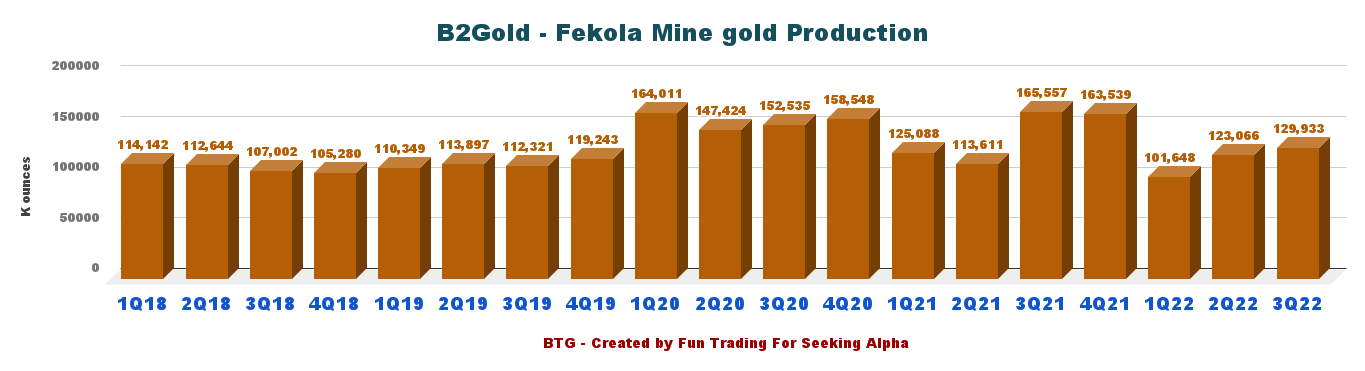
- Fekola Complex feasibility study underway to deliver low capital intensity production growth: BTG started a feasibility level engineering study of stand-alone oxide processing facilities at the Anaconda Area. The study will be based on processing at least 4 million tonnes per annum (“Mtpa”) of saprolite and transitional (oxide) resources, with an option to add new rock (sulfide) capabilities in the future. Results of this study are expected in the second quarter of 2023. Conceptual analysis indicates that the combined Fekola and Anaconda processing facilities could have the potential to produce more than 800K ounces of gold per year, commencing as early as 2026.
- The Masbate Mine In The Philippines: Gold production from the Masbate Mine was 49,902 ounces in the third quarter of 2022. Masbate remains on target to achieve the previously revised 2022 guidance of between 215K and 225K ounces of gold.
- The Otjikoto Mine In Namibia: Gold production from the Otjikoto Mine was 35,068 ounces in the third quarter of 2022, less than anticipated due to a delay in bringing the Wolfshag Underground mine into production. Gold production is forecast to increase significantly in the fourth quarter of 2022 when mining reaches a higher grade zone in the Otjikoto pit, and stope ore production commences from the Wolfshag Underground mine.
2022 Guidance Unchanged
For the full-year 2022, the company’s total gold production is expected to be between 990K-1,050K ounces (including 40K-50K attributable ounces projected from Calibre).
Total consolidated cash operating costs are between $620 and $660 per ounce, and AISC is forecast to be between $1,010 and $1,050 per ounce.
Technical Analysis And Commentary
BTG TA Chart short-term (Fun Trading)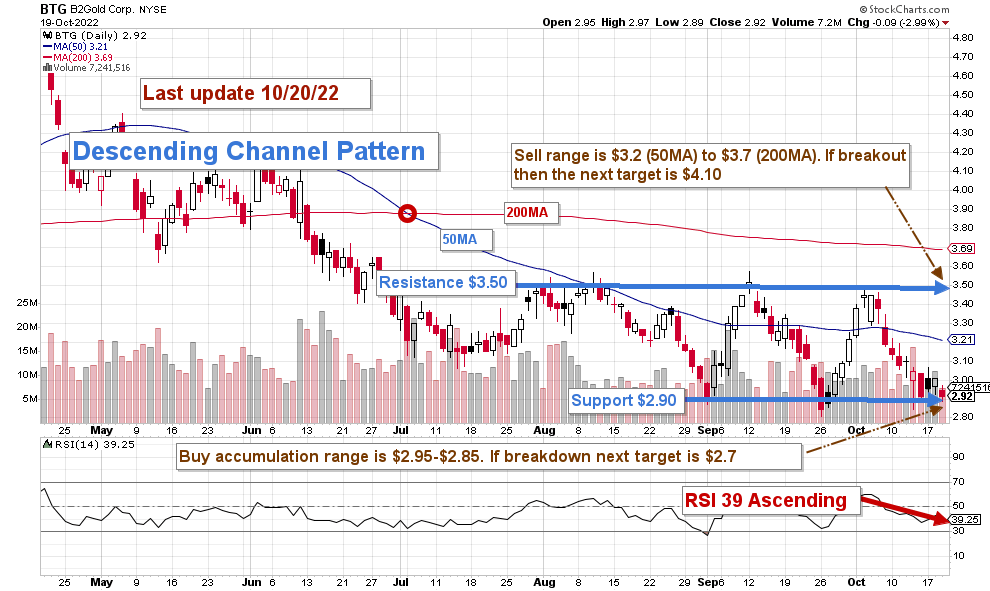
BTG forms a Descending Wedge pattern, with resistance at $3.50 and support at $2.90.
The short-term trading strategy is to trade LIFO for about 50%-60% of your position. I suggest selling between $3.20 and $3.70 with possible higher resistance at $4.10 and waiting for a retracement between $2.95 and $2.85 with possible lower support at $2.70.
The gold price has continued to drop in the past few weeks due to an elevated risk of a recession triggered by rampant inflation. Furthermore, the US dollar’s strength is also harmful. This situation forced the Fed to hike the interest rate three times, affecting the gold price and gold miners, tumbling from $1,850 per ounce to $1,630 per ounce.
BTG: Gold and silver 1-Year trend (Fun Trading StockCharts)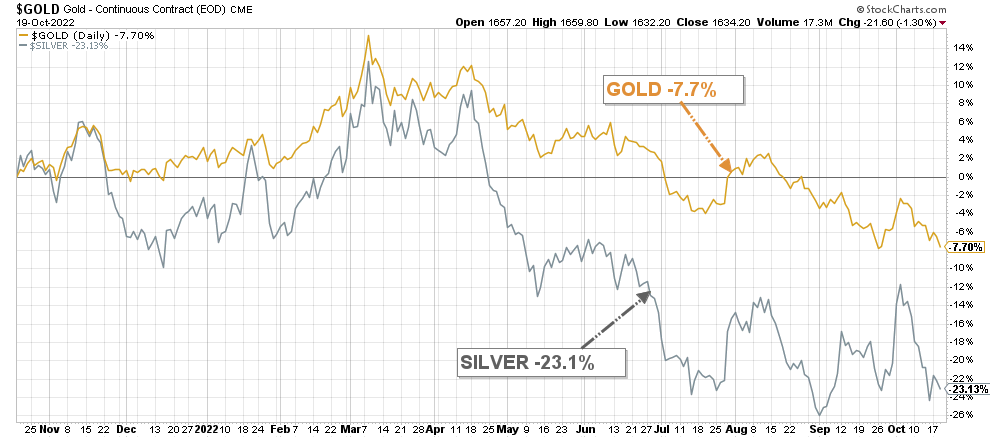
Note: The LIFO method is prohibited under International Financial Reporting Standards (IFRS), though it is permitted in the United States by Generally Accepted Accounting Principles (GAAP). Therefore, only US traders can apply this method. Those who cannot trade LIFO can use an alternative by setting two different accounts for the same stock, one for the long term and one for short-term trading.
Warning: The TA chart must be updated frequently to be relevant. It is what I am doing in my stock tracker. The chart above has a possible validity of about a week. Remember, the TA chart is a tool only to help you adopt the right strategy. It is not a way to foresee the future. No one and nothing can.
Author’s note: If you find value in this article and would like to encourage such continued efforts, please click the “Like” button below to vote of support. Thanks.
Be the first to comment