


cokada/iStock via Getty Images
Summary
Azul S.A (NYSE:AZUL) has grown into Brazil’s top domestic airline as it expanded from low density and high fair regional markets to main line cities in the wake of key bankruptcy such as Avianca Brazil and Latam’s (OTCPK:LTMAY) Chapter 11. From a growth and margin prospect Azul looks great. However, it fails to generate earnings or positive cashflow on very high debt financing costs. Hence, despite full traffic recovery to pre pandemic levels, Azul´s equity valuation is hindered by the inability to generate free cash flow and reduce leverage.
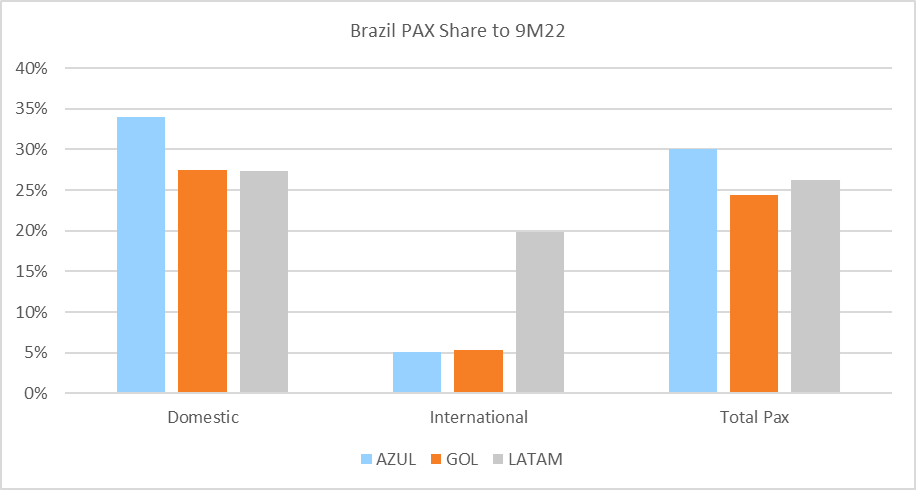
Brazil Air Traffic Market Share (Created by author with data from ANAC)
Positive: Traffic and Margins
Azul has fully recuperated from the pandemic with traffic at 100% the base 2019 level and reported 21% EBITDA margin in 3Q22 and guided for further gains as traffic grows and dilutes fixed costs. The company gained several slots at the key Sao Paulo domestic airport that should lead to 24% revenue growth in 2023 with solid margins as this is a high fair corporate market.
As can bee seen Azul’s business model of low density and high fair regional routes has led to exceptional margins. However, Azul should see growth slow in 2024 as it exhausts the normalization rebound impact and begins to grow with the overall market at 3x Brazil GDP.
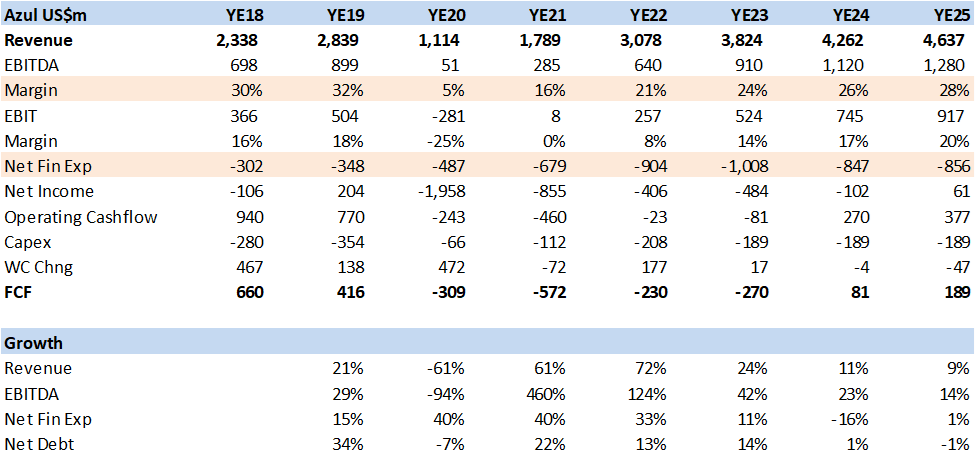
Financial Summary and Estimates (Created by author with data from Azul)
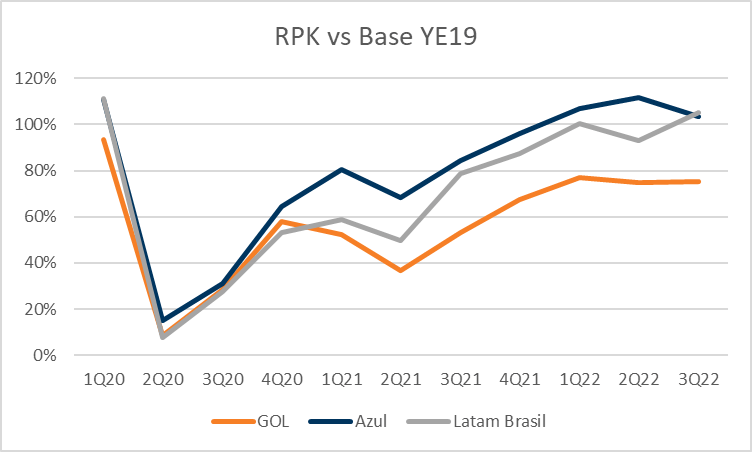
RPK Recuperation in Brazil vs Base 2019 (Created by author with data from Azul, Gol and Latam)
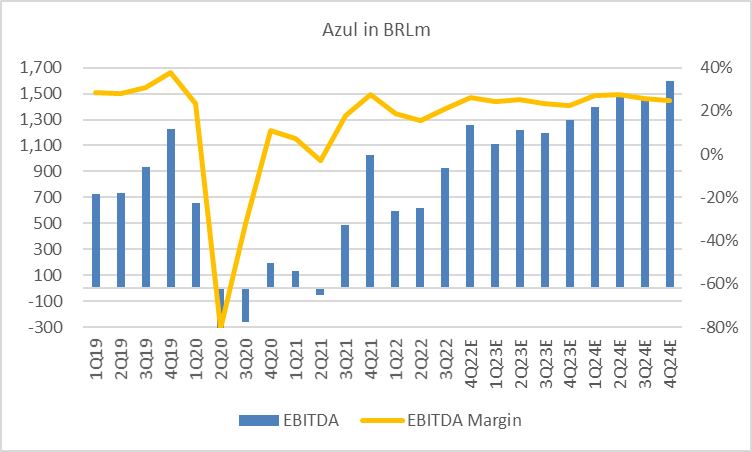
Azul EBITDA Estimates (Created by author with data from Azul)
Negative: Lease Debt Costs
Azul has recuperated traffic faster than peers and has attained higher fleet utilization that feeds into margins. However, these great revenue and EBITDA results are not enough to produce positive earnings or free cashflow.
The culprit is debt financial costs. Azul has R$23bn in total debt (including aircraft leases) for which it pays about 15% annually or R$3.8bn. This is greater than EBIT and EBITDA and effectively limits Azul’s ability to reduce debt, leverage and produce a positive equity valuation.
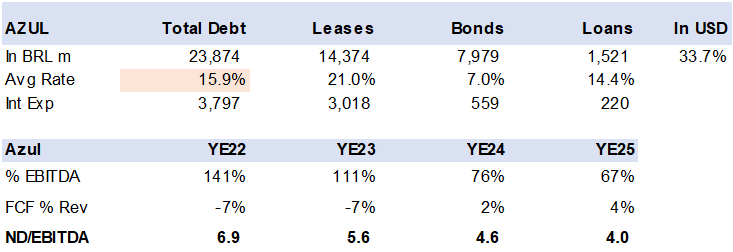
Azul Debt and Lease Breakdown (Created by author with data from Capital IQ)
A closer examination of Azul’s debt structure, one finds that about 50% of debts is in leases with a 21% annual interest rate while bonds are at 7%. Azul need to restructure its leases, which may not be an easy feat. The lease holders may impose penalties for early termination, they will also require the aircraft to be delivered with full maintenance checks that is also expensive and can drain cash flow. At the same time Azul needs to secure new aircraft to replace those exiting, which also carries high upfront costs.
Ultimately the reason for the high lease rate may be due to the low residual value of the aircraft that get discounted via lease rates. Azul fleet is composed of a variety of airplanes that include Embraer E1, E2, ATR turbo props and Cessnas along with older Airbus 320’s and new A320 Neo’s and A350. There is no easy fix to lease costs, a capital increase to buy out leases would be the best plan but unlikely given the share price. The stated strategy is to transition to all E2 and Airbus Neo’s by YE26 as presented at its recent Investor Day.
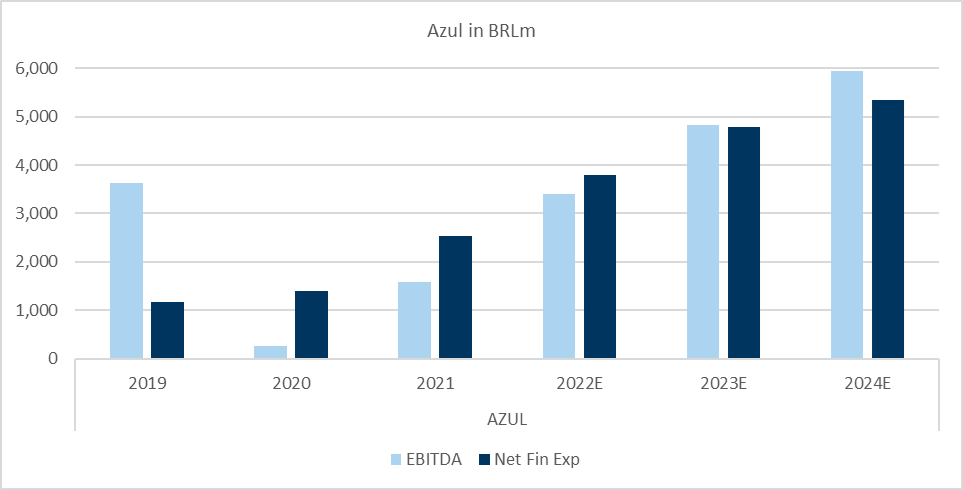
Azul EBITDA vs Net Financial Exp Estimates (Created by author with data from Azul)
Leverage is a risk factor
Azul is unlikely to be see relevant free cashflow until 2025 despite high EBITDA growth, which keeps leverage high along with risks from oil prices or FX (exchange rate) devaluation. Airlines have a significant portion of fixed cost and exposure to USD costs (fuel, maintenance, aircraft leases, capex etc.) while airfare price elasticity is dependent on domestic purchasing power. The two vectors often collide and result in lower demand and weak margins.
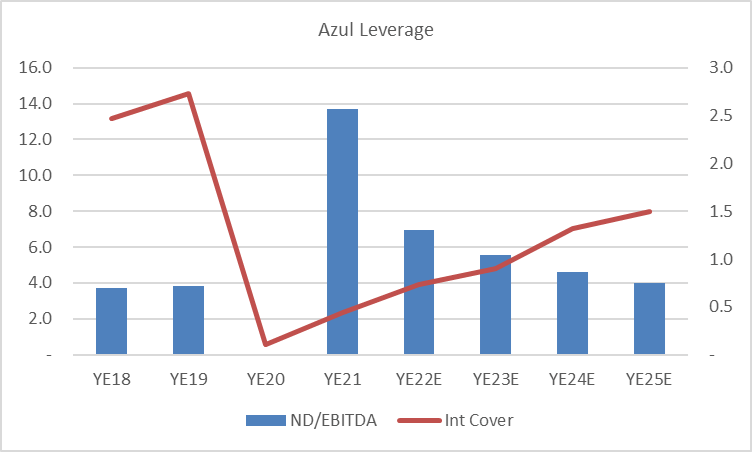
Azul Leverage Indicator (Created by author with data from Azul)
The Brazil Real or BRL has been and should continue to be volatile on political and macro risk. The Lula government is preparing to increase spending and drive up the budget deficit, which means higher rates and/or currency devaluation which is a major risk factor for emerging market Airlines.
It is very unlikely that Azul will be able to restructure debt at lower levels given and Azul’s high leverage and weak interest cover rations. In addition, Brazil’s non-investment grade debt rating should keep Brazil corporate in the high yield (junk) category.
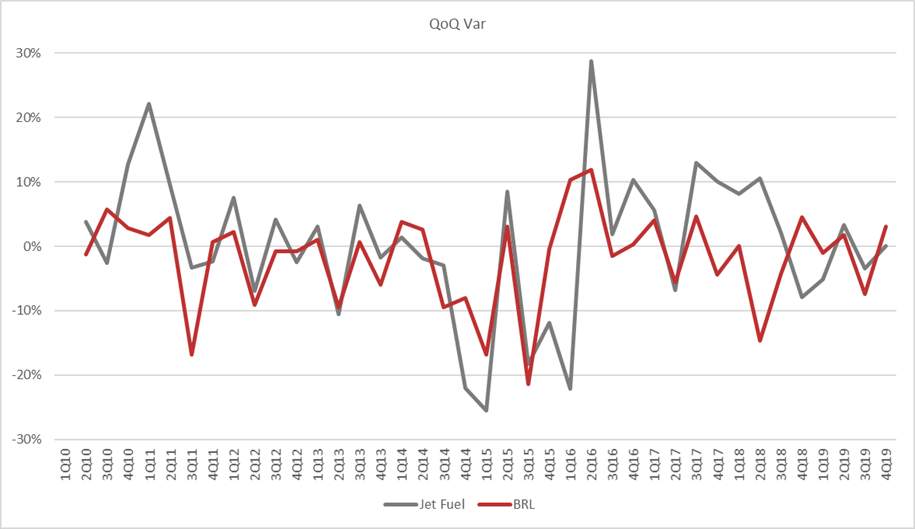
Brazil Real and Jet Fuel QoQ Volatility (Created by author with data from Capital IQ)
Valuation
Azul does not have upside in 2023, the high debt levels eat all equity value. I value Airlines on an EV/EBITDA multiple where EV (Enterprise Value) includes lease debt given that EBITDA does not have lease costs factored in. Azul traded at around 5x EV/EBITDA up to 2019 and then increased to 6x as it gained market share and demonstrated operating profitability. This multiple factors in the higher risk profile of emerging market airlines.
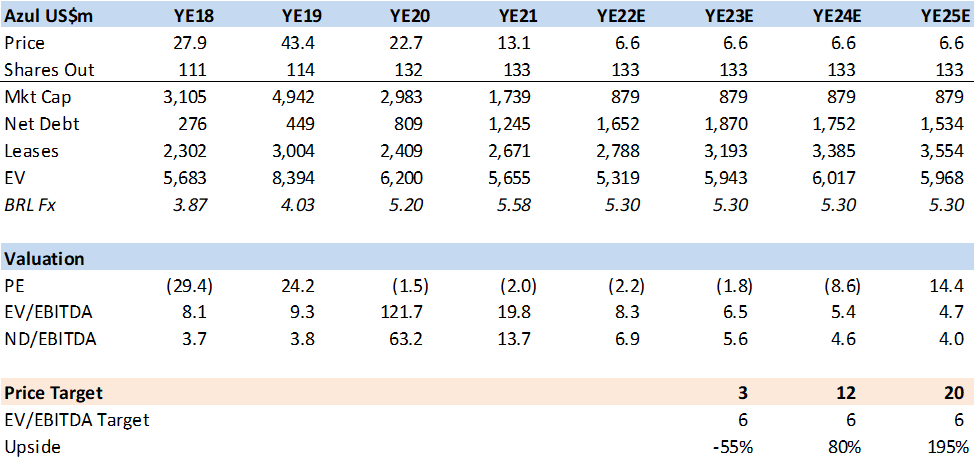
Azul Valuation Estimates (Created by author with data from Azul)
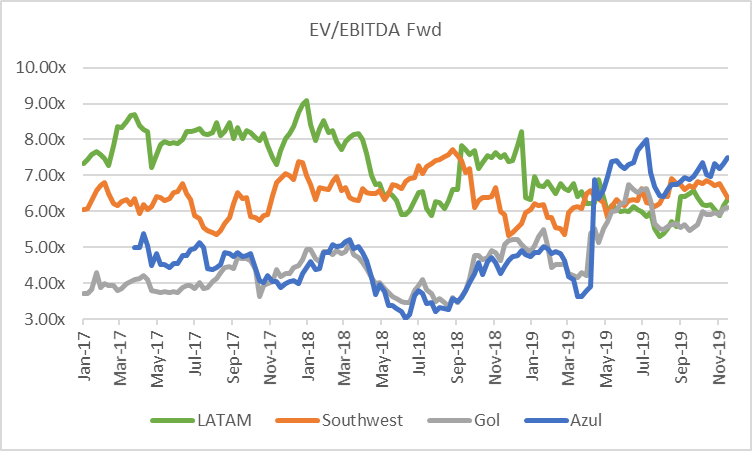
Azul Historic Fwd EV/EBITDA (Created by author with data from Capital IQ)
Conclusion
On my estimates, that are in line with consensus, Azul does not have upside in 2023 as debt cost eat into earnings, cash flow and keep leverage high. On an EV/EBITDA target multiple of 6x, the stock could see upside in 2024 and beyond, assuming the BRL does not devalue more than inflation. In my view, this is a poor risk-reward equation. A key catalyst would be lease restructuring or a capital increase.
Be the first to comment