

Justin Sullivan
By Valuentum Analysts
AT&T Inc. (NYSE:T) has taken investors on a wild ride the past couple of years, first saying it would support its payout as recently as early 2021, and then cutting it as it pulled a 180 on its strategic vision. However, in the communication giant’s third-quarter report, released October 20, AT&T showed robust free cash flow generation ($3.84 billion) that nearly doubled cash dividends paid in the period ($2.01 billion) – see image below. We liked this a lot as it reveals a marked improvement in coverage on a year-over-year basis! But could there be another disappointment ahead?
Image: AT&T’s dividend obligations have been substantially reduced, aiding in its coverage of the payout with free cash flow. (Image Source: AT&T)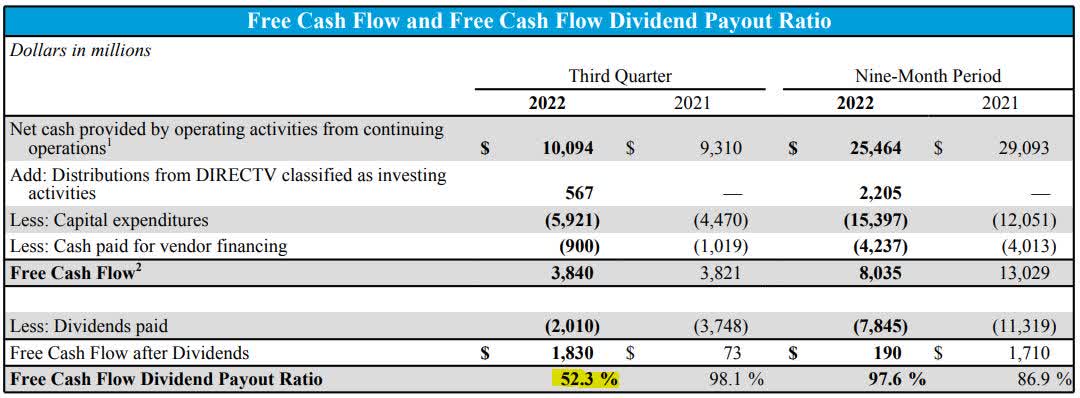
The Broader Economic Environment
The year 2022 started out with the popping of the bubble in the alternative investments arena – namely in the cryptocurrency (BITO), non-fungible token (NFT), and the collectibles markets – coupled with worries about the Fed raising interest rates to combat inflation and weakness in the most speculative equity areas, namely disruptive innovation stocks, such as in the ARK Innovation ETF (ARKK).
It’s important to note that the consumer price index (CPI) started to edge meaningfully higher in early 2021 (not this year). Though the writing was on the wall with respect to impending Fed tightening, as investors, we have to assess what the Fed will do and the impact on the markets, not necessarily what the Fed should do. We can’t confuse the two.
That said, as the market started to roll over this Spring due to a negative wealth effect from weakness in alternative investments and concerns about potential Fed activity, investors started to feel the pinch – and began to sell equities in some of the strongest areas, including big cap tech. We may have attributed this selling to margin calls in crypto across Silicon Valley, but the selloff was nonetheless notable.
When Walmart (WMT) and Target (TGT) warned about weakness earlier this year, however, we started to grow concerned that something might have “broken” in the economy. However, it wasn’t until Nike (NKE) released its earnings report on June 27, in which the athletic shoe and apparel giant revealed weak gross margins and a huge inventory build, that we grew very cautious.
A Massively Negative Wealth Effect May Be Ahead
The first page of AT&T’s 16-page stock report. (Image Source: Valuentum)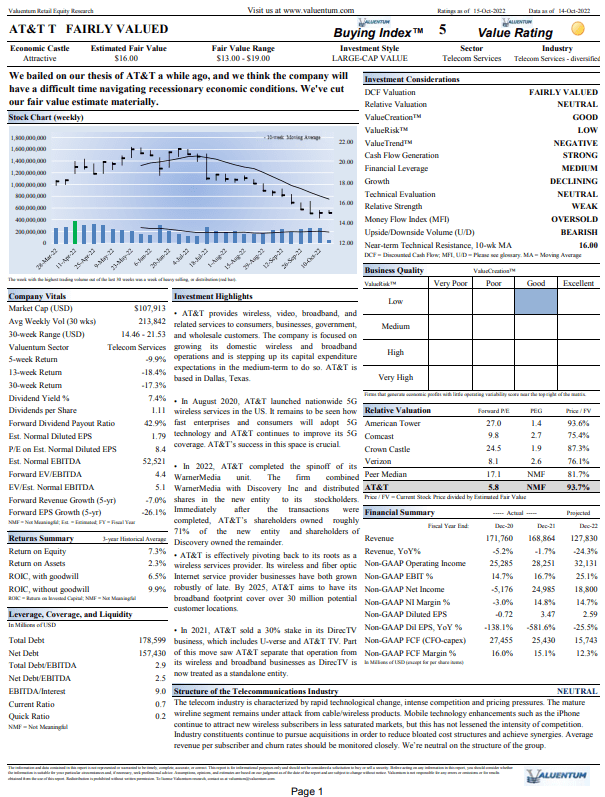
We went bearish on August 19, and we remain so today. We believe consumer discretionary spending is being punished by food cost inflation, and while it does look like food cost inflation is slowing a bit based on our channel checks, the damage to the economy may be lasting (and not easily and immediately fixed by rate cuts), particularly as investors reel from not only the negative wealth effect from collapsing alternative investment markets but also broader stock and bond markets.
The stark reality is that the 60/40 stock/bond portfolio is down ~20% so far in 2022, its worst year in history since 1931. The negative wealth effect from stock and bond markets so far in 2022 has yet to be felt in the economy, and the impact from increased mortgage rates on the U.S. housing market is still in the first inning, too, if we can even say that. Perhaps, more appropriately stated, the game has yet to start, and already, homebuilders such as Lennar Corp. (LEN), D.R. Horton (DHI), and PulteGroup (PHM) are off about ~30% so far this year.
We expect as much as a 20%, 30% correction in U.S. housing prices, and maybe more based on reduced affordability from higher interest rates. When consumers assess their balance sheets to see the rapid declines in alternative assets, the weakness of stocks and bonds, and then how fast the U.S. housing market has eroded, it’s going to have a multiplicative negative impact on consumer confidence and spending, all the while food-cost inflation remains elevated. Much of this impact is still ahead of the markets, and it probably won’t be felt in the economy until another 6-12 months.
The uncertain economic climate coupled with inflationary pressures on consumers, not to mention an increased competitive environment, leave us decidedly on the sidelines with respect to AT&T’s shares. AT&T showcased 708,000 postpaid phone net adds and 338,000 Fiber net adds in the third quarter, and while both wireless and broadband revenues advanced during the period, the economic environment could be at the precipice of a huge pullback in consumer discretionary expenses – meaning this strength and optimism is likely short-lived.
The huge problem with AT&T, not unlike that of other high dividend yielders out there, is its massive net debt position, which stood at $131.1 billion at the end of the quarter, implying a net-debt-to-adjusted EBITDA ratio of 3.22x. This isn’t extraordinarily high for a company of AT&T’s caliber, but it does signal a company that remains hugely overleveraged due to the capital intensity of its operations. Thanks to $4-$6 billion in targeted run-rate cost synergies by the end of this year, however, AT&T noted that adjusted EPS from continuing operations for the full year is now targeted at $2.50+, a decent bump from its prior outlook.
Our Fair Value Estimate of AT&T
The image above shows how the theoretical underpinnings of the P/E ratio rest in enterprise valuation. The numerator is the enterprise valuation model, which arrives at a per-share fair value estimate (price), while the denominator is next year’s earnings per share. (Image Source: Value Trap)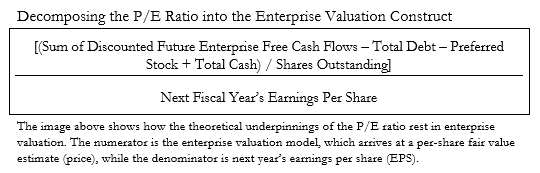
The discounted cash flow (DCF) model gets a lot of criticism these days, but it’s still the best way to look at companies. For starters, we may never know, or rather can never know, with precision the exact intrinsic value of a stock because of the forward-looking nature of forecasts and the subjective substance of estimating discount rates, among other future considerations. To be successful, the analyst, however, does not have to know the true intrinsic value with precision.
The goal of enterprise valuation in stock analysis, or valuation approaches in equity investing, more generally, is not to pinpoint precisely what a company’s stock is worth. This is impossible. Where most criticism of enterprise valuation rest is that the output of the process, the fair value estimate, is very sensitive to several key future assumptions and forecasts.
However, the very idea that those future forecasts are difficult to predict is consistent with the concept of pricing volatility, as future market expectations iterate over and over again, and logically defines enterprise valuation as an important causal pricing framework. Market volatility can be explained in part by changes in expected growth rates, interest rates, tax rates and other key drivers of the enterprise process.
That these assumptions are ever-changing and that prices are ever-changing is an important logical link. If, on the other hand, everybody knew the future, and therefore, the exact intrinsic value of stocks, we wouldn’t see much volatility in the markets at all. Stocks would, or rather should, trade at their “known” fair values. The fair value estimate sets the anchor for prices.
In some ways, it is the imprecision and sensitivity of enterprise valuation that may offer a core analytical advantage. In evaluating the sensitivities of certain drivers behind the company to changes in forward assumptions, one gets a feel for the valuation impact of a change in a particular driver. For example, a one-percentage-point change in the mid-cycle operating-margin assumption for a company such as Amazon (AMZN) could have widespread implications on an intrinsic value estimate given the company’s significant earnings leverage and sensitivity to small changes in its operating margin.
The same one percentage point change in the mid-cycle operating-margin assumption for a company such as Microsoft (MSFT), however, could be immaterial. The analytical inferences of assessing such sensitivities not only explain how changes in value occur, their drivers, but also why the share prices of some stocks are more volatile than others as a result.
To focus on precision in value estimation is folly, and it is neither the goal nor even the endeavor to pursue precise value estimation, as it is unreasonable to believe that even the most talented analysts can get every future assumption “correct” within the enterprise framework. Even if the analyst did get everything “correct,” the stock price may still not fully converge to that estimated intrinsic value if the market simply disagrees.
Incidentally, this is why paying attention to the information contained in share prices matters, even for value-focused investors (more on this later). In instances where price-to-estimated fair value convergence may never occur, however, it still is helpful to use the enterprise valuation framework to understand the drivers behind security pricing, and to arrive at a better understanding of the behavior of a subset of active management, or those that apply extensive discounted cash-flow modeling as a key driver of buying and selling activity, which causes price changes.
It should not reduce the utility of enterprise valuation even if one fully embraces the criticism that the future enterprise free cash flows of an entity will always be unpredictable to varying degrees. The future enterprise free cash flows of consumer staples stocks such as Coca-Cola (KO) or Kimberly-Clark (KMB) may be steadily growing, and analysts may be able to estimate such future enterprise free cash flows with only a very slight margin of error when they are reported.
On the other hand, the future enterprise free cash flows of a fast-growing Internet darling such as Meta Platforms (META) or Alphabet (GOOG) (GOOGL) may result in a much larger disparity between future projections and actual results when they come in. Therefore, it is only reasonable to assume that the analyst may require a much larger share-price discount to estimated intrinsic value in considering an investment in Meta Platforms or Alphabet than for Coca-Cola or Kimberly-Clark.
Let’s now talk about AT&T. On the basis of our discounted cash flow process, we think AT&T is worth $16 per share with a fair value range of $13-$19. The margin of safety around our fair value estimate is driven by the firm’s LOW ValueRisk rating, which is derived from an evaluation of the historical volatility of key valuation drivers and a future assessment of them.
Our near-term operating forecasts, including revenue and earnings, do not differ much from consensus estimates or management guidance. Our model reflects a compound annual revenue growth rate of -7% (negative 7%) during the next five years, a pace that is lower than the firm’s 3-year historical compound annual growth rate of -0.4%.
Our model reflects a 5-year projected average operating margin of 20.7%, which is above AT&T’s trailing 3-year average. Beyond year 5, we assume free cash flow will grow at an annual rate of 1.9% for the next 15 years and 3% in perpetuity. For AT&T, we use a 7.7% weighted average cost of capital to discount future free cash flows.
AT&T’s Weighted Average Cost of Capital (Image Source: AT&T)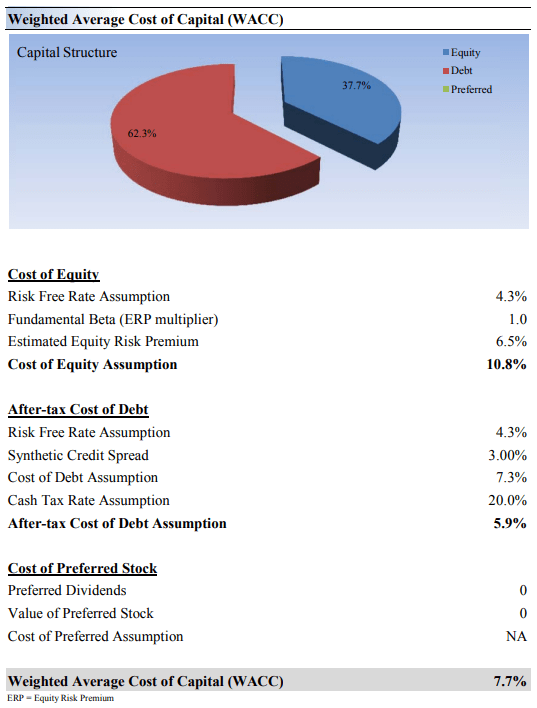
The Importance of a Margin of Safety
The concept of a margin of safety is well-documented in the writings of Benjamin Graham and the works of his student Warren Buffett. A stock trading at $50 per share, for example, but estimated to be worth $100 per share may offer the investor an adequate margin of safety because, even if the true intrinsic value of the company is $75, the large difference between price and the estimated fair value offers the investor a very important safety-net against losses.
Whether the market ever comes to price the stock at $75, however, is another thing altogether, and a consideration that makes observing price activity and the information contained in prices all the more relevant. Graham and Buffett’s margin-of-safety framework can be further extrapolated to view equity valuation in the context of a range of fair value outcomes or a cone of fair value possibilities, with the fair value estimate being the most likely probability along a fair-value distribution function.
For example, it may not necessarily be accurate to say that a company is worth precisely $25 per share, when the stock is likely worth somewhere between $20-$30 per share, and it may not be truly undervalued or overvalued, respectively, until it breaches these bounds around the fair value estimate. But why? Well, an analyst can only estimate what a company’s future enterprise free cash flow stream will look like.
Certain factors will hurt that enterprise free cash flow stream relative to forecasts, while other factors will boost performance relative to expectations. That’s how a downside fair value estimate and an upside fair value estimate could be generated to form a fair value estimate range of $20-$30 in this discussion. Value can never be a precise point fair value estimate because the future cannot be predicted with precision. Now let’s look at AT&T’s margin of safety.
AT&T’s Fair Value Range (Image Source: Valuentum)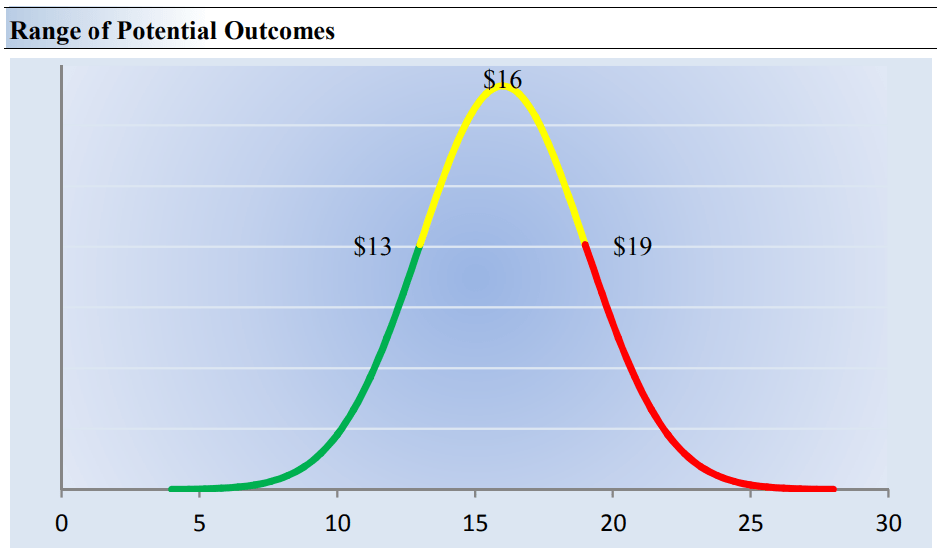
Though we estimate AT&T’s fair value estimate at about $16 per share, every company has a range of probable fair values that are created by the uncertainty of key valuation drivers (such as future revenue or earnings, for example). After all, if the future were known with certainty, we wouldn’t see much volatility in the markets as stocks would trade precisely at their known fair values. Our ValueRisk rating sets the margin of safety or the fair value range we assign to each stock.
In the graph above, we show this probable range of fair values for AT&T. We think the firm is attractive below $13 per share (the green line), but quite expensive above $19 per share (the red line). The prices that fall along the yellow line, which includes our fair value estimate, represent a reasonable valuation for the firm, in our opinion.
The discounted cash flow model gets a lot of criticism these days, but it is the best way to estimate the intrinsic value of a company, in our view. Multiples suffer as they use single-year snapshots of a particular metric, and those that use multiples make all the assumptions of a DCF in one fell-swoop because every multiple can be expanded to a DCF. Those that use multiples instead of the DCF may not even know they are implicitly using the DCF whenever they assign a multiple to a stock!
AT&T’s Dividend Health Remains Strained Due to Its Massive Net Debt Position
Dividend Cushion Deconstruction (Image: Valuentum)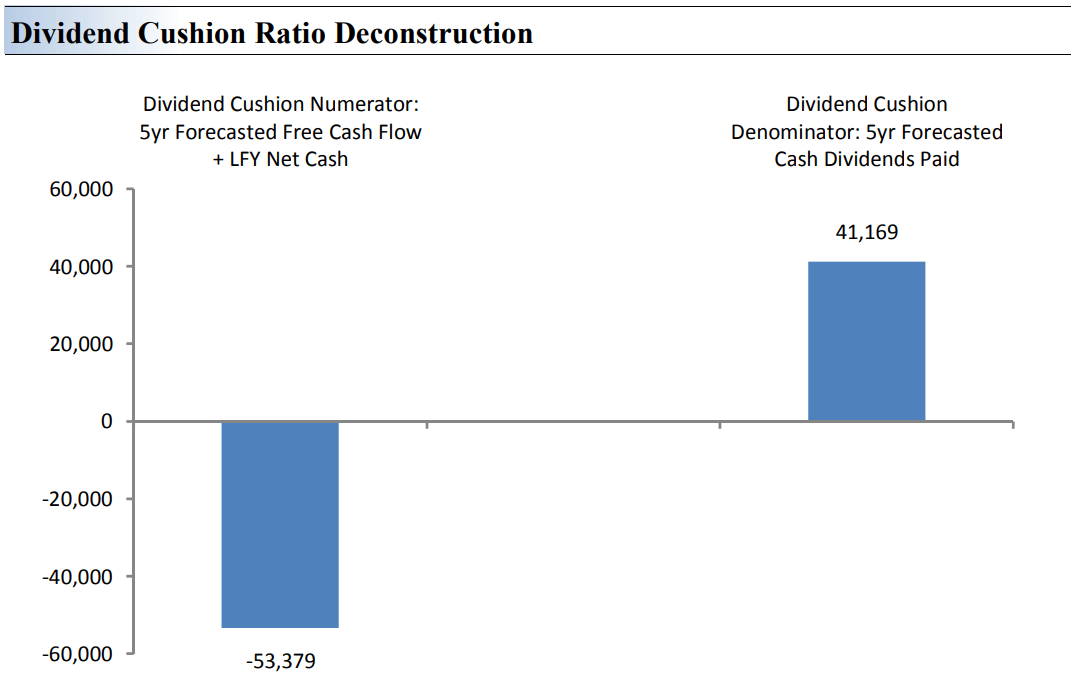
AT&T’s free cash flow generation in the third-quarter of 2022 was good enough to significantly cover the cash dividends paid in the period, generating a free cash flow dividend payout ratio of 52.3% versus 98.1% in the same period a year ago. Though its massive net debt position will continue to weigh on its Dividend Cushion ratio, AT&T’s free cash flow coverage of the dividend is looking much better these days. However, its dividend health remains strained.
The Dividend Cushion Ratio Deconstruction, shown in the image above, reveals the numerator and denominator of the Dividend Cushion ratio. At the core, the larger the numerator, or the healthier a company’s balance sheet and future free cash flow generation, relative to the denominator, or a company’s cash dividend obligations, the more durable the dividend. In the context of the Dividend Cushion ratio, AT&T’s numerator is smaller than its denominator suggesting weak dividend coverage in the future.
The Dividend Cushion Ratio Deconstruction image puts sources of free cash in the context of financial obligations next to expected cash dividend payments over the next 5 years on a side-by-side comparison. Because the Dividend Cushion ratio and many of its components are forward-looking, our dividend evaluation may change upon subsequent updates as future forecasts are altered to reflect new information. AT&T’s Dividend Cushion ratio stands at -1.3x, which remains strained due to its huge net debt position of $131 billion at the end of the third quarter. Net debt is subtracted from the numerator in the calculation of the Dividend Cushion ratio.
The Calculation of the Dividend Cushion Ratio (Image Source: Valuentum)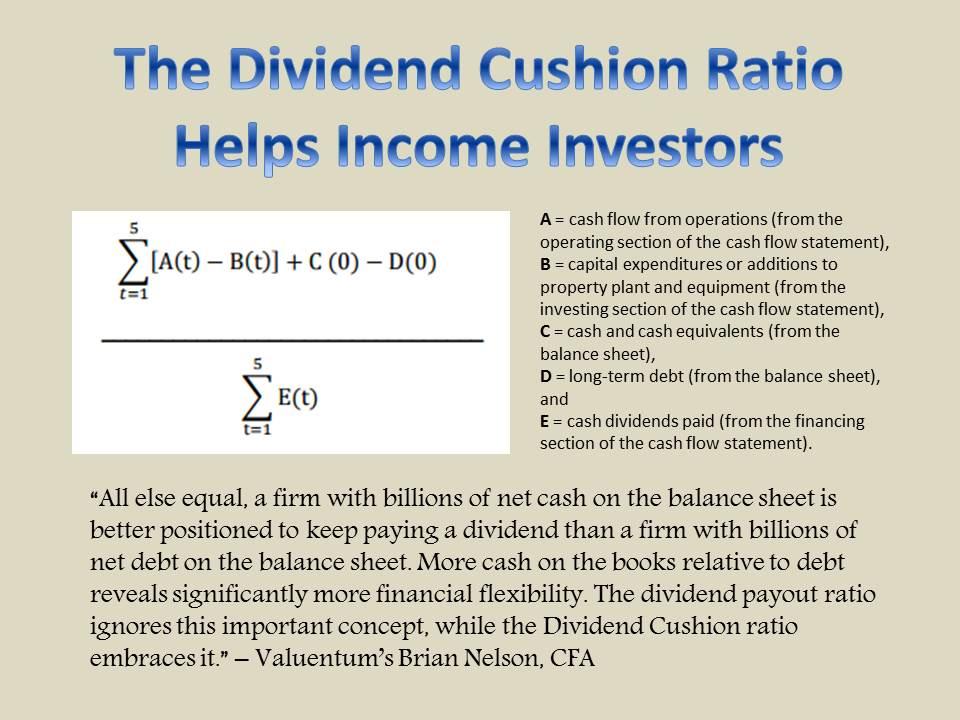
Concluding Thoughts
AT&T has a lot to prove these, and CEO John Stankey has said as much. The WarnerMedia acquisition and spinoff (WBD) have left a sour taste in many an AT&T investor’s mouth and while we liked the improvement shown in AT&T’s third-quarter 2022 results, we’re not looking to add the shares to any of the newsletter portfolios at this time due to the broader economic environment and the company’s weak Dividend Cushion ratio. Our fair value estimate of AT&T stands at $16 per share, and its Dividend Cushion ratio is decidedly negative. Shares yield ~7.1% at the moment.
This article or report and any links within are for information purposes only and should not be considered a solicitation to buy or sell any security. Valuentum is not responsible for any errors or omissions or for results obtained from the use of this article and accepts no liability for how readers may choose to utilize the content. Assumptions, opinions, and estimates are based on our judgment as of the date of the article and are subject to change without notice.
Be the first to comment