

bjdlzx
The communications sector is having a rough year, trading at nearly the very bottom end of its 52W range. Pundits noted back in March that within that sector, software and entertainment stocks were overpriced, having since fallen sharply.
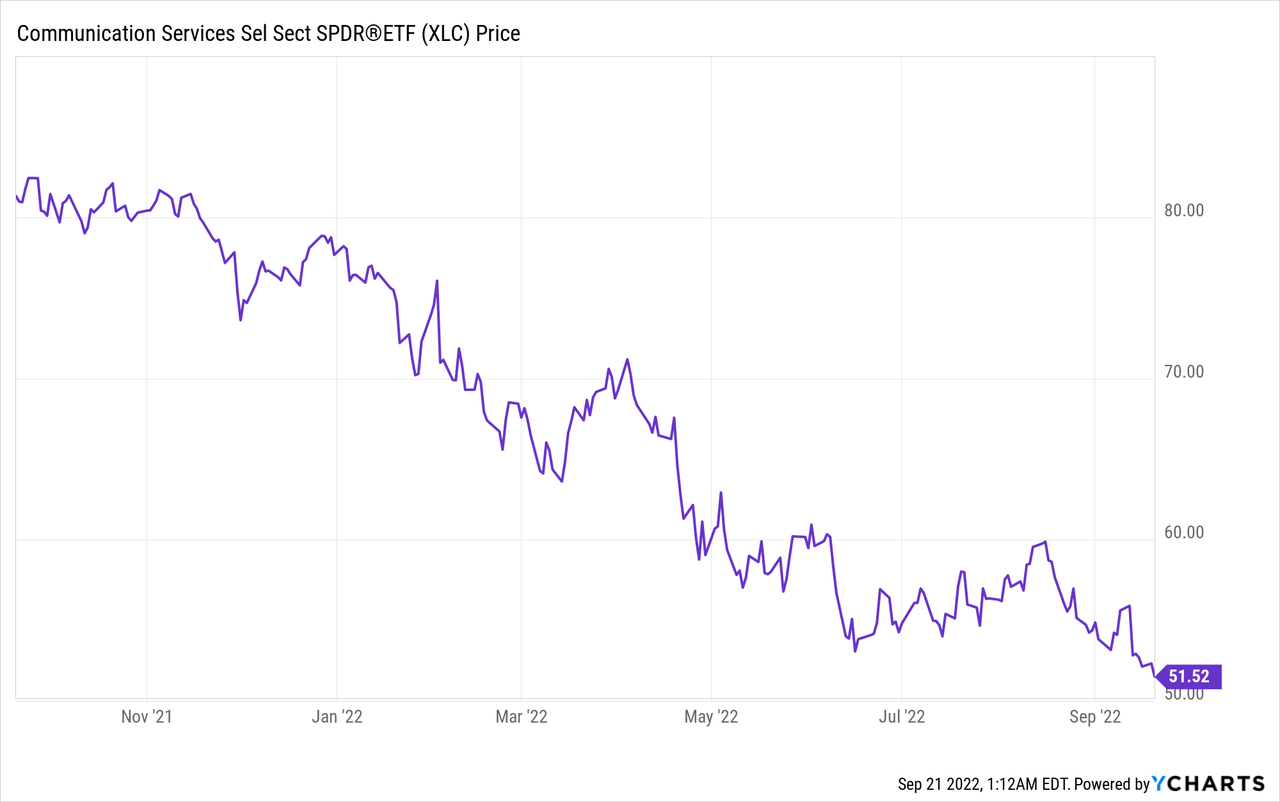
But within the communications sector, there are potentially some hidden gems. Firms focused on telecommunications now appear very attractively priced, and several large firms within the space are appearing to be bargain buys.
Looking externally, Deloitte recently published their “2022 Telecom Industry Outlook” perspective, which highlighted that among growing competition within the industry, the roll-out of 5G and decentralized funding of broadband infrastructure means great opportunities for solution providers.
Today we’ll be looking at a behemoth of the telecom industry, AT&T Inc. (NYSE:T), the second largest by enterprise valuation and largest by market average volume of trade.
For those unfamiliar with my methodology of peer comparison analysis, I’ll break it down for you, step by step as we go, and explain how I look at firms, assess their financial health, their valuation attractiveness and finally, how I come about finding a pricing mechanism based on a peer comparison.
(Data & prices correct as of pre-market 20th September 2022.)
(Top Integrated, Wireless & Alternative Telecommunication Services Stocks referred to can be found on this Seeking Alpha screener.)
Want to skip the analysis & go straight to finding out who had the best (or worst) valuations in Oil & Gas? Download my research for free here.
AT&T Inc.’s Base Financial Health
To start any analysis, I like to begin by getting an “at a glance” view of the firm’s financials with some key metrics, and compare those metrics to the rest of the firm’s peers (as industries typically have similar balance sheet profiles regarding debt, margins, and obligations).
This helps us understand the firm’s financials both as an individual entity, and in the context of its peer group.
Starting with base financial health, we’re looking at the firm’s ability to withstand a “worst case scenario” through the quick ratio, the level of debt carried by the firm and a look at profitability margins.
Next we look a little deeper at the firm’s debts and obligations, looking to see if the firm is choked by repayments and if it could quickly liquidate assets to reduce liabilities.
Next is dividends and the firm’s coverage of dividend payments, particularly because we’re interested in whether it’s likely that those dividends are likely to continue.
Lastly, we take a glance at the firm’s future outlook to see how management expects the firm to grow both its top-line and bottom-line results, and again comparing to the industry.
For AT&T, there is some concern around the firm’s quick ratio (the acid test), which bear in mind is a worst-case scenario metric, but we see the firm does not have its obligations covered in the event of a sell-off.
Largely speaking though, AT&T’s finances look solid, though I do note negative revenue and earnings outlooks, but the firm is a high-performer in the industry for both net and gross margins.
Author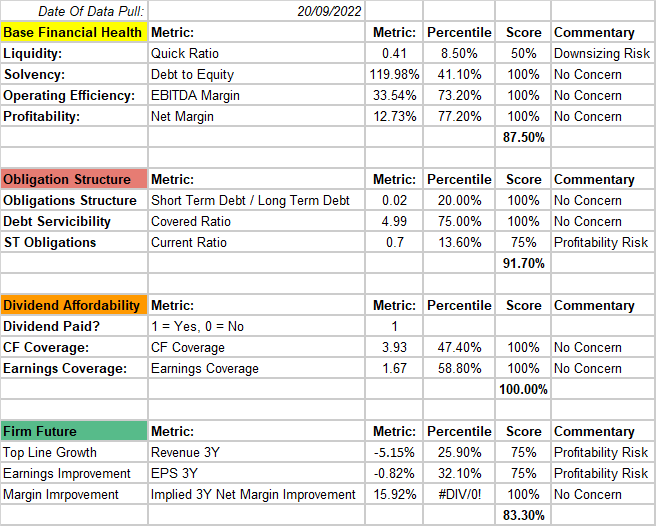
Next step is to apply weights to these scores and tally up an overall score for the firm. These weights are relatively arbitrary based on my own opinion on how important I believe each element is to a firm’s financial health.
An overall score of 89.4% is good, but not great, with some issues in base financial health and the firm’s outlook, but we rate the firm as relatively safe in a normal operating environment.
Author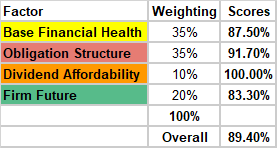
Assessing AT&T Inc.’s Pricing Attractiveness
So the next question investors should consider is how expensive is the firm relative to the industry peer group. It’s important to note, though, that finding the firm’s valuation attractiveness is not the same as trying to price the firm, but there is certainly a correlation.
We take each of the below metrics and apply a score as follows:
Score = 1 – Percentile Rank Vs Peer Group
This tells us how cheap a firm’s valuation metrics are (i.e., a score of 64% indicates the firm is in the 64th percentile lowest valuation by this metric). Next we apply some weights to these scores (again, relatively arbitrarily) in order to get a weighted score and an indication of whether we think a firm is cheap or expensive against the peer group.
A 50% score would indicate that the firm is “fairly valued,” under 50% indicates a firm might be expensive, and over 50% indicates the firm might be underweight in its price.
Here we see some good scores across the board for AT&T, with a valuation attractiveness score of 65.8% telling us that there might be some good value on offer here.
Author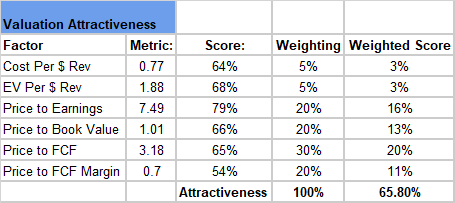
Finding An Appropriate Valuation Method For AT&T Inc.
Lastly, and probably the part investors are most interested in, is answering the question, “Is there a mispricing risk here we can take advantage of?”
First off, we look at a list of normal and abnormal valuation metrics to get a sense of how the market prices firms within the industry. We also look at how accurate the metric itself is at pricing firms within the industry by checking the correlation between the metric and price to sales, and market capitalization.
We also consider the variation of the metric vs. pricing to get an understanding of how “noisy” a metric is (more noise – less useful). Note that we’re interested in correlations that are negative OR positive, given prices are 2 dimensional and we can take advantage of price movements in both directions.
Author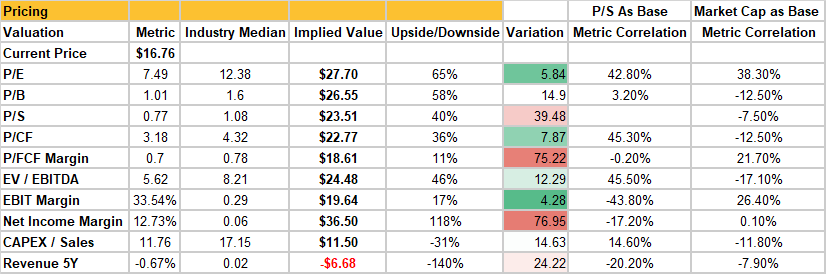
For the telecommunications industry, we see that the metrics most accurately pricing firms in the peer group are earnings, book value, cash flow, and EBITDA. So we take these, apply weights based on the variation of these metrics, and then calculate the implied value of the firm based on peer pricing.
We end up with an attractive 43.2% upside risk, pricing AT&T at $24 even, thanks mainly to attractive price to earnings, price to cashflow and book value.
Author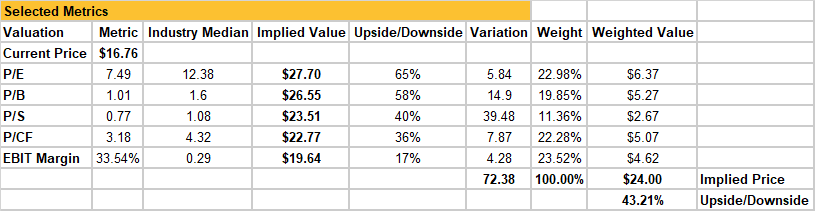
Closing Remarks
So overall, based on a peer analysis alone, we see that AT&T presents as excellent value for investors with a strong upside risk of 43% if the market applies its pricing logic evenly to AT&T.
With that said, it would be irresponsible of me not to point out that this analysis is limited in its scope to just a quantitative peer analysis. While we do look at the firm’s financials, it does not go searching for detail and context that one might find reading earnings transcripts. Further, the analysis is of the industry as a whole but does not consider the market as a whole (i.e., the S&P 500) and does not break down a near-peer comparison. Investors should use this analysis as perhaps a base-line for their analysis, but spend time looking at the firm’s qualitative aspects to further inform their thinking.
Author’s Note: The commentary in this article is general in nature and does not consider your personal circumstance. The opinions expressed in this article are opinions only, and data referenced is sourced from third party sources including Seeking Alpha and other publicly available sources.
I make no warranties or guarantees around any of the views expressed in this article and suggest all investors consider my writing to be for interest purposes only and not considered exhaustive investment research or advice.
Be the first to comment