

piranka
Before we get into why I think Aspen Technology (NASDAQ:AZPN) is a sell, let’s just outline some good points about the company and where it has come from. Also, to be clear, I’m not saying they are going broke any time soon. Simply I see this stock as overpriced relative to earnings and growth. And ready for a price correction.
Aspen technology has a long history, the company was founded in the 1980s by MIT researchers. And they certainly have come a long way. The validity of their products is confirmed by their lifespan. One of their most popular software applications in the chemical industry is the Aspen PlusTM which was launched in 1982.
The company has come a long way in terms of returns offered to its shareholders. The table below shows the returns for Aspen against the S&P 500 since the company was founded.
Author’s calculations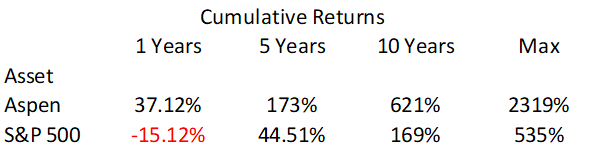
We can see how Aspen Technology shares have outperformed the S&P over all past time frames. And since the company started quoting on the stock exchange, in October 1995, by an impressive amount.
However, things may be getting a bit too overheated with this stock. And I believe that income growth would have to speed up at a rate I feel the company, or almost any, would be unlikely to achieve given its current evaluation.
New Debts
New debts are not necessarily a bad thing as they can allow a company to better manage its needs or make an acquisition that improves economies of scale, for example. And from what I see on its balance sheet the liabilities to assets ratio is low in absolute terms and compared to its peers.
The current liabilities to assets ratio is at 0.12 and the new addition of debt would see an increase to 0.16. Merely any cause for alarm given the low ratio in absolute terms and compared to the industry average.
However, on December 30, 2022, the company made a credit agreement with Emerson Electric (EMR) for a credit of $630 million to be paid back in 5 years. It’s not clear from the filing what the company will use the credit for. The filing mentions the typical; possible acquisitions, operating costs, and repayment of other loans.
This shouldn’t be of concern, but it made me raise my eyebrows considering the company has a decent free cash flow and generates profits. I can only imagine they are about to acquire a company, and that news will also be negative for its stock price. Of course, clear speculation on my part.
Valuation Metrics
Here is where the speculation ends. And we are going to have a look at some of the numbers offered to us that help us determine if a company is overvalued. I’m going to use the Seeking Alpha Quant rating system as it neatly and clearly defines all the factors.
Before we dive into that let’s just take a quick look at the overall Quant rating. We can see that the company gets some good grades in all factors except Valuation. That factor alone is enough for the system to push the rating to hold.
AZPN Quant Rating (Seeking Alpha)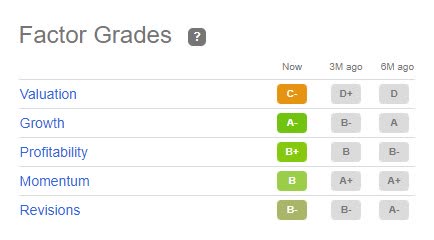
So, let’s have a closer look at the levels of the elements that make up the Valuation factor. There are various elements in the table below. I look at 3 of them mainly, simply because they make sense to me. Some of the other elements I don’t usually analyze have even worse numbers.
We can see that enterprise value to EBITDA (TTM) is 50.51, or 270.20% higher than the sector average. Things get worse with price earnings ratios. The P/E (TTM) is 139.60, which is high in absolute terms but is 494.34% higher than the industry average.
The next one, which I believe is the most important, because the only way I see this stock price keeping its levels is by increasing earnings. Well, P/E Growth (TTM) is at 78.18 which is kind of high but compared to its industry average it’s 11,716.51% higher than average.
The way I read this is that earnings must increase by exponential amounts for the valuation of this company to come in line with its industry peers.
Seeking Alpha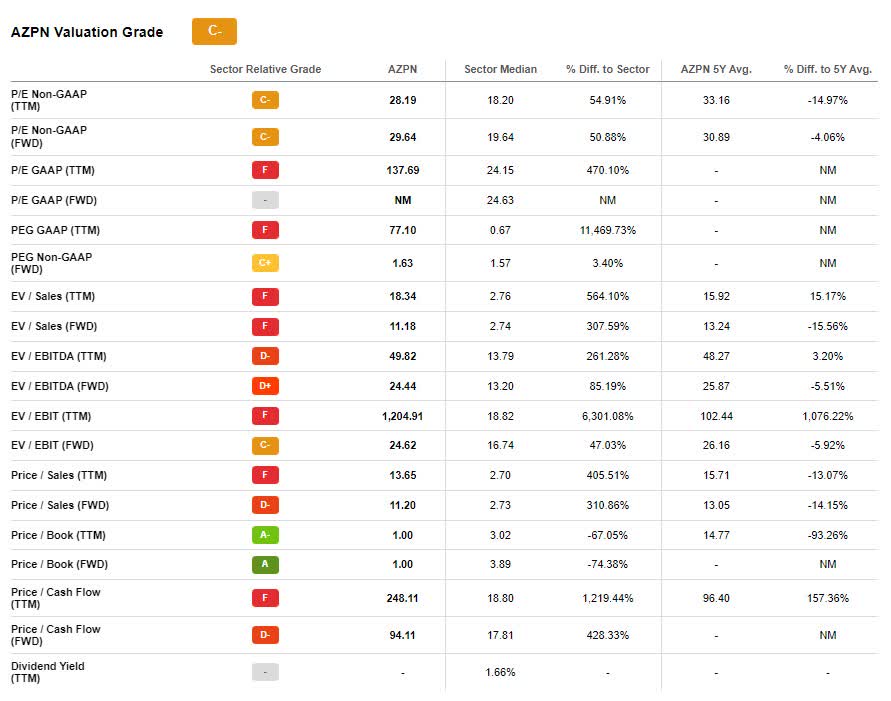
Technical Viewpoint
Let’s have a look at what I found on the charts for Aspen Technology, and it isn’t good at all either.
The monthly chart below shows how November 2022 created an upside-down hammer or kangaroo tail (black rectangle). When these appear at the top of a long bullish trend, they indicate a highly probable retracement in price.
This kangaroo tail in particular is also one of the best kangaroo tails you can find. As it satisfies all the criteria:
-
A small candle body
-
Very large range from high to low
-
Body of the candle towards the lower ¼ of the range
-
No price action to the left of the kangaroo tail
In fact, I like this tail a lot because there is no price action to the left of this tail for as far back as you can go. This in technical terms means the market may have outstretched itself and will probably need some time retracing lower before picking up a bullish trend again.
However, the overall trend on the monthly chart is still bullish when analyzing the Ichimoku system. Price is above the cloud and all other components indicate a bullish trend. Any further losses in the price, for now, should be seen as a retracement in the ongoing trend.
AZPN monthly chart (TradingView)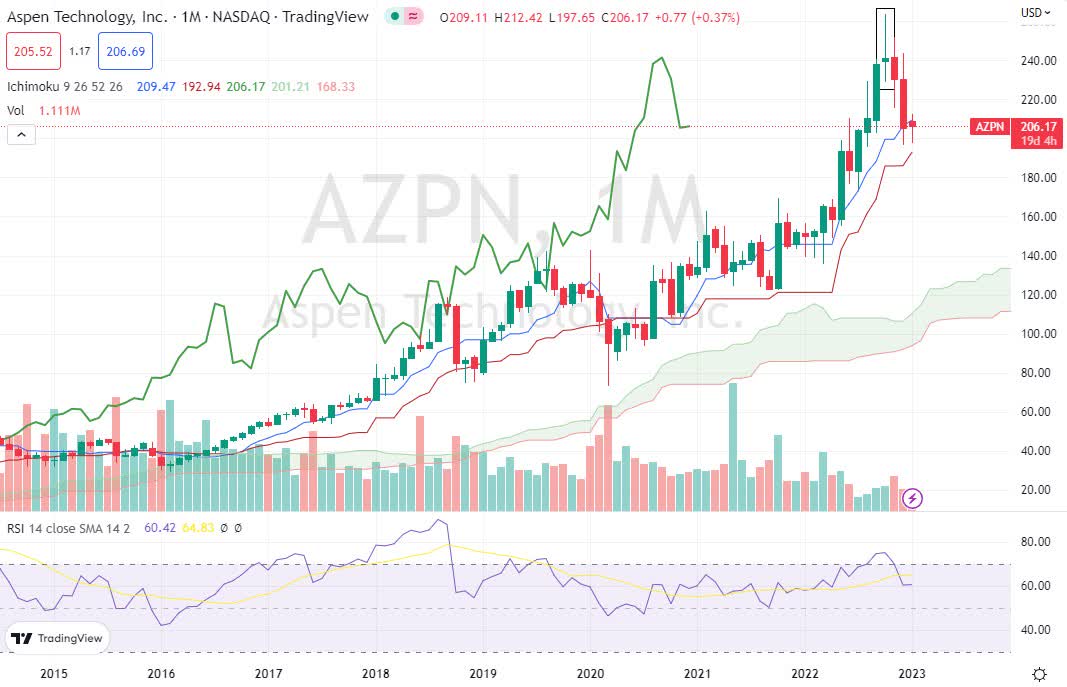
The weekly chart is also showing signs of further bearishness to come. The price action is getting closer to the cloud, which will act as support. However, the quality of the signal on the monthly chart is stronger. I, therefore, see support on the black trend line just below the cloud.
AZPN weekly chart (TradingView)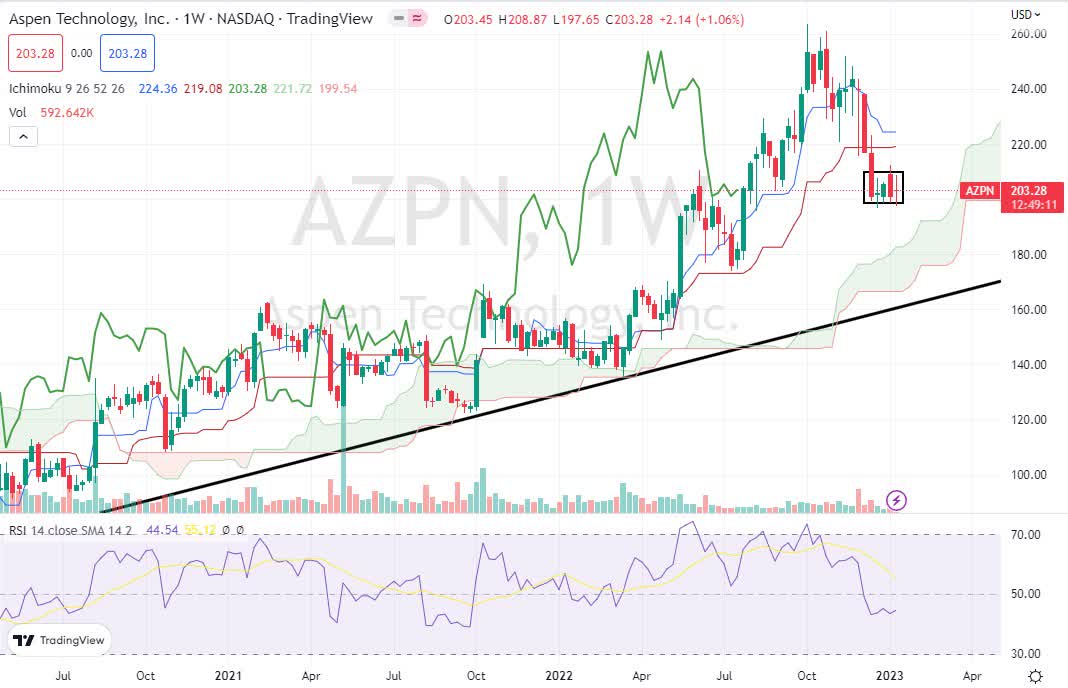
The past few weeks have seen AZPN prices trend sideways (black box) and this is considered a consolidation phase. In other terms, after traveling down from its all-time high of $263.59 the market is taking a breather.
Usually, the breakout from a consolidation area will follow in the direction that was in place before it formed. I see the target price for AZPN at between $167 and $176. A lot will depend on how long it stays in the current trading range, before breaking out to the downside.
Conclusion
Aspen Technology has some good numbers such as revenue growth YoY 130.38% and earnings growth YoY 303.68% among many others. However, my take on this stock is that the valuation of this company is way over the top.
So, in my opinion, given the multiple of valuation when looked at by any of the most important metrics, and the technical analysis, this stock is ready for a correction in price.
Be the first to comment