

Michael Vi/iStock Editorial via Getty Images
In our previous analysis of ASML Holding N.V. (NASDAQ:ASML), we identified ASML’s strengths as the market leader in the photolithography equipment market with a 62% market share. We determined that ASML could solidify its market leadership with its sole monopoly over EUV technology which provides it with a competitive advantage over Canon (CAJ) and Nikon (OTCPK:NINOF) as semiconductor companies shift towards leading-edge nodes below 7nm. Moreover, we identified its top 3 customers which are TSMC (TSM), Samsung (OTC:SSNLF) and Intel (INTC) accounting for 77% of its sales and have all committed to investments in EUV. Based on its customer capacity expansions, we calculated expected investments in EUV to reach $9 bln in 2021. However, we determined the risk of ASML losing its China-based revenue (12%) as the Dutch government had imposed restrictions to ship its EUV systems to SMIC.
In this analysis, we examined the planned investments of its key customers for its logic segment namely TSMC, Samsung Foundry and Intel to determine incremental capacity growth per year. Based on this, we estimated how many EUV systems would be required by its customers to support its capacity expansion to derive the EUV system demand for ASML’s logic segment. As its memory customers also transition to using EUV systems, we forecasted their capacity growth based on their planned investments and projected the EUV system demand for ASML’s memory segment. Lastly, we analysed its profitability and forecasted its margins going forward by taking into account its bargaining power over customers as the sole supplier of EUV systems.
Investment Plans of Logic Customers to Drive Demand for Logic EUV Equipment
According to ASML’s annual report, its key customers are TSMC, Samsung and Intel. Additionally, its revenue breakdown by region has Taiwan, South Korea, and the US at 34%, 30% and 12% respectively, corresponding to the locations of TSMC, Samsung and Intel.
ASML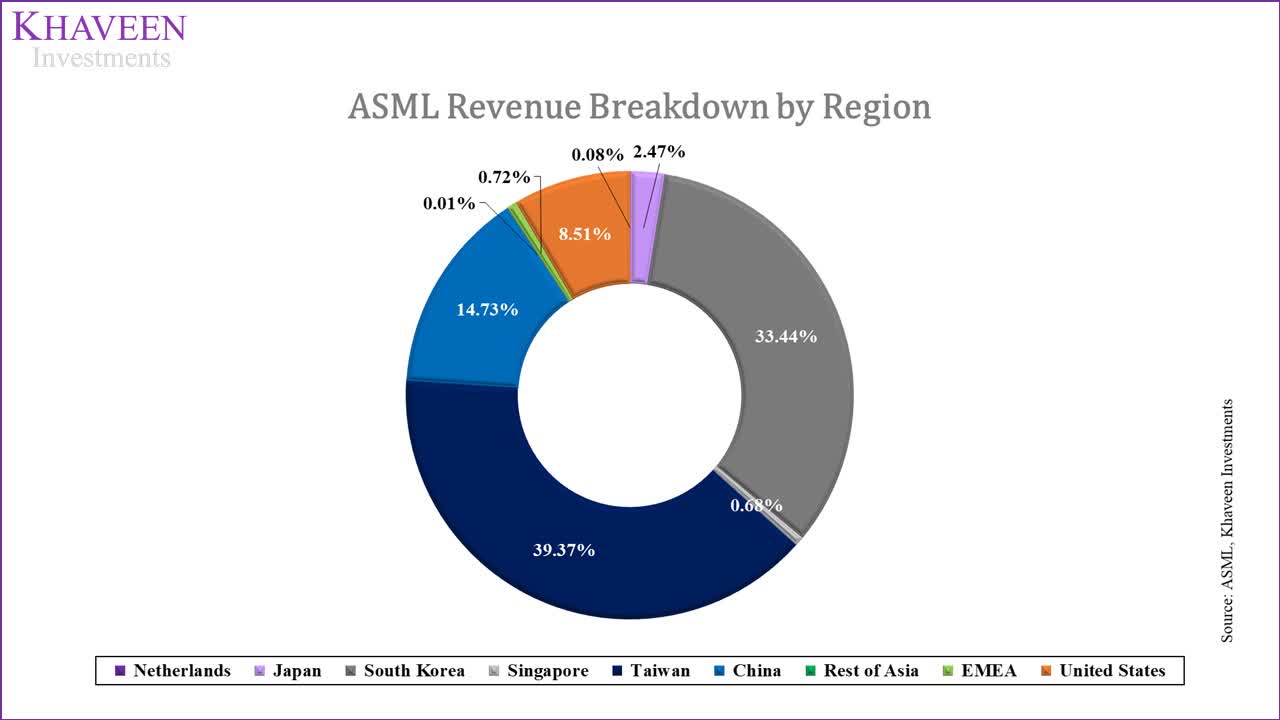
These companies are significant players in the global semiconductor industry, with TSMC and Samsung being market leaders in the foundry market with over 70% of market share in Q4 2021, while Intel is the second largest chipmaker with 12.5% of market share of semiconductor sales in 2021.
We looked at various sources of key customers including TSMC, Samsung Foundry and Intel and collected information regarding planned investments in dollar figures for semiconductors. In addition, we collected wafer capacity information from IC Insights to derive the incremental wafer capacity of each company in 2020 from 2019. We then estimated their capacity growth based on their planned investments:
- Calculated the incremental wafer capacity growth/capex (d = b/c)
- Estimated the wafer capacity CAGR from their planned investments based on the incremental capacity/capex. (e = a x d)
- Estimated Samsung’s foundry capacity based on its foundry revenues as a % of its total semicon revenues from Statista
|
Projections of Wafer Capacity |
TSMC (2022) |
Samsung Foundry (10-year) |
Intel (2022) |
|
Planned Investments ($ bln) (‘a’) |
32 |
151 |
27 |
|
Incremental Capacity (2020) (‘b’) |
214.0 |
30.31 |
67.00 |
|
Capex (2020) (‘c’) |
18.0 |
6.8 |
14.5 |
|
Incremental Capacity/Capex (Kwpm/$ bln) (‘d’) |
11.89 |
4.48 |
4.62 |
|
Incremental Capacity (‘e’) |
375 |
677 |
125 |
|
Capacity (2021F) |
3,007 |
783 |
977.9 |
|
CAGR |
12.5% |
6.4% |
12.8% |
*d = b/c
*e = a x d
Source: Bloomberg, KEDGlobal, Intel, TSMC, Khaveen Investments
- Applied our capacity projections for its logic customers through 2024
- Calculated the incremental capacity growth per year.
- Based on ASML’s annual report in 2020, it shipped a total of 32 EUV systems, assuming TSMC had 50% of the shipment as claimed by the company to have a 50% install base, we estimate 16 shipments for TSMC. From its incremental capacity in 2020 of 214Kwpm, we derived an incremental capacity per EUV system of 13.4Kwpm/system.
- Applied the 13.4Kwpm/system factor to estimate the number of EUV systems required for their capacity expansion. (b/13.4)
|
Logic EUV Demand Projections |
2019 |
2020 |
2021F |
2022F |
2023F |
2024F |
|
Wafer Capacity |
||||||
|
TSMC |
2,505 |
2,719 |
3,007 |
3,381 |
3,802 |
4,276 |
|
Samsung Foundry Estimate |
712 |
742 |
783 |
834 |
887 |
944 |
|
Intel |
817 |
884 |
978 |
1,103 |
1,243 |
1,402 |
|
Incremental Capacity (‘a’) |
||||||
|
TSMC |
214 |
288 |
375 |
421 |
474 |
|
|
Samsung Foundry Estimate |
30 |
41 |
50 |
54 |
57 |
|
|
Intel |
67 |
94 |
125 |
141 |
159 |
|
|
EUV Systems (‘b’) |
||||||
|
TSMC |
22 |
28 |
31 |
35 |
||
|
Samsung Foundry Estimate |
3 |
4 |
4 |
4 |
||
|
Intel |
7 |
9 |
11 |
12 |
||
|
Total Logic EUV Systems |
32 |
41 |
46 |
52 |
||
|
Growth % |
29.9% |
12.0% |
12.0% |
Source: IC Insights, Khaveen Investments
Based on our calculations, we obtained a demand forecast of 52 systems in 2024. Overall, the company counts on leading foundries TSMC and Samsung which are forecasted to increase capacity for leading-edge nodes. TSMC has the highest incremental capacity/capex which could be due to their sole focus on foundry while Samsung and Intel have other business segments. These customers have planned significant investments for the capacity expansion, and we expect the growth of TSMC, Samsung and Intel investments to drive demand for ASML’s EUV systems.
The transition of DRAM market to EUV to provide additional Demand
Besides logic customers, the company caters to memory chipmakers which accounts for 30% of its system revenues in 2021.The company’s customers include Micron (MU), Samsung and SK Hynix in the semiconductor memory market which happens to be the world’s 3 largest memory makers. Micron’s CEO recently announced long-term plans to deploy EUV for its 1-gamma DRAM products in 2024.
Micron has placed purchase orders for multiple EUV tools from ASML as part of a long-term volume agreement, – Sanjay Mehrotra, Micro CEO
Even SK Hynix highlighted the important use of EUV which increased its unit production by 25% per single wafer for its 10nm DRAM products compared to non-EUV lithography. We believe this puts ASML in a good position given they are the sole producer of EUV equipment.
We looked at various sources of key customers including SK Hynix, Samsung and Micron and collected information regarding planned investments in dollar figures. In addition, we collected wafer capacity information from IC Insights to derive the incremental wafer capacity of each company in 2020 from 2019. We then estimated their capacity growth based on their planned investments:
- Calculated the incremental wafer capacity growth/capex (D = B/C)
- Estimated the wafer capacity CAGR from their planned investments based on the incremental capacity/capex. (E = A x D)
- Calculated Samsung’s memory investments based on its DRAM memory revenue ($28.6 bln)/2020 revenue ($200 bln) x total investments ($206 bln) = $29.5 bln
|
Projections of Wafer Capacity |
SK Hynix |
Micron |
Samsung Memory |
|
Planned Investments ($ bln) (‘A’) |
106 |
150 |
29.5 |
|
Incremental Capacity (2020) (‘B’) |
135.0 |
90.0 |
61.9 |
|
Capex (2020) (‘C’) |
8.9 |
10.0 |
13.8 |
|
Incremental Capacity/Capex (Kwpm/$bln) (‘D’) |
15.17 |
9.00 |
4.48 |
|
Estimated Incremental Capacity from Investments (‘E’) |
1,608 |
1,350 |
132 |
|
Capacity (2021F) |
2,047 |
2,021 |
1,600 |
|
CAGR |
12.3% |
5.2% |
2.7% |
Source: IC Insights, Anandtech, Reuters, Seeking Alpha, Khaveen Investments
- Applied our capacity projections for its memory customers through 2024
- Calculated the incremental capacity growth per year.
- Applied our estimates for TSMC as outlined in the previous point of incremental capacity per EUV system of 13.4Kwpm/system, we derive our estimates for the demand of EUV systems (B/13.4)
|
Memory EUV Projections |
2019 |
2020 |
2021F |
2022F |
2023F |
2024F |
|
Wafer Capacity |
||||||
|
Samsung Memory Estimate |
1,454 |
1,516 |
1,600 |
1,643 |
1,687 |
1,732 |
|
Micron |
1,841 |
1,931 |
2,021 |
2,127 |
2,239 |
2,357 |
|
SK Hynix |
1,743 |
1,878 |
2,047 |
2,298 |
2,581 |
2,898 |
|
Incremental Capacity (‘A’) |
||||||
|
Samsung Memory Estimate |
61.9 |
84.5 |
42.8 |
44.0 |
45.2 |
|
|
Micron |
90.0 |
90.3 |
106.1 |
111.7 |
117.5 |
|
|
SK Hynix |
135.0 |
168.7 |
251.6 |
282.6 |
317.3 |
|
|
EUV Systems (‘B’) |
||||||
|
Samsung Memory Estimate |
6 |
3 |
3 |
3 |
||
|
Micron |
7 |
8 |
8 |
9 |
||
|
SK Hynix |
13 |
19 |
21 |
24 |
||
|
Total EUV Memory Systems |
26 |
30 |
33 |
36 |
||
|
Total Memory Growth % |
16.6% |
9.4% |
9.5% |
Source: IC Insights, Khaveen Investments
Overall, we expect the transition of DRAM players to use EUV technology and the planned investments to expand capacity to drive demand for ASML’s EUV equipment for memory customers such as Samsung, Micron and SK Hynix announced their investment plans to expand their capacities. Based on our estimates, we forecast the demand for EUV systems from memory customers to grow by 16.6% in 2022 and reach 36 systems by 2024 which we expect to benefit ASML.
Margin Upside with High Bargaining of Power over Customers
In terms of profitability, its gross margins have been improving in the past 10 years from 40% in 2012 to 52.7% in 2021. However, its net margins have remained stable at 27.5% in 2021 with a 10-year average of 24.9%.
|
Earnings & Margins |
2018 |
2019 |
2020 |
2021 |
2022F |
2023F |
2024F |
2025F |
|
Revenue |
12,538 |
13,259 |
17,076 |
21,183 |
24,325 |
28,100 |
32,648 |
37,279 |
|
Gross Profit |
5,762 |
5,922 |
8,303 |
11,164 |
13,091 |
15,442 |
18,299 |
21,272 |
|
Net Earnings |
2,969 |
2,908 |
4,341 |
6,696 |
7,612 |
9,093 |
10,899 |
12,801 |
|
Revenue Growth |
16.59% |
5.75% |
28.79% |
24.05% |
14.83% |
15.52% |
16.18% |
14.18% |
|
Gross Margin (%) |
45.95% |
44.67% |
48.63% |
52.71% |
53.82% |
54.95% |
56.05% |
57.06% |
|
Net Margin (%) |
23.68% |
21.93% |
25.42% |
31.61% |
31.29% |
32.36% |
33.38% |
34.34% |
|
Free Cash Flow Margin |
23.52% |
17.87% |
23.37% |
57.83% |
25.01% |
23.39% |
24.84% |
26.30% |
Source: ASML, Khaveen Investments
In its 2021 Investor Day, the company has highlighted its profitability target in 2025 with gross margins between 54% to 56%. We believe that the company’s target to achieve higher margins could be attainable due to its dominance in the EUV lithography technology as highlighted in our previous analysis. With its monopoly over EUV, we believe that it has high bargaining power over its customers who rely on their systems to produce leading-edge chips. Additionally, the company’s output is limited to a few systems shipments per year. According to the company, it had only shipped around 100 EUV systems with an average price per system of EUR145 mln based on its EUV revenue per shipment in its annual report.
To add on, from its annual report, the company has partnerships with suppliers. For example, it has had a partnership for more than 3 decades with Carl Zeiss AG, its sole supplier of lenses, mirrors, and critical optical components for the EUV systems. Also, its annual report stated that it had 24.9% of equity interest in the company. For the development of its more advanced High-NA EUV systems, we believe its interest and partnership with this supplier may provide a benefit to the company for complex lenses.
|
Incremental FCF From Margins Upside ($ mln) |
2020 |
2021 |
2022F |
2023F |
2024F |
2025F |
|
Revenue |
17,076 |
21,183 |
24,325 |
28,100 |
32,648 |
37,279 |
|
Gross Margins (‘a’) |
48.63% |
52.71% |
53.82% |
54.95% |
56.05% |
57.06% |
|
FCF Margins |
23.37% |
57.83% |
25.01% |
23.39% |
24.84% |
26.30% |
|
Gross Margins (‘b’) |
48.63% |
52.71% |
52.71% |
52.71% |
52.71% |
52.71% |
|
FCF Margins (With no margin upside) (‘c’) |
23.37% |
57.83% |
23.90% |
21.14% |
21.49% |
21.95% |
|
Incremental FCF (‘d’) |
0 |
0 |
270 |
632 |
1,092 |
1,624 |
* d = a x b – a x c
Source: ASML, Khaveen Investments
We forecasted its gross margins to increase to 57.16% in 2025 as we expect its margins to continue to improve with scale. Additionally, we calculated the incremental FCF from the increase of its margins.
ASML, Khaveen Investments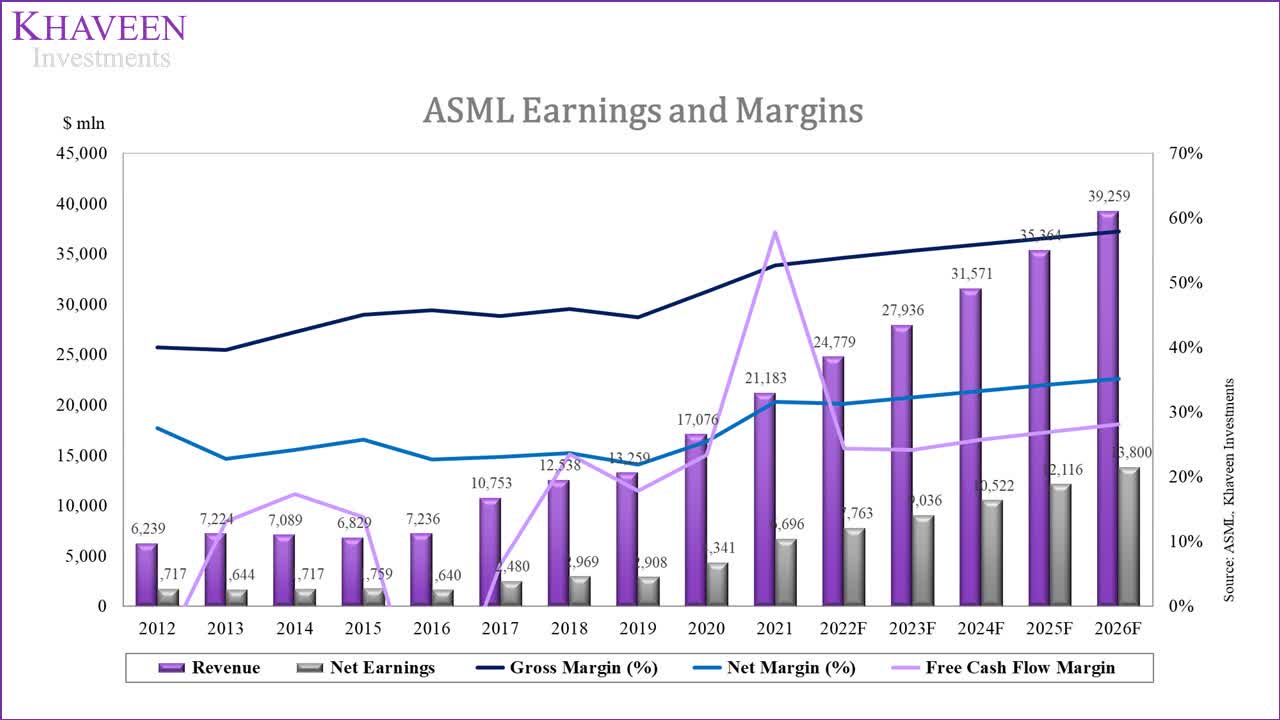
Overall, we expect that with its dominance over EUV lithography technology as a leading equipment supplier, the company’s profitability margins could continue growing to 54.75% in 2025 with high bargaining power over customers who depend on its equipment to produce leading-edge nodes and the controlled output of its equipment. Moreover, we believe that with partnerships and interest in its key suppliers, it could provide it with an advantage to maintain its competitive position.
Risks: China Company Sanctions May Weigh on Growth
China accounts for around 16.4% of its total revenues based on its annual report. According to management, it seems cautiously optimistic to maintain its sales from the country in 2022.
For next year I wouldn’t expect a dramatic increase in that number, but we would expect that number to be sustained, so also next year pretty strong sales. – Roger Dassen, ASML Chief Financial Officer
In the past year, the company has stated that it has extended its deal with SMIC for the supply of older generation equipment until the end of 2021. In addition, recent reports by Bloomberg suggest that the US administration may be weighing tougher sanctions on SMIC. In the past, a Dutch member of the European Parliament stated that the US blocked exports of ASML’s technology to China due to intellectual property theft concerns.
We believe that the political uncertainty concerning ASML’s exports to China may weigh on its revenue growth in the region. Despite extending the deal to 2021 for the sale of older equipment, we believe the company could face an impact on its revenue from China if tougher actions are taken by the US against Chinese companies.
Valuation
To value the company, we used a DCF analysis as we expect the company to maintain its strong cash flow generation abilities. The company’s average FCF margin was 25.8% for the past 5 years. Its FCF margin in 2016 was negative due to its acquisition of Hermes Microvision, Inc. (HMI) in 2016 for $3.09 bln.
ASML, Khaveen Investments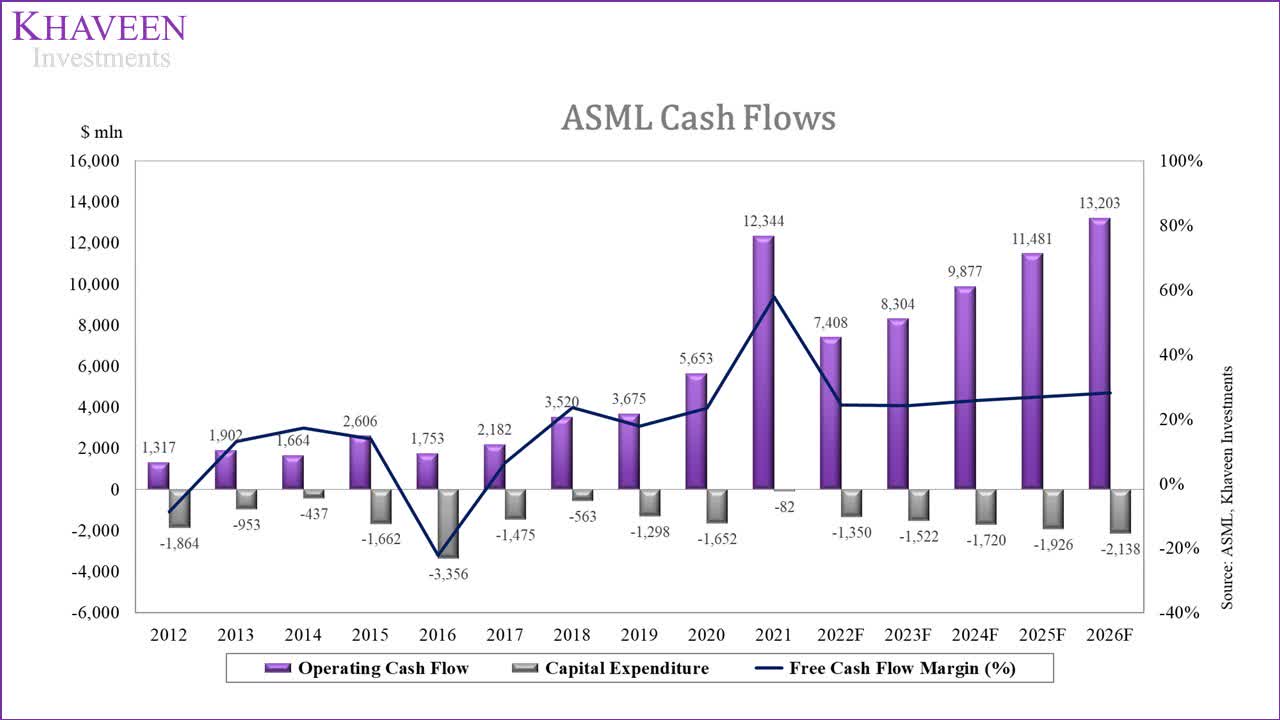
Based on its competitors in the semicon equipment market, it has an industry average EV/EBITDA of 18.47x.
Seeking Alpha, Khaveen Investments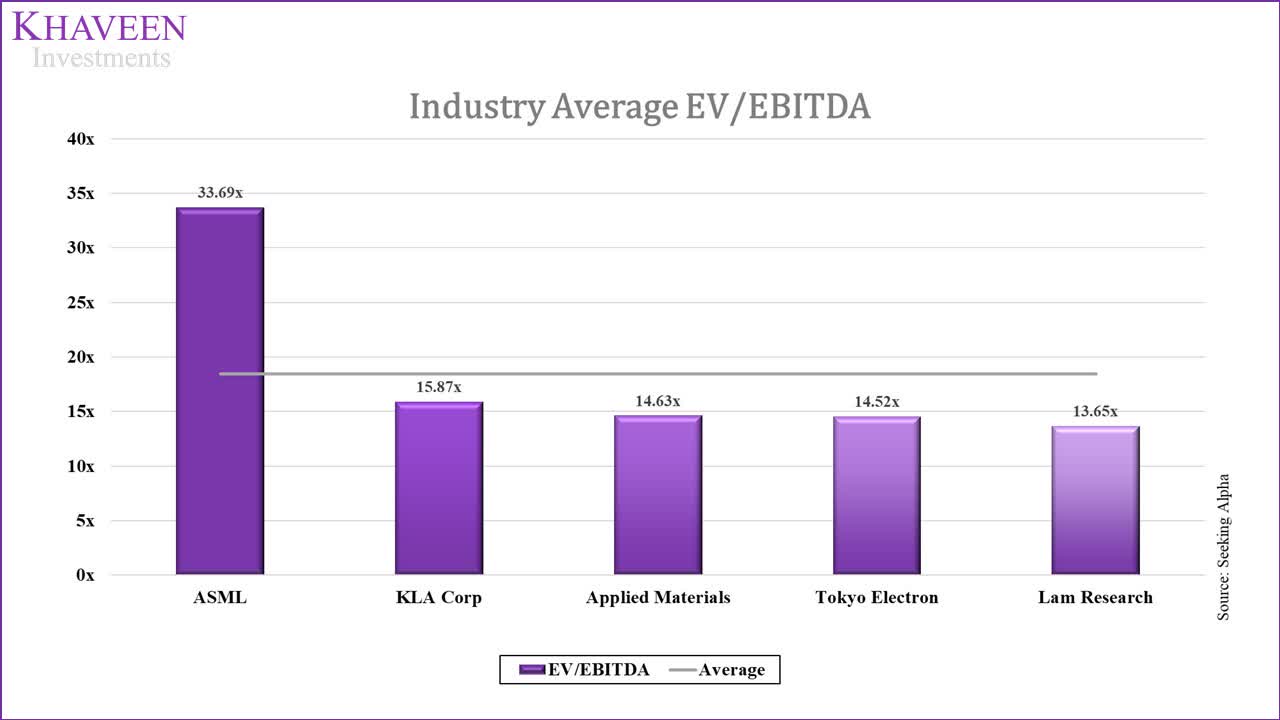
From its latest earnings call for Q4 2021, the company’s management highlighted its positive outlook for the year in both logic and memory in 2022.
Looking at the market segments, given the very strong demand situation and our continued push to increase capacity, we see growth in both Logic and Memory in 2022. – Peter Wennink, CEO
From the points on its logic and memory customer investments, we summarised our total estimated demand for EUV systems through 2024.
|
Estimate of EUV Systems Demand |
2022F |
2023F |
2024F |
|
Total Logic |
41 |
46 |
52 |
|
Total Memory |
30 |
33 |
36 |
|
Total Systems |
71 |
79 |
87 |
|
Growth % |
23.9% |
10.9% |
11.0% |
Source: Khaveen Investments
We based our EUV projections on our demand forecasts by customers. This is in line with management’s guidance of EUR7.8 bln from its latest earnings call. Additionally, we forecasted its other systems and the service segment revenues to grow based on its 10-year historical average growth rate.
|
Revenue Segments (EUR mln) |
2019 |
2020 |
2021 |
2022F |
2023F |
2024F |
|
EUV |
2,800 |
4,464 |
6,284 |
7,789 |
8,637 |
9,584 |
|
Growth % |
48.9% |
59.4% |
40.8% |
23.9% |
10.9% |
11.0% |
|
Other System Revenue |
6,197 |
5,853 |
7,369 |
7,981 |
8,644 |
9,362 |
|
Growth % |
-2.9% |
-5.5% |
25.9% |
8.3% |
8.3% |
8.3% |
|
Net Service and field option sales |
2,824 |
3,662 |
4,958 |
6,001 |
7,264 |
8,792 |
|
Growth % |
5.2% |
29.7% |
35.4% |
21.0% |
21.0% |
21.0% |
|
Total |
11,820 |
13,979 |
18,611 |
21,771 |
24,544 |
27,739 |
|
Growth % |
8.0% |
18.3% |
33.1% |
17.0% |
12.7% |
13.0% |
Source: ASML, Khaveen Investments
Based on a discount rate of 9.1% (company’s WACC), our model shows that ASML shares are fairly valued.
Khaveen Investments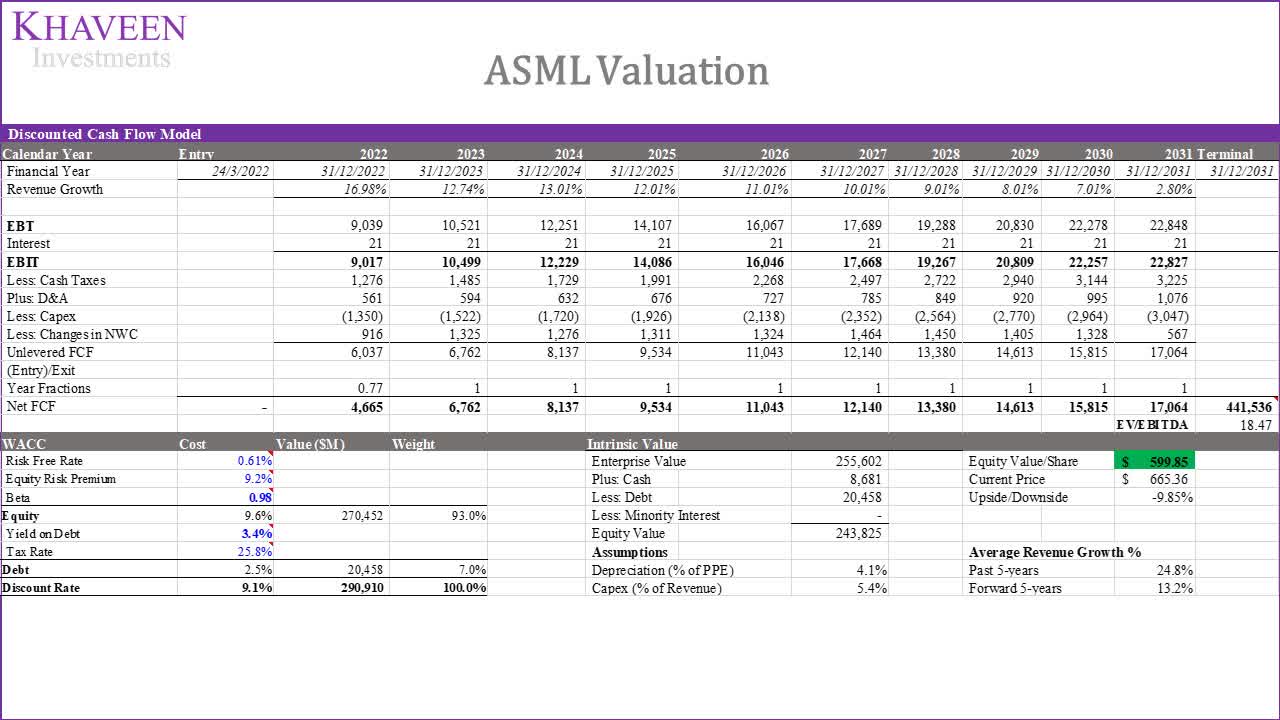
Verdict
In this analysis, we analyzed the company’s logic and memory customers planned investments for expansion and projection of the increased demand for ASML’s EUV equipment as well as its high bargaining power over these customers which we expect could lead to margin upside. For its logic segment, we highlighted the expansion plans for its foundry customers and Intel and estimated their investments to lead to higher EUV equipment demand growth. Moreover, the transition of DRAM players using EUV and committed investments are also expected to contribute to demand growth for ASML. In terms of margins, we see very high bargaining power over its customers due to its dominance in EUV technology which could lead to margins growth. Still, we find the company fairly valued, given its high EV/EBITDA multiple relative to its peers. Overall, we rate the stock as a Hold with a target price of $599.85.
Be the first to comment