

jonathanfilskov-photography/E+ via Getty Images
Utilities are a bedrock for many risk-averse investors’ portfolios. They can provide secure, growing dividends and growth, year after year. Utility earnings tend to be less affected by down years or wider economic cycles; no matter what is going on, people still need water, gas, or electricity. The demand tends to grow with time and effective managers can squeeze out growth in earnings with time.
Given the situation, I review Artesian Resources Corporation (NASDAQ:ARTNA) as at substantial risk because of overvaluation. I then position Algonquin Power & Utilities Corporation (AQN) as a possible alternative for an investor looking at adding utility exposure.
The income opportunities from utilities will not get many investors excited as utility dividend growth tends to be poor and, in most cases, far below the present levels of inflation. While they historically have had a low beta, I have a lingering concern that if they are overvalued, they could be primed for a reasonably drastic fall in prices if there is a downturn. We look at these risks today.
ARTNA is over a century old and, like many utilities, services a discrete geographic area with around 1,368 miles of transmissions and distribution pipelines in Delaware, Maryland, and PA. They have real estate holdings, treatment plants, and other sundry investments. ARTNA serves 301,000 (approx) customers with 94,300 meters and they have 73 treatment facilities.
ARTNA has, generally, traded at a P/E of about 22x (Figure 1, the panel on the right-hand side, with the blue line representing this ‘normalized’ P/E ratio). Recently, however, we see that the P/E has expanded, taking it to a lofty 30x. In recent weeks, this has eased a little, but prices are still high relative to earnings. However, we see that since about 2015, prices have been just below or over the blue line (22x PE) as shown in Figure 1. The company is small, with a 534m market cap, and it has an LT DEBT/Cap ratio of 47.44 (Source: Fast Graphs). As a final note, we can also see the significant upswing and increase in stock prices in recent months, as prices pull higher away from the blue “normalized” P/E ratio line in Figure 1.
Figure 1. Historic (FAST Graphs)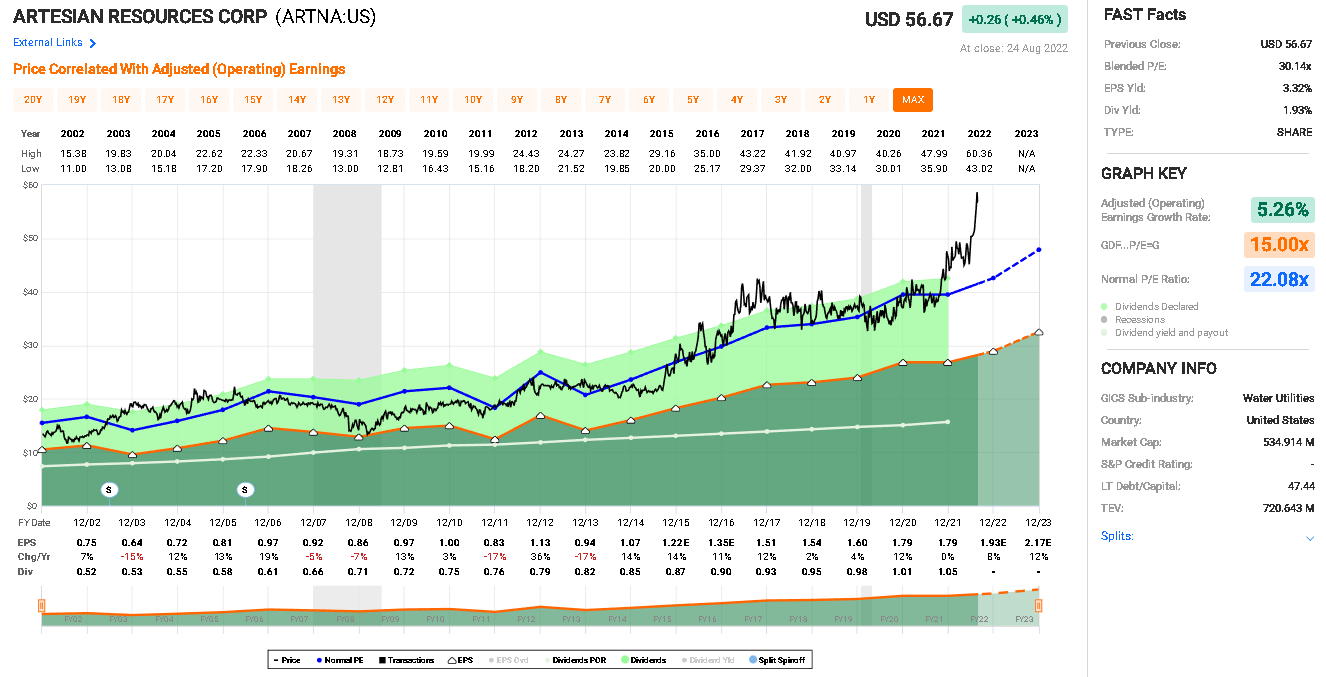
Recent results
The liabilities have been increasing for ARTNA, with little sign of slowdowns. This is of concern given the prospect of rising interest rates and the current inflationary environment.
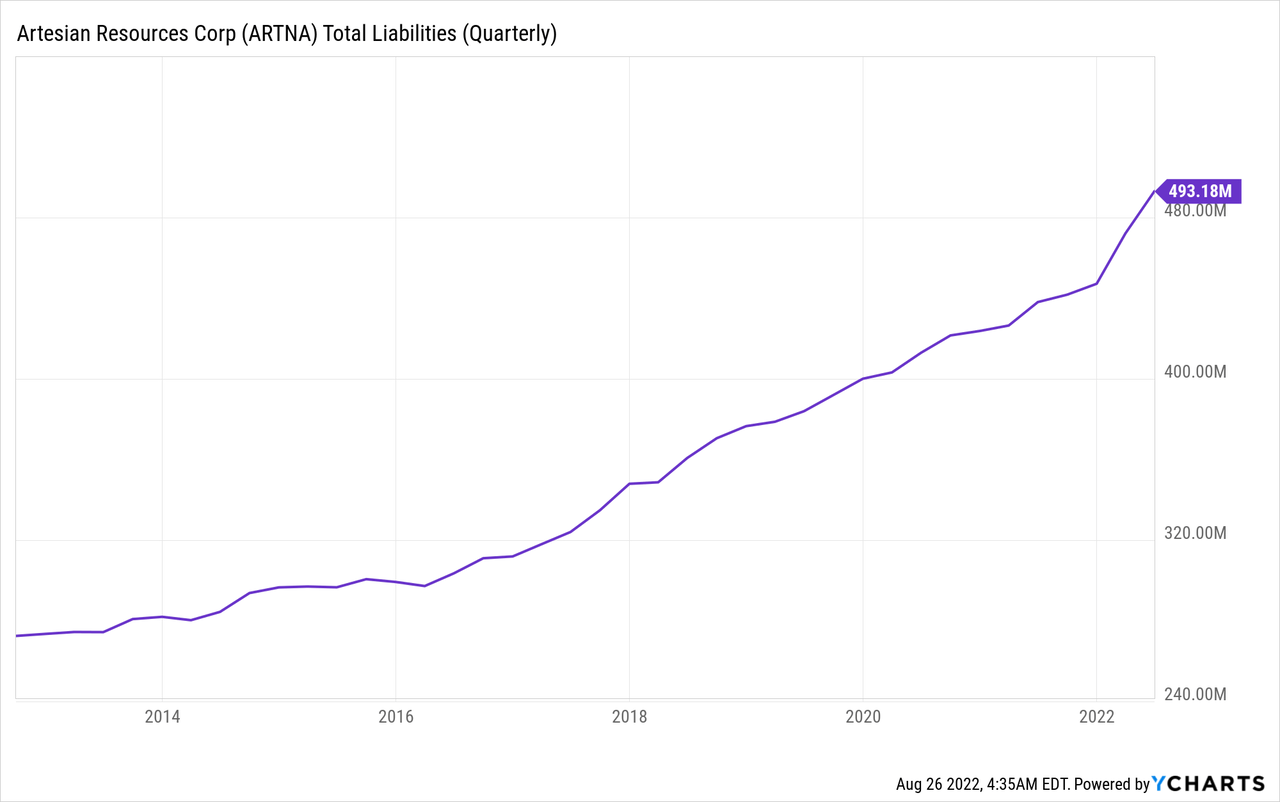
Figure 2. ARTNA Total Liabilities
As a final note, while it is not crucial for a utility (as much as I would consider it for an industrial company, for example), I prefer investments to hold a current ratio and quick ratio at reasonable levels to provide additional security. As we can see from Figure 3, the Quick and Current ratios have been trending down in recent years in a concerning trend.
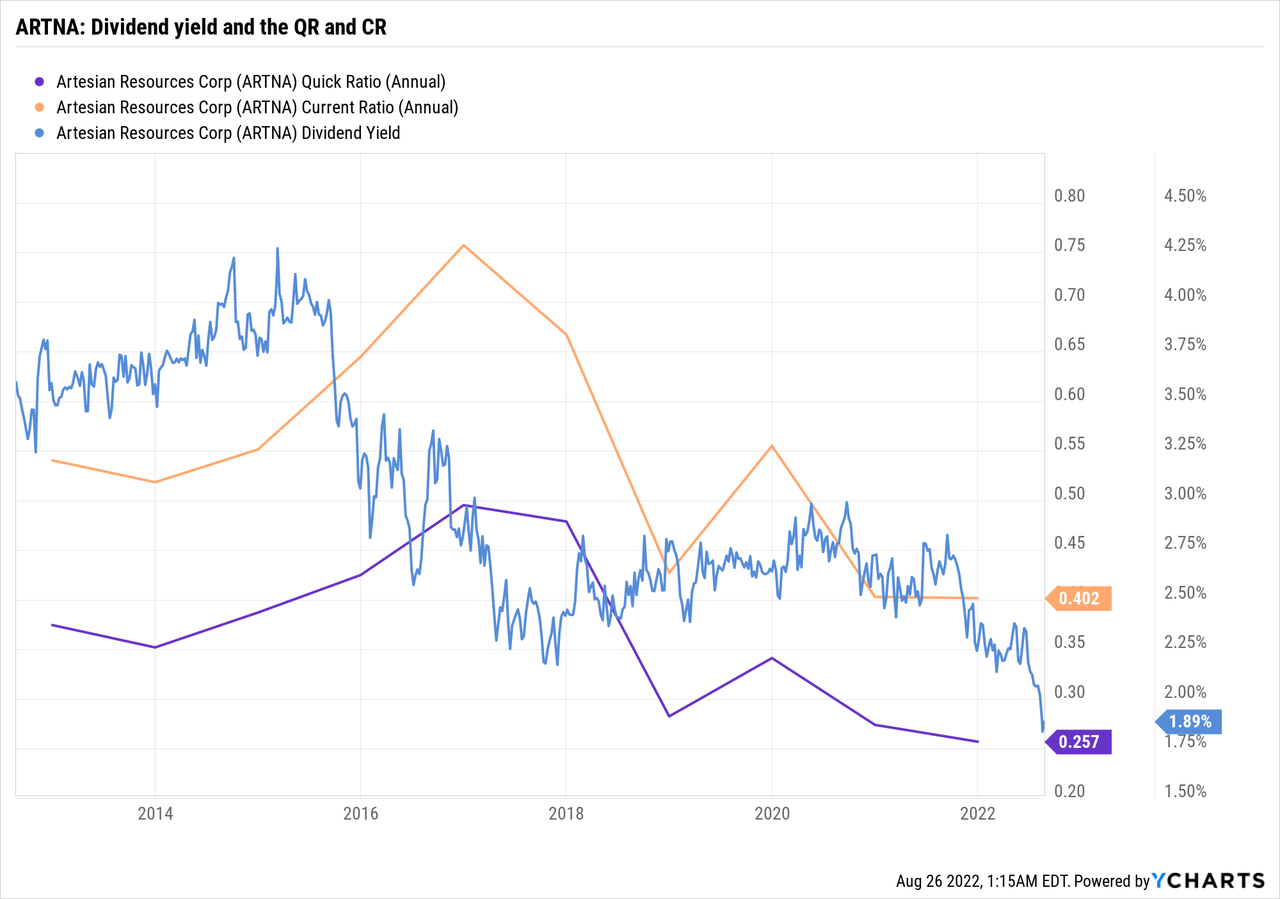
Figure 3. ARTNA’s quick ratio, current ratio, and dividend yield since 2014.
Seeking Alpha gives ARTNA a Dividend Safety of “C+”, a dividend yield of 1.93% and a 5-year DGR of 3.27% (Source: Seeking Alpha). From Figure X, we can see that the dividend yield has been decreasing since 2014 and is now at a substantially lower level than in past years.
Valuation
How does ARTNA stack up against its peers? With reference to Figure 4, we can see that it looks relatively affordable against some of the other water utilities. However, consider this in context. I used the Seeking Alpha peers as a starting point but tried to get a reasonable mix of comparable firms with similar sizes given ARTNA’s stature. Therefore, I compared ARTNA against:
- The York Water Company (YORW)
- Global Water Resources, Inc. (GWRS)
- Middlesex Water Company (MSEX)
- California Water Service Group (CWT); as the largest with a market cap of $3.27 billion
ARTNA has a Seeking Alpha ‘Growth’ Grade of “A-“, a 3.3% 10-year CAGR for revenue, and 5.72% 10-year CAGR for EPS. It is not a growth stock, and it has limited opportunity to expand. Therefore, I find a P/E of 30x, EV/EBIDTA of over 16x, or a price/sale ratio of 5.71x (Figure X) unjustifiably high, and setting up new investors for a potentially significant capital loss if there is a decrease in prices. I acknowledge that ARTNA is not an outlier here and, if anything, it looks slightly more affordable than its peers.
If ARTNA fell, for example, to a 15x PE, this would cause substantial capital losses. Just because the other water utilities are trading at comparable valuations does not mean it is risk-free, sensible, or something I want to own at these valuations.
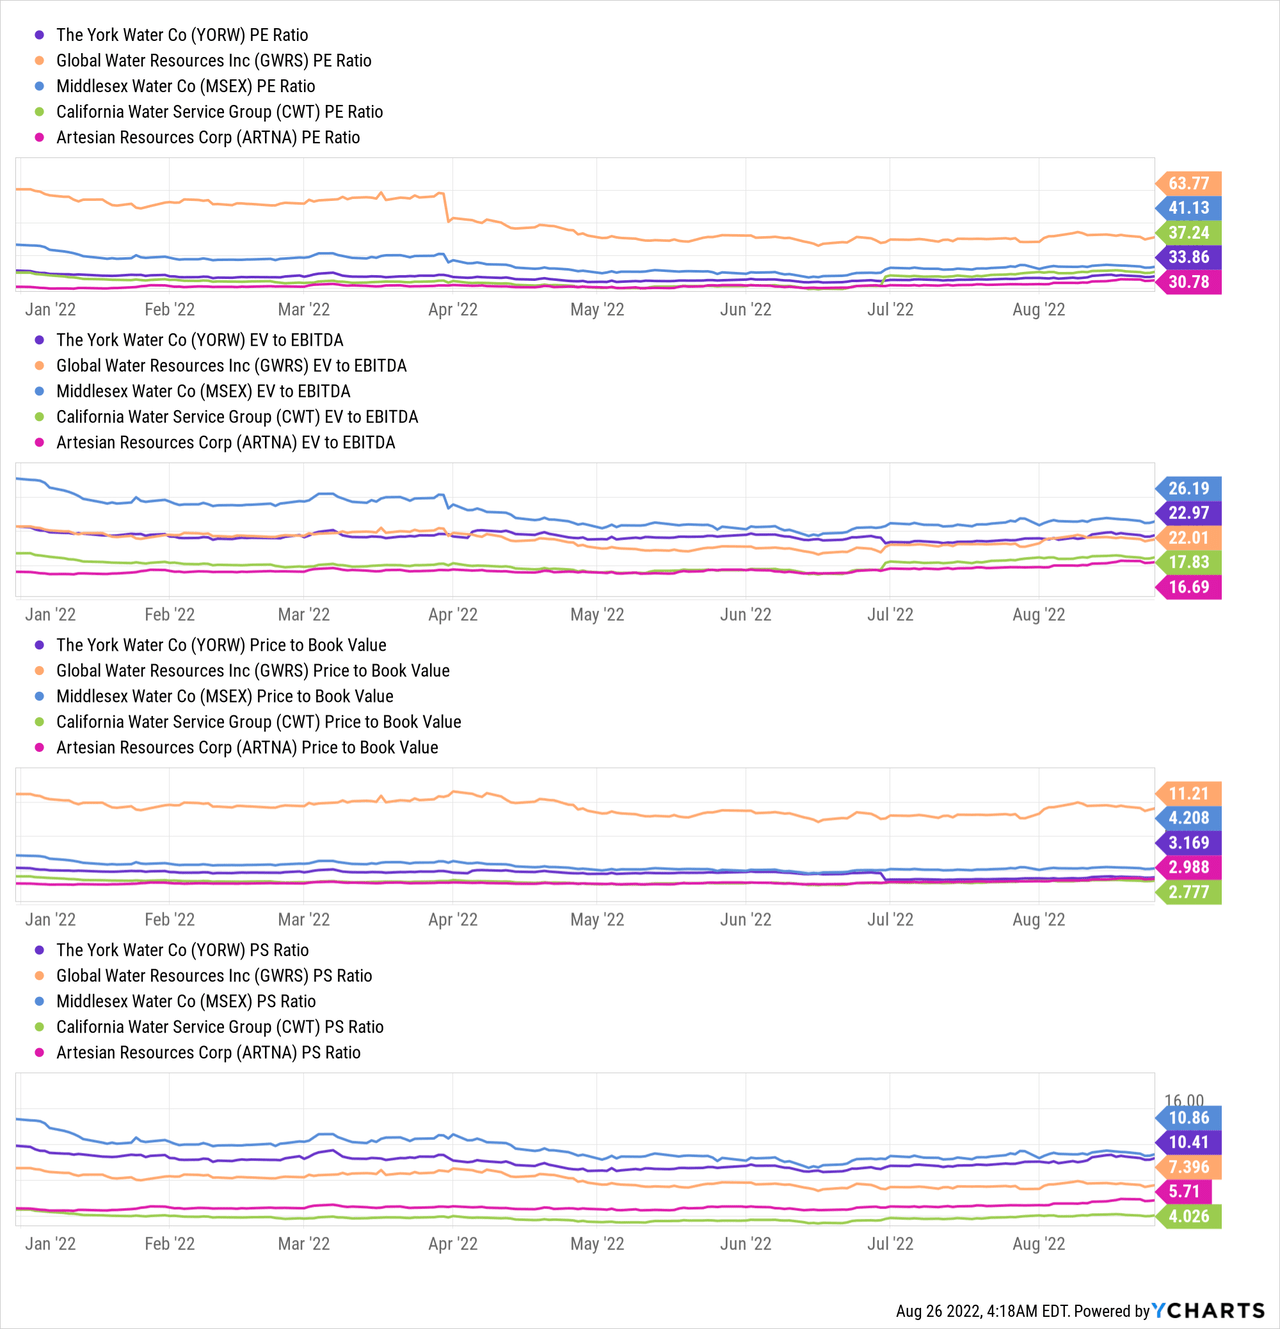
Figure 4. Peer comparisons for ARTNA against other water utilities.
What would happen if ARTNA prices declined to a normalized P/E of 23.77x by the end of 2023? We would expect to see a loss of $5.08 or -6.7% (Figure 5). And if prices correct more substantially by 2023, decreasing to a point where the P/E normalizes to 15x, then there would be a loss of $24.7 or -34.2% total annualized rate of return, accounting for the dividends (Source: Fast Graphs).
Figure 5. Analyst estimates for ARTNA’s earnings until 2024. (FAST Graphs)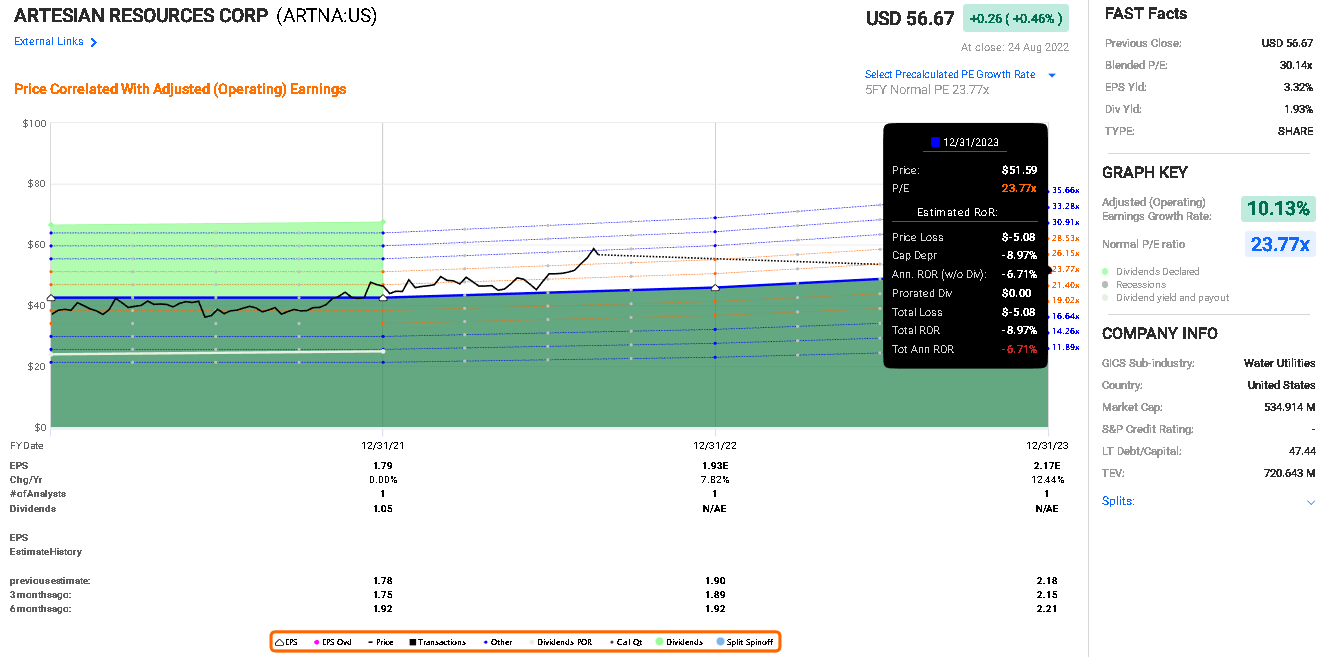
What can we take away from this? The current valuation of ARTNA is high and any return to a more normal P/E ratio of 15x would result in substantial losses for investors at this point. Further, ARTNA has low levels of growth expected, with only a 4% CAGR expected.
Other options: AQN
As I noted earlier, all the water utilities in the North American regions are trading at high multiples at the moment. They are safe, regulated, and sturdy utilities that should do well and provide assurance and protection against loss of capital.
For an alternative, therefore, I looked for an option that delivers greater growth and returns potential with a small sacrifice of security and safeness. Keeping within the utilities provides security, but I’ve opted to look at the multi-utility subsector and identify Algonquin Power & Utilities as a potential contender. It is a financially strong company, with a BBB S&P Credit rating, a 10B market cap, and a LT Debt/capital ratio of 55.75x (Source: Fast Graphs).
AQN’s dividends and growth
AQN has a dividend yield of 5.03% and a 5-year DGR of 9.26% but only 9 years of dividend growth history and possesses a Dividend Safety Grade of “C” (Source: Seeking Alpha).
It has long-term EPS growth prospects (5years) of 8.33% (FAST Graphs based on Factset Analysts) or 5.52%, both numbers coming in for reasonably strong future growth expectations.
AQN’s potential returns and valuation
A return to 15x P/E by 2024 would mean a loss of $1.79 or -0.04% annualized rate of return (Figure 6). However, if price remains at a level that matches the normalized P/E of 20.55x at the end of 2024, this would lead to a gain of $2.87 or 12.8% annualized rate of return.
Figure 6. Analyst estimates for AQN’s earnings until 2024. (FAST Graphs)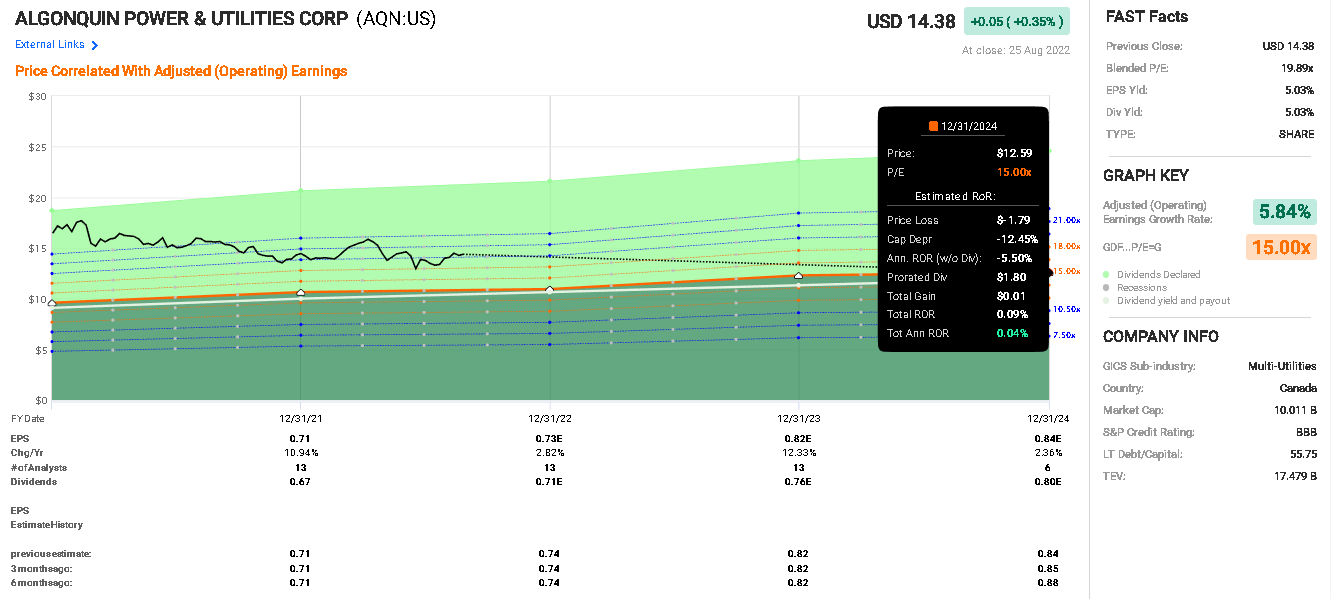
(I’ve used 2024 here as there are more analysts following AQN with only 1 analyst following ARTNA providing a 2023 estimate. For a full comparison using FAST Graphs, if we assume a 15x P/E for AQN at 2023, the loss would be $2.08 for a total annualized rate of return of -5.6% including the impact of dividends.)
This outcome is superior to ARTNA’s prospects and provides more safety against a decline to a more reasonable P/E ratio as AQN has a more subdued P/E ratio and it also has prospects for stronger growth going forward. The more reasonable valuation for AQN would allow the investor to more fully participate in the future growth of the company and the underlying increase in earnings. It is easier to enjoy the increase in company value when purchasing at a lower P/E multiple.
Issuing new shares
A final note of caution, for both ARTNA and AQN, is the continued issuance of new shares. Both ARTNA and AQN issue new shares regularly beyond what I would normally like to see, with AQN posting a sizeable increase in the number of shares outstanding them and doubling them in only a few years.
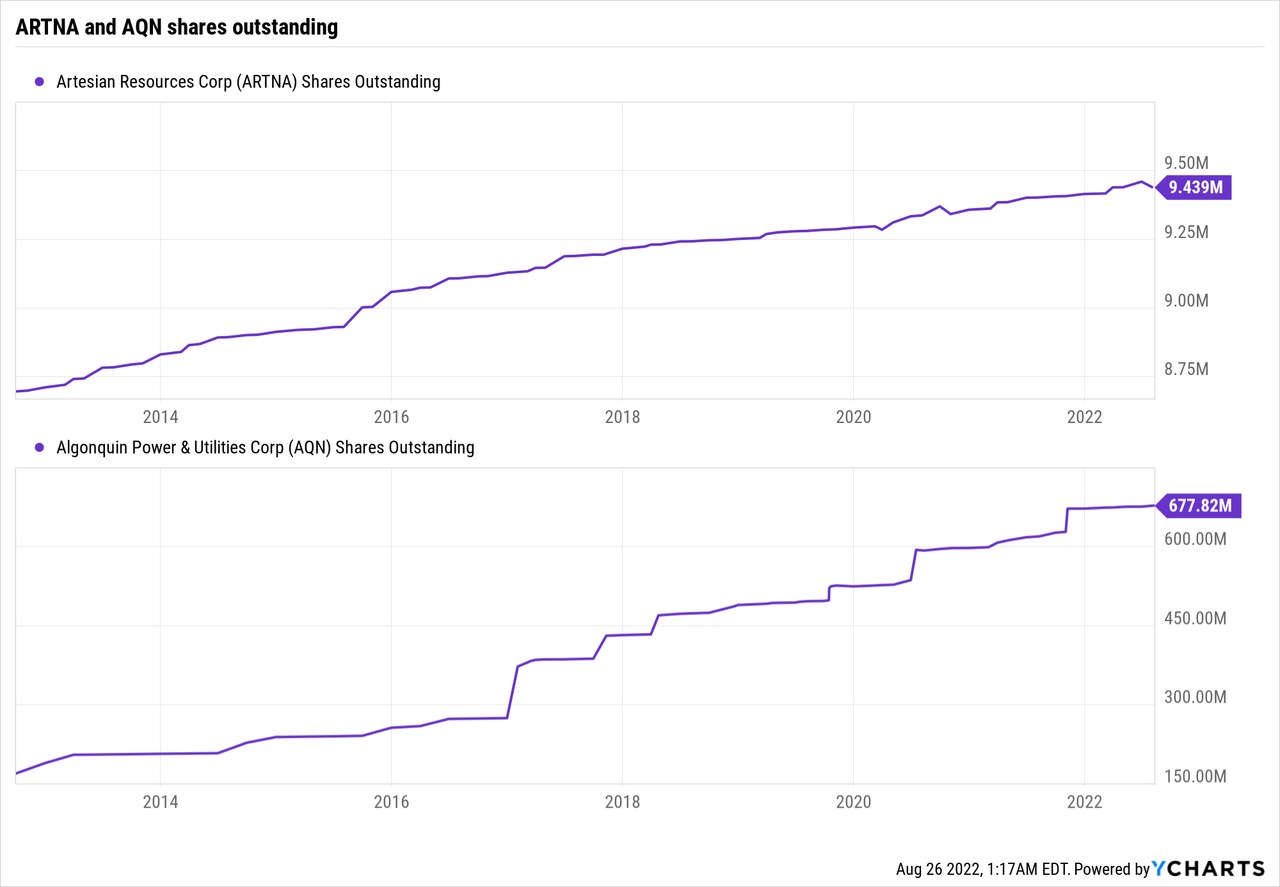
Figure 7. Shares outstanding for AQN and ARTNA
Comparison to the S&P 500
How do these options compare to the S&P 500, investing broadly in the market? Are AQN or ARTNA better or worse than investing in the S&P 500 (SPY) if we expect a P/E decline? We might expect -2.66% returns until end of 2024 if prices decline to the normal P/E ratio of 15x, based on analyst estimates for earnings (Figure 8).
Figure 8. SPY returns showing possible capital loss if PE returns to 15x by the end of 2024 (FAST Graphs)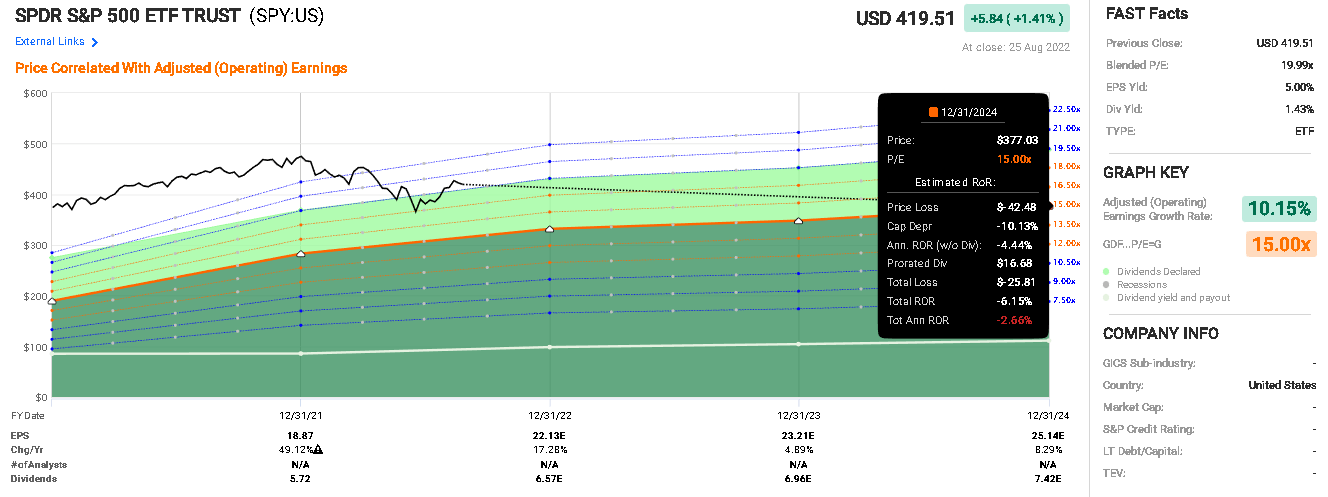
From this, we can see that AQN presents 3.5x the yield and a negligible gain vs a -2% loss on the SPY for investments until 2024. Either the SPY or AQN would avoid the potential for a significant capital loss that ARTNA investors may face at this level of overvaluation.
Takeaways
I like utilities. They pay healthy dividends and keep paying healthy dividends. However, I am becoming increasingly wary of adding to positions or opening new positions at the existing valuations, which I consider high in the water utilities segment.
Based on my analysis, while ARTNA is now trading at a level commensurate with the peers in the water utilities segment, I still consider that it is overvalued and ripe for either a fall or to trade sideways for years while earnings grow slowly. As I note, investors interested in the security of utilities, therefore, should consider other options. I’ve presented AQN as a slightly riskier alternative that delivers superior earnings growth, dividend growth, and the likelihood of better returns than ARTNA. Further, AQN is expected to deliver better returns than the market, broadly, positioning it as an effective buy in this environment.
I believe that ARTNA is trading at unreasonably high valuation levels and deserves a SELL, given the potential for considerable loss if prices decline in the near term, and weak or anaemic returns at best if held for many years. This is particularly true as we head into a recessionary environment, we have high interest rates, and there is the potential for significant P/E declines driven by price corrections from elevated levels.
Be the first to comment