

Darren415
This article was first released to Systematic Income subscribers and free trials on Jan. 15.
In this article, we highlight the BDC Ares Capital (NASDAQ:ARCC) and discuss the reasons we added a position in the stock across two of our Income Portfolios. Specifically, we outline the reasons why we rotated capital from the Oaktree Specialty Lending Corp (OCSL) to ARCC and highlight the differences between the two BDCs.
Some Background
In this section, we provide some background behind the switch from OCSL to ARCC in two of our Income Portfolios.
We first added OCSL in late 2022 with the view that OCSL was running a higher-quality portfolio in a worsening macro environment and was trading at a very attractive valuation, providing a significant margin of safety for investors. This original position has outperformed the broader sector by 13% as the chart below shows.
Systematic Income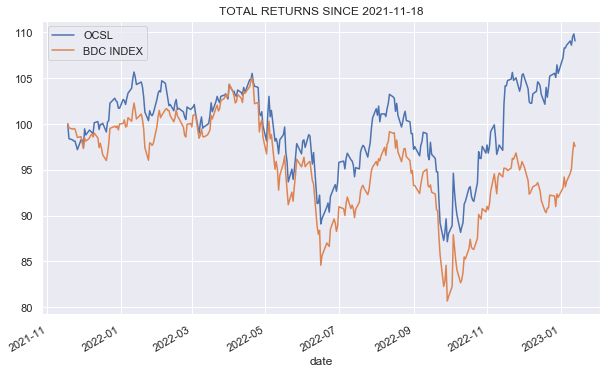
We then added to our OCSL position in mid-June, which has also outperformed the sector by a smaller 8%.
Systematic Income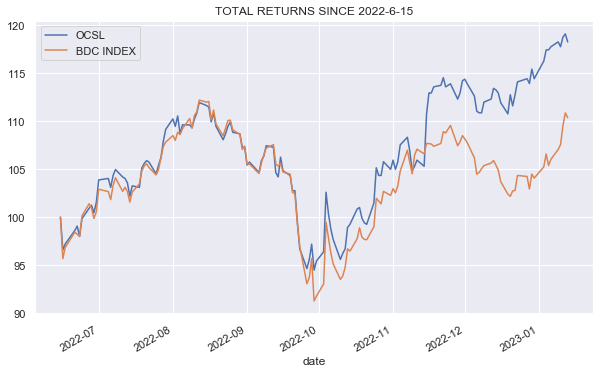
So, if OCSL has done so well relative to the sector, why are we ditching it for another? In the following section, we discuss the reasons for the switch.
Flipping The Switch
There are three main reasons for the switch to ARCC from OCSL.
One is that ARCC has generated stronger total NAV returns.
Systematic Income BDC Tool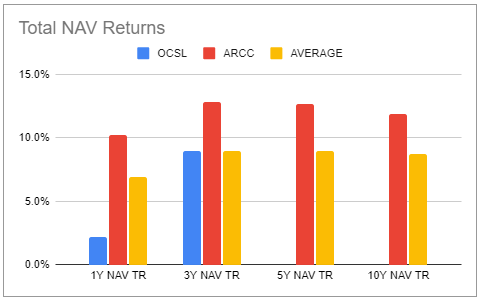
Two, OCSL has run up to what looks to be an expensive valuation. As we suggest below, this may be overstated somewhat but likely not by much.
Systematic Income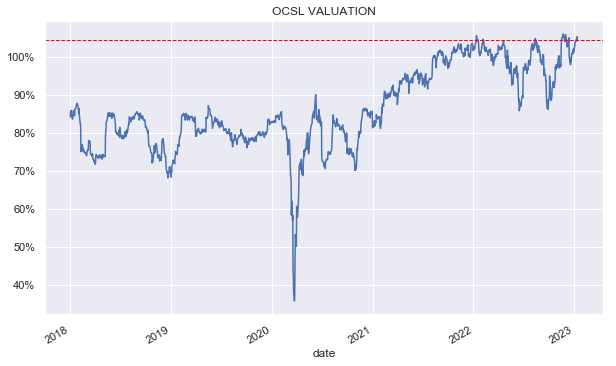
The chart below shows that when we made the switch to ARCC, OCSL’s valuation over the sector average was a very expensive 11%.
Systematic Income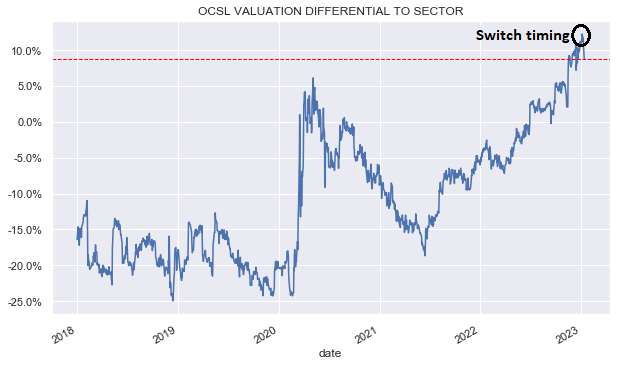
The chart below shows the valuation of both OCSL and ARCC. OCSL has tended to trade at a lower valuation vs. ARCC but has recently moved to a higher valuation – an unusual development.
Systematic Income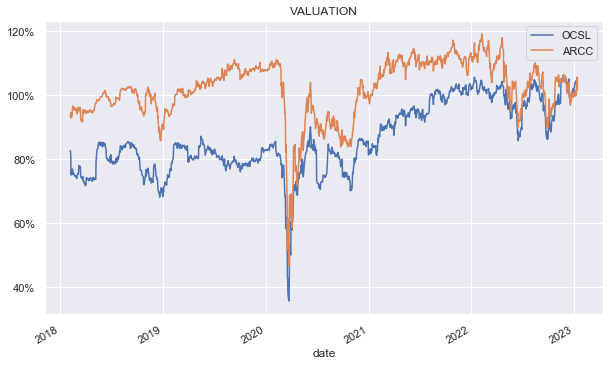
This chart shows the valuation differential between the two stocks. It shows that OCSL only recently moved to trade at a higher valuation. We recommended the switch once the valuation differential moved to 5% i.e. when OCSL traded at a 5% higher valuation vs. ARCC.
Systematic Income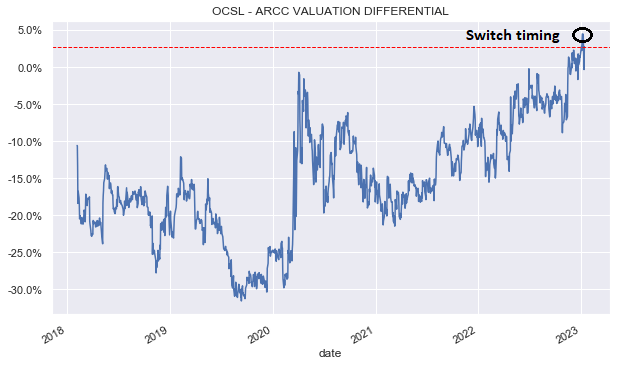
The third reason for the switch is that ARCC has an advantage in terms of net income beta to rising short-term rates. The following table from our BDC Tool collates the key metrics and shows that ARCC has a much lower level of floating-rate debt which keeps its cost of debt well below that of OCSL – a gap that will only continue to widen in the coming several quarters. For instance, while ARCC’s cost of debt has increased by only 0.7% through the first 3 quarters of 2021, OCSL’s cost of debt has increased by 2.1% since then. This, along with a slightly higher level of leverage, translates into a net income sensitivity of 15% – nearly twice the level of OCSL. In short, ARCC’s net income will continue to increase at a significantly faster pace than that of OCSL’s.
Systematic Income BDC Tool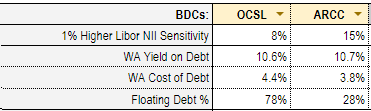
A Quick Review of ARCC
In this section, we review some of the key points about ARCC.
ARCC recently guided Q4 numbers in relation to its public offering. Core EPS is expected to be around $0.62, which would be a double-digit jump relative to Q3. NAV is expected to fall by a modest 1%, resulting in a positive total Q4 return.
Last quarter, ARCC raised its regular dividend to $0.48 from $0.43 – the third increase this year and the largest increase in the company’s history. Based on the $0.48 dividend, Q3 coverage fell to 104%. However, this number is clearly understated as the company’s net income should continue to increase, all else equal. We expect further dividend hikes, given net income will significantly outstrip the base dividend.
The valuation of the stock dipped to about a 6% premium relative to the sector with the recent public offering which, historically, has offered a good entry point into the stock.
Systematic Income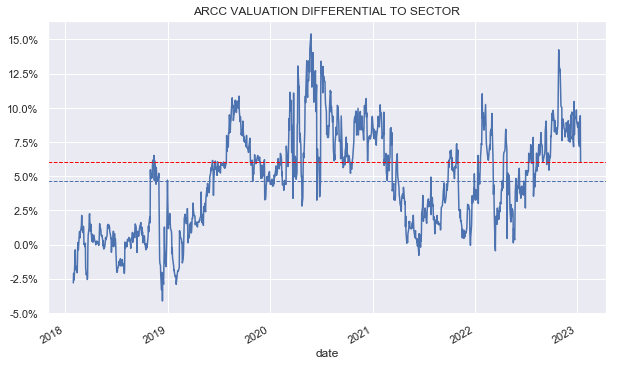
Overall, ARCC remains one of the strongest performers in the BDC sector without having an egregiously high valuation.
Systematic Income BDC Tool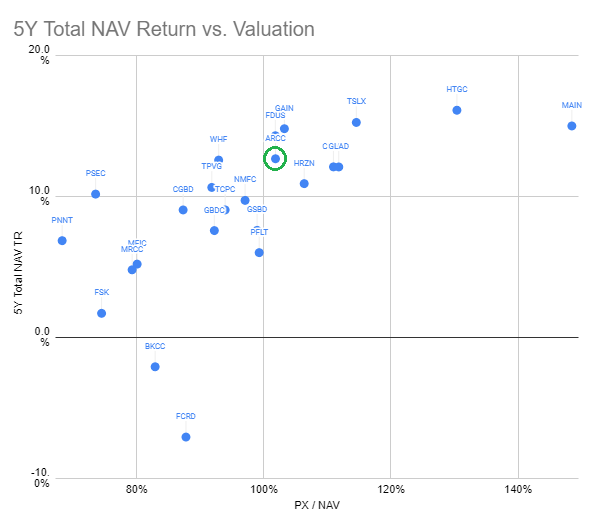
Another way to combine the valuation and historic returns is to simply divide the two with the ratio indicating a historic return relative to today’s price. On this metric, ARCC stands out.
Systematic Income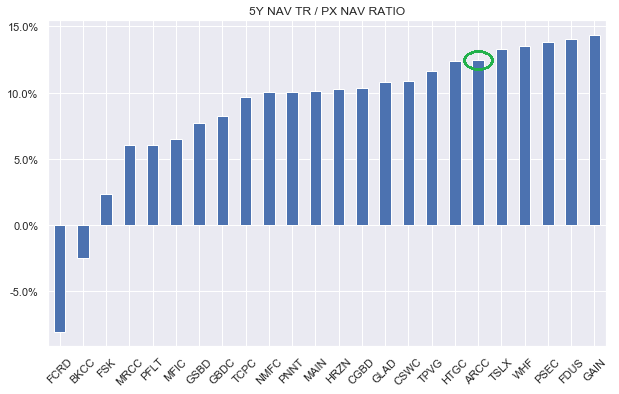
Points Of Difference
In this section, we highlight some of the differences between the two BDCs that are otherwise fairly similar. Both BDCs operate at the upper end of the middle-market segment with ARCC at a $213m weighted-average EBITDA and OCSL at $130m.
In terms of portfolio allocation, ARCC has less of a first-lien focus with around 54% in first-lien assets with a greater allocation to subordinated, preferreds, and common equity assets. This can allow the company to generate more upside in a strong market environment, though, at the same time, it can expose it to greater losses as well. So far, we haven’t seen much movement in the ARCC NAV – it’s down a bit more than 3% since the end of 2021, indicating fairly resilient portfolio quality.
Systematic Income BDC Tool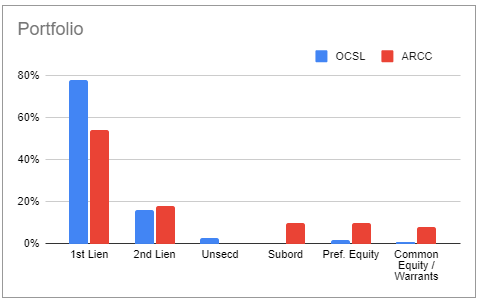
The fee structure of the two companies is mixed. They have the same base management fee. ARCC has a better profile in its higher hurdle level for the accrual of the net income incentive fee and a total return hurdle. OCSL, however, has a lower incentive fee level. Overall, ARCC is arguably slightly ahead in the fee structure.
ARCC has a longer history of going back a couple of decades while Oaktree only started managing the portfolio it took over from Fifth Street in late 2017. This doesn’t make ARCC better than OCSL but it can give investors more confidence given ARCC has a longer track record of performance which covers the GFC, the Energy crash in 2015, and the COVID period. The ARCC NAV powered through all these periods and emerged higher on the other side.
Systematic Income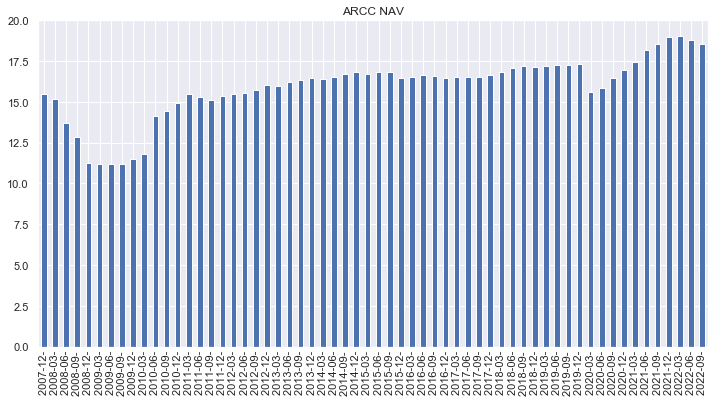
In terms of diversification, ARCC has the largest number of positions in our BDC coverage universe at 458 companies. OCSL is closer to the sector average at 149.
In terms of sector allocation, both BDCs have Software as the largest sector with healthcare-related sectors not far behind.
ARCC, Oaktree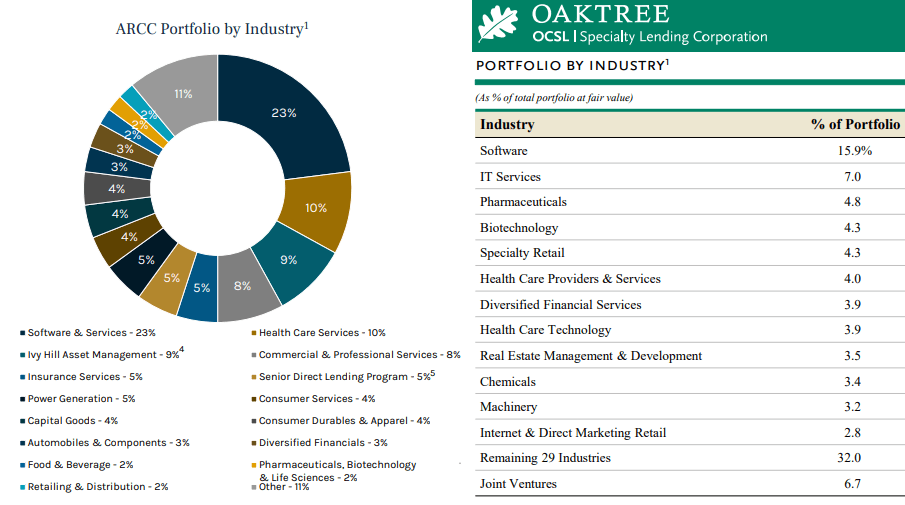
Risks To The Rotation
Our rotation from OCSL to ARCC is predicated on the valuation differential, historic total NAV returns, net income growth differential, and potential upside, which all benefit ARCC at the moment. That said, there are some risks to this view. In this section, we set out a few counterarguments to the rotation.
One possible counterargument is that the OCSL NAV is understated because OCSL appears to be more conservative in its marks i.e. it takes down its NAV harder than the rest of the BDC sector during periods of weakness. This is in part from holding publicly traded loans but that only explains a small portion of this dynamic. The chart below shows that the OCSL NAV falls more during down NAV periods for the sector.
Systematic Income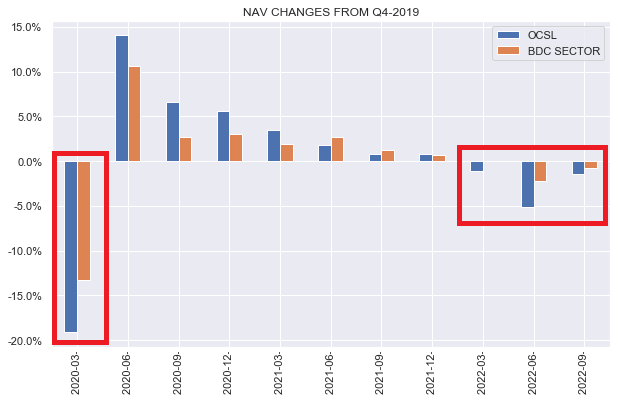
We have some sympathy with this argument, however, even if the entire NAV return differential to the sector for the first 3 quarters of the year is not real, it would still leave OCSL fairly expensive as its valuation premium vs. the sector at the time of our rotation would still be 7% (it’s slightly less as of this writing).
Another counterargument to our rotation is that the previous OCSL valuation is not representative of where OCSL should trade today. In other words, perhaps OCSL was weighed down by the legacy portfolio when it took over in 2017. This is possible though not something that can be proved. One argument against this view is that OCSL underperformed each quarter of 2021 as the following chart shows, which suggests that when it was sufficiently removed from its legacy assets or COVID influence, it wasn’t able to outperform the sector.
Systematic Income BDC Tool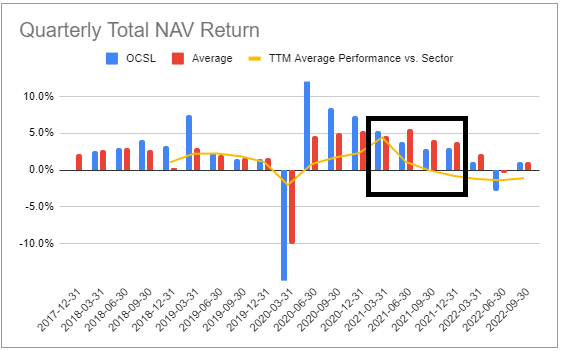
Overall, an argument can be made that OCSL deserves its elevated valuation. However, we are skeptical that “this time is different” and prefer an additional margin of safety and other positive factors that we see in ARCC. Investors who don’t have an OCSL position to rotate from can still find value in ARCC, particularly for a starter position.
BDCs have performed very well since the start of the broader income market drawdown. That said, investors can potentially further boost their returns by allocating within the sector in response to shifts in valuation, particularly if those shifts do not appear to be fully supported by fundamentals. This combination of beta and alpha sources of returns can prove superior over the longer term.
Be the first to comment