

Chip Somodevilla/Getty Images News
The investment thesis
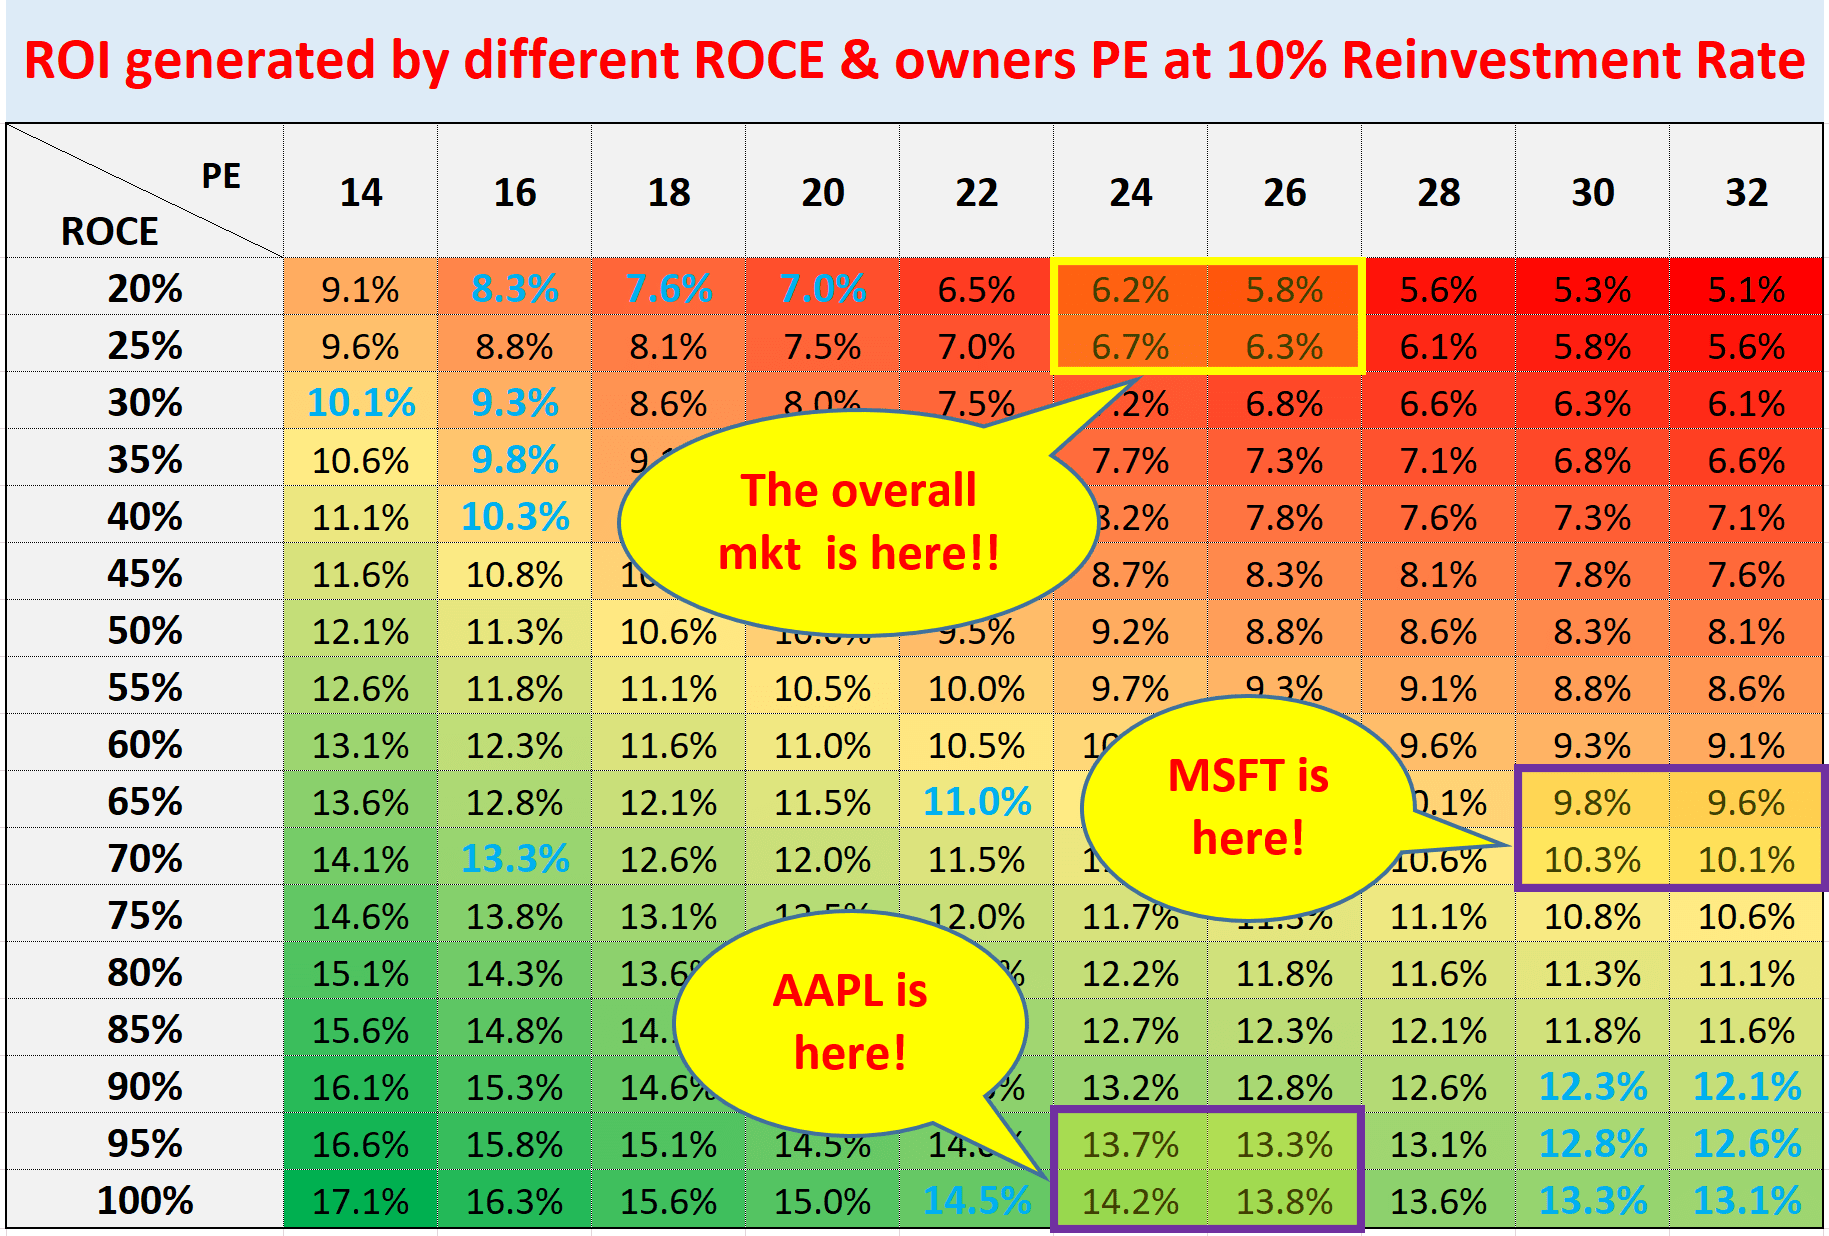
The thesis of this article is really simple – under the current conditions, both Apple (NASDAQ:AAPL) and Microsoft (NASDAQ:MSFT) provide far superior returns for long-term investors than the overall market. The key argument is built on the following chart. This chart also is the roadmap that we use in our Marketplace service to pick our tactical holdings. Having a coherent investing roadmap keeps us clear-headed, especially during challenging times like this.
You will see from the following chart, AAPL is projected to provide about 13% annual return (“ROI”) in the long term and MSFT about 10%, while the overall market is only about 6.5%. The main reasons are threefold:
- Their far superior ROCE (return on capital employed) over the market average, which gives it the ability to grow without the need for too much capital and subsequently can return most of the earnings to shareholders (either as dividends or share buybacks).
- Their fundamental business models provide a stable moat and enjoy strong secular support.
- Yet both of them sell at a similar valuation compared to the overall market.
Then we will detail the reasons why we only own AAPL even though both are good candidates to play the world’s unstoppable shift toward a digital future. As you will see, the primary reason is that we like a concentrated portfolio and usually limit our exposure to one sector to one holding. And we choose AAPL because of its better profitability and its consumer-centric business model. We feel consumer stickiness, once established, is longer lasting and harder to change.
Source: author
How did we build our roadmap and how did it perform?
The key in building this road is to think like a business owner, not a stock trader. As detailed in our earlier article:
- The long-term ROI for a business owner is simply determined by two things: A) the price paid to buy the business and B) the quality of the business. More specifically, part A is determined by the owner’s earning yield (“OEY”) when we purchased the business. And that is why PE is the first dimension in our roadmap. Part B is determined by the quality of the business and that is why ROCE, the most important metric for profitability, is the second dimension in our roadmap.
- Now, the long-term growth rate is governed by ROCE and the Reinvestment Rate. These are the two most important growth engines, and they mutually enhance each other. High ROCE means every $1 reinvested can lead to a higher growth rate, which leads to more future profits and more flexible capital allocation to fuel further growth, and so on. So to summarize:
- Longer-Term ROI = valuation + quality = OEY + Growth Rate = OEY + ROCE*Reinvestment Rate
The performance of our stocks picked using this road is recently updated in this article. Using the date I first published our portfolio on 5/31/2021 as the inception date, our picks have outperformed the S&P 500 by about 11%.
With this background, the remainder of this article will show how the above roadmap applies to AAPL and MSFT.
APPL vs MSFT: the competitive landscape
AAPL and MSFT compete head-on in many of their core areas, ranging from operation systems, digital ad, mobile devices, PCs and laptops, et al. Besides their own competitions, they also face competition from all sides. No big tech companies stay in their own corner these days. For example, MSFT’s Bing search is in direct competition with Google. GOOG’s Chrome OS and Android OS now have become popular desktop operating systems in the world, directly and meaningfully competing with MSFT Windows and also Apple IOS.
But overall, they dominate the intersection of technology and consumer access. As such, both are protected by a formidable moat and well positioned to benefit from our world’s continued shifts toward digitalization. And the good news is that the pie is getting bigger itself as our appetite grows exponentially for data, automation, and entertainment.
Although we like AAPL better ourselves, we really do not see a bad choice here. Investors just need to pick the one that suits their own risk profile and fits in their own circle of competence.
For us, we understand AAPL’s consumer-centric business model better than MSFT’s enterprise-centric model. AAPL has mastered the interplay of freemium pricing and premium pricing strategy with billions of consumers. It can set substantially higher prices for its products (ranging from iPhone, MacBook, iPad, et al) than Microsoft and Android devices. As you will see immediately below, it has created a profitability category of its own kind.

Source: https://startuptalky.com/apple-vs-microsoft-marketing-strategy/
MSFT: more consistent and aggressive R&D
First, we do not invest in a given tech stock because we have high confidence in a certain product that they are developing in the pipeline. Instead, we feel more comfortable betting on A) the recurring resources available to fund new R&D efforts sustainably, and B) the overall efficiency of the R&D process. So correspondingly, in the long run, I feel comfortable as long as a tech business can A) sustainably support new R&D expenditures, and B) has demonstrated a consistent R&D yield. I do not feel the need to particularly bet on any one of the new products to be a hit (or a complete failure).
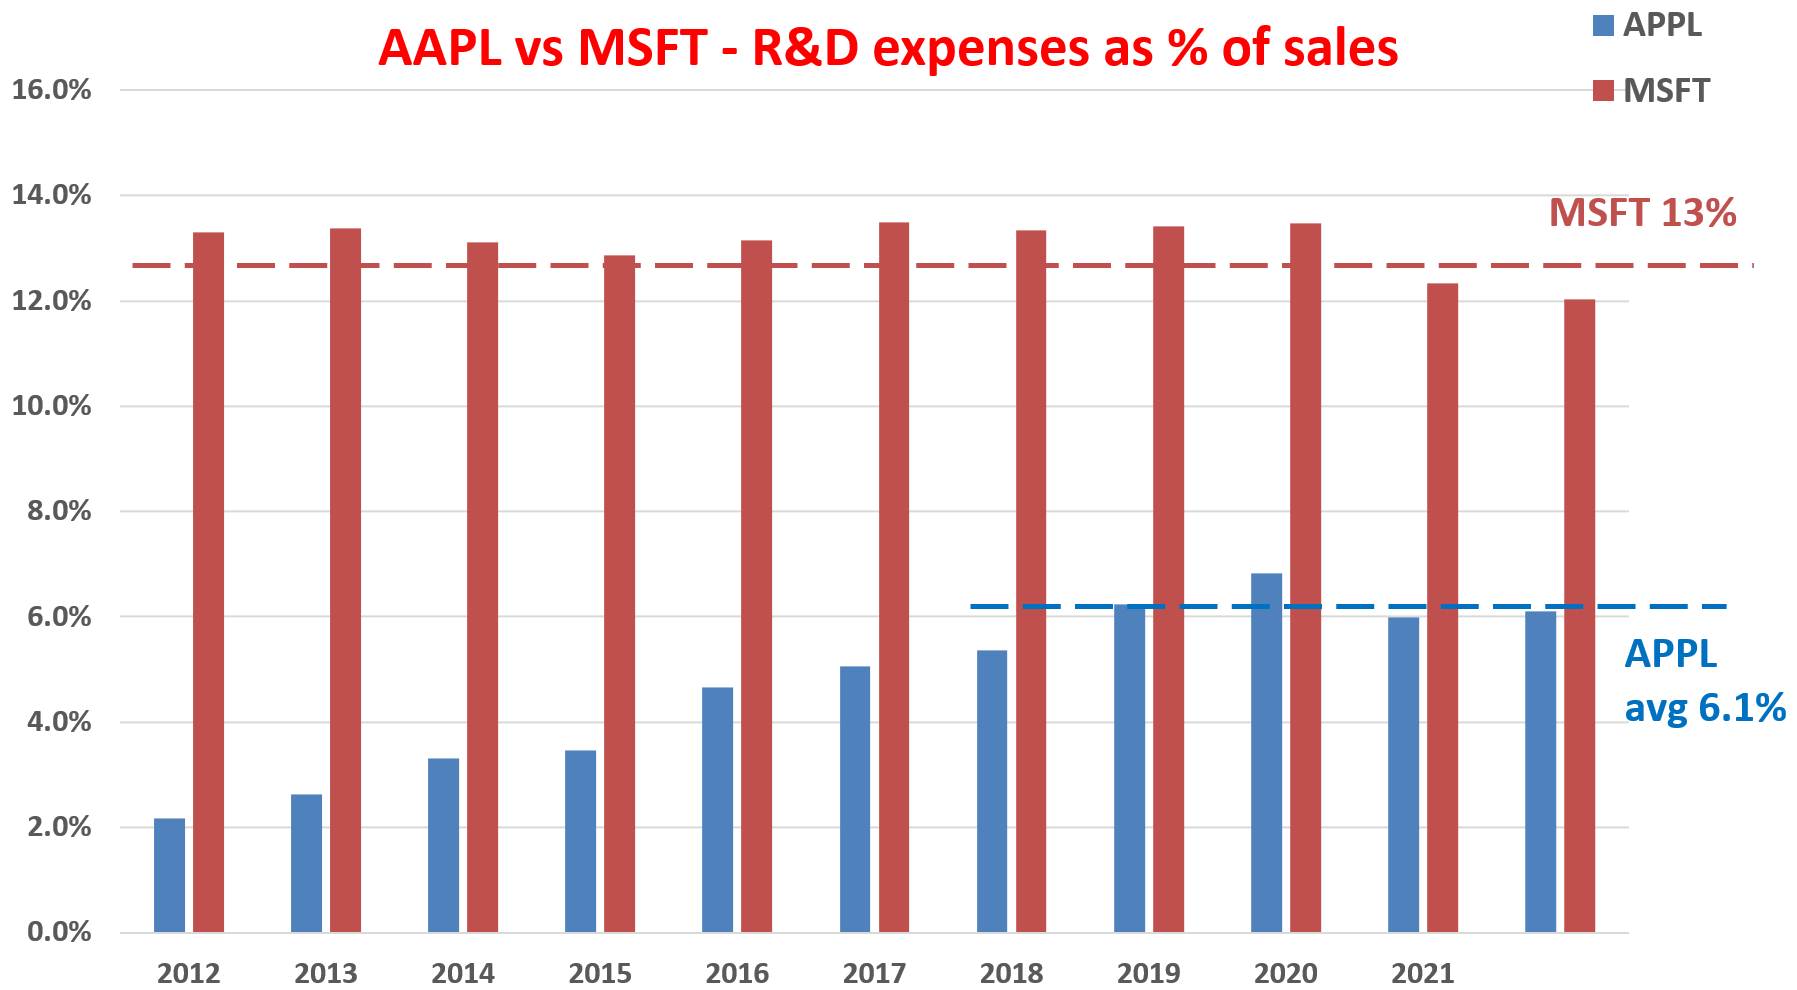
So let’s first see how well and sustainably MSFT and AAPL can fund their new R&D efforts. The short answer is: Extremely well. The next chart shows the R&D expenses of MSFT and AAPL over the past decade. As seen, both have been consistently investing heavily in R&D. A few observations:
- MSFT has been spending very consistently on R&D, on average about 13% of its total revenue.
- AAPL’s story is a bit more colorful. It did not spend that much on R&D earlier in the decade. Partly because AAPL products were so disruptive at that time and enjoyed a quasi-monopoly status. Partly because Steve Jobs himself did not believe in R&D spending. He commented that “Innovation has nothing to do with how many R&D dollars you have. It’s not about money.”
- Then Tim Cook transitioned it to a different model. He more than doubled the R&D expenses since he took over. The R&D expenses are on average about 6.1% of sales now, still lower than other tech giants in relative terms. But in absolute terms, it’s a mind-boggling amount (exceeding $20 billion in 2021).
Author
Then the next question is, how effective is the R&D process? The short answer is again: Extremely effective. We ourselves like to use a variation of Buffett’s $1 test on R&D expenses. We do not only listen to CEOs’ pitches on their brilliant new ideas that will shake the earth (again). We also examine the financials to see their words are corroborated by the numbers. And in MSFT and AAPL’s case, they are.
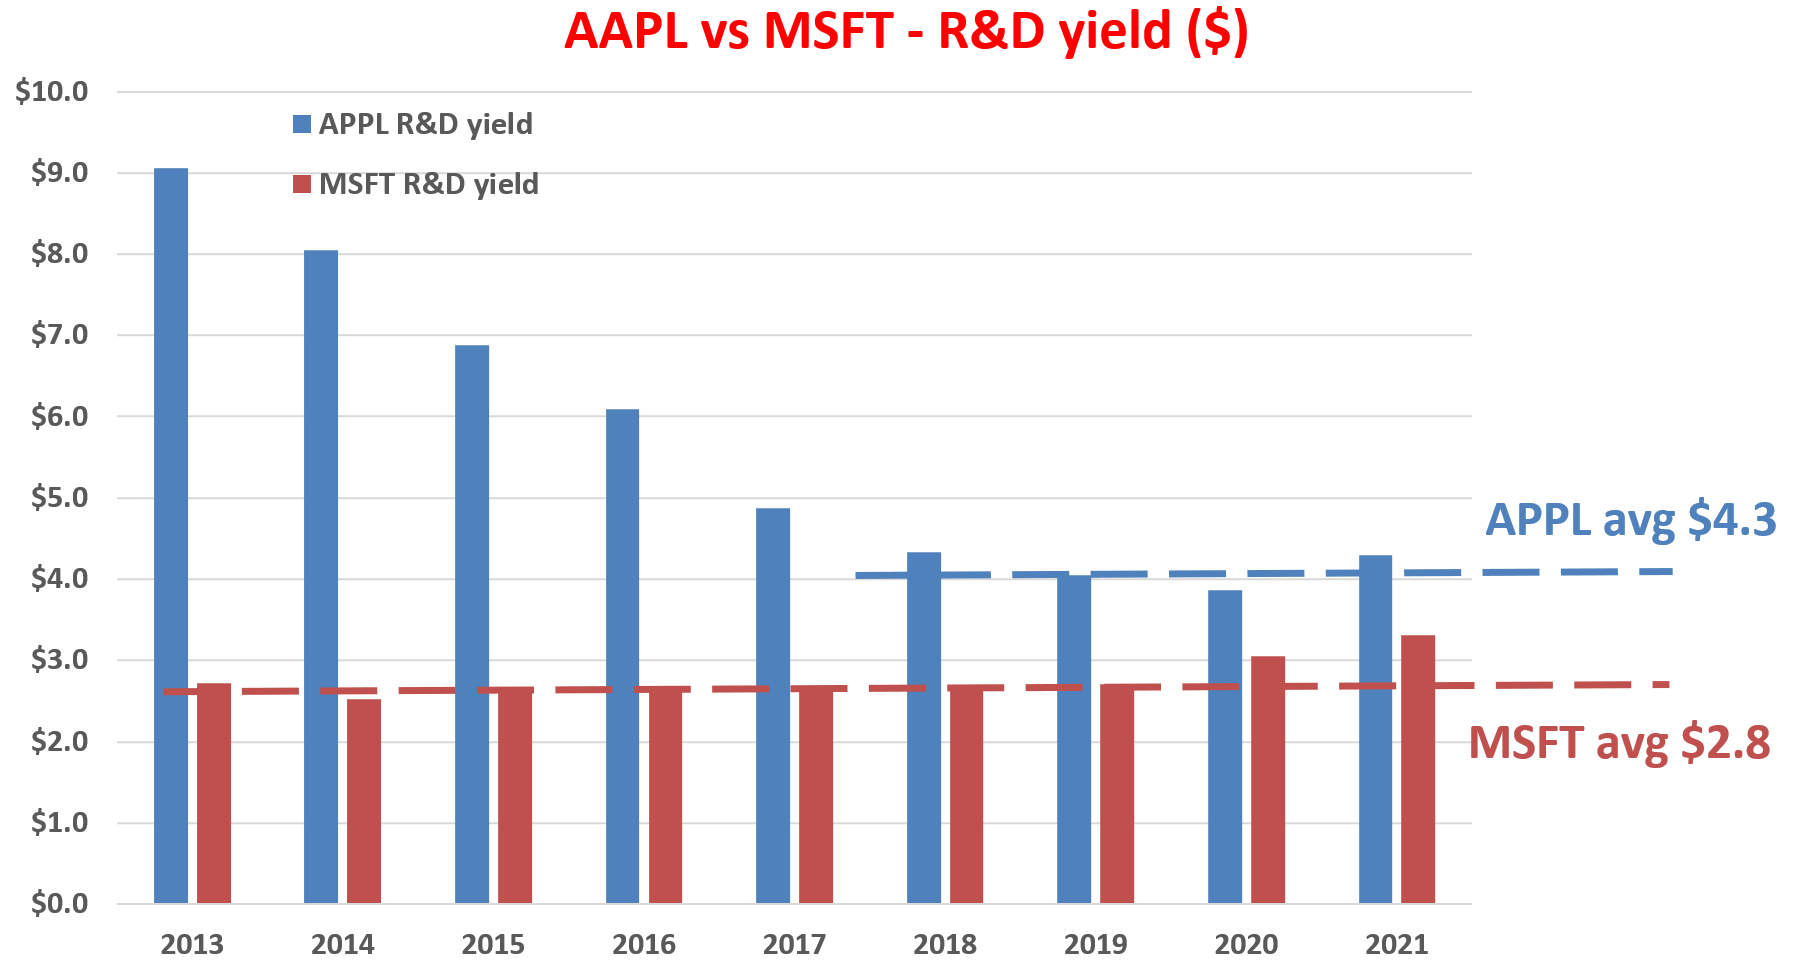
The purpose of any corporate R&D is obviously to generate profit. Therefore, it’s intuitive to quantify the yield by taking the ratio between profit and R&D expenditures. This way we can quantify how many dollars of profit has been generated per dollar of R&D expenses (i.e., the $1 test), as shown in the next chart. In this chart, I used the operating cash flow as the measure of profit. Also, most R&D investments do not produce any results in the same year. They typically have a lifetime of a few years. Therefore, this analysis assumes a three-year average investment cycle for R&D. And as a result, we use the three-year moving average of operating cash flow to represent this three-year cycle.
A few key observations:
- The R&D yield for MSFT is again very consistent, boasting a long-term average of $2.8 of yield per $1 of R&D expenditure. The consistency again shows the stable moat.
- AAPL, as usual, has a more colorful story. As you can see, its R&D yield has been more than $10 in 2013 under the tutelage of Steve Jobs. And it has declined to a range between $4.0 and $5.0 in recent years with an average of $4.3.
- You might interpret the decline of AAPL’s R&D yield as bad news. However, keep in mind that A) the level of profitability AAPL enjoyed in the early part of the decade is simply unsustainable, B) the decline is only relative to its own glorious past.
- Overall, both AAPL and MSFT enjoy R&D yields that are very competitive. To put things under perspective, for the overachieving FAAMG group, their average R&D yield is “only” about $2.5.
Then as we will next, both MSFT and AAPL enjoy superb profitability to fuel their R&D efforts sustainably, which will lead to sustainable growth in turn.
Author
Both enjoy superb profitability but AAPL in its own category
When we think of long-term growth (like in 10 years or more), the framework I use is the following. In the long term, the growth rate is “simply” the product of ROCE and reinvestment rate, i.e.,
Long-Term Growth Rate = ROCE * Reinvestment Rate
ROCE stands for the return on capital employed and is the most important metric for measuring profitability. Note that ROCE is different from the return on equity (and more fundamental and important in my view). ROCE considers the return of capital ACTUALLY employed and therefore provides insight into how much additional capital a business needs to invest in order to earn a given extra amount of income – a key to estimating the long-term growth rate.
The detailed background ROCE has been detailed in my early articles and I will just directly quote the results below. In this analysis, I consider the following items capital actually employed A) Working capital (including payables, receivables, inventory), B) Gross Property, Plant, and Equipment, and C) Research and development expenses are also capitalized.
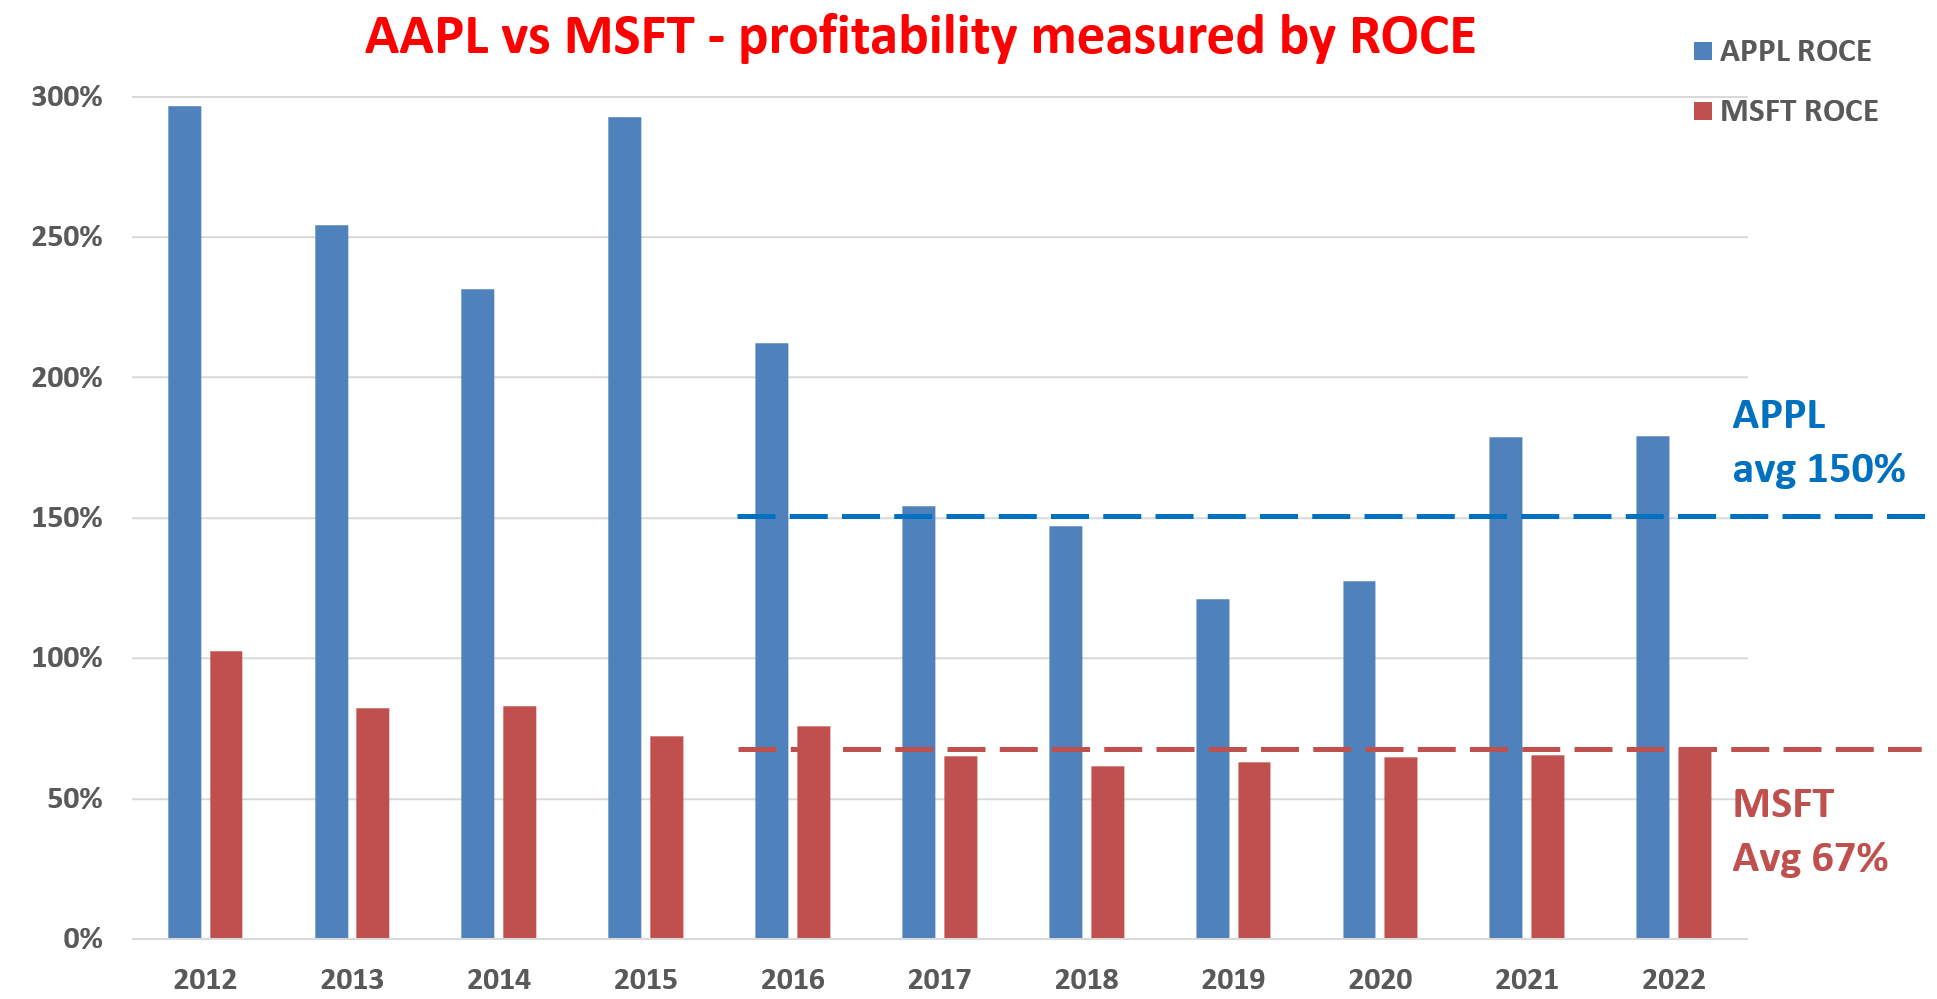
Based on the above considerations, the ROCE of MSFT and AAPL over the past decade is shown below. As seen,
- MSFT again is able to maintain a remarkably high ROCE and consistent level of ROCE: On average about 67% in recent years.
- AAPL’s ROCE again has “declined” from an unsustainable level of 200% to 300% in the early years of the decade to the current level of around 150% in recent years.
- But the keyword here is again relative. Their current level of ROCE may be higher or lower relative to each other or their own past. But any ROCE above 60% is remarkable. To put things under perspective, the overachievers in the FAAMG pack have an average ROCE of around 50% in recent years.
Author
In terms of reinvestment rate, both companies enjoy enviable capital allocation flexibility. The capital allocation picture is really simple for both companies here: Both earn a load of cash organically from their operations but do not need to spend much.
Given their high ROCE, it obviously makes total sense to reinvest as much of their earnings back into the business to fuel further growth as possible. But the problem is that for businesses at this scale, there are just not that many opportunities to reinvest the earnings. As a result, both have been allocating a large part of the remaining earnings to buy back shares. According to the current financials available on Seeking Alpha, as of TTM 2022, MSFT has been spending about 33% of the OPC on average on share repurchases, and AAPL even higher, about 77%.
All told, my estimates are that MSFT has been maintaining a reinvestment rate between 7.5% to 10% in recent years, and AAPL about 5% to 7.5%. And we will see the implications of the investment rates next.
Back to the roadmap
For AAPL, at its current price levels, the OEY is about ~3.8%. The growth rate is about 7.5% assuming a 7.5% reinvestment and a ROCE of 100% to be a bit conservative, resulting in a double-digit ROI already! For MSFT, the OEY is about ~3.3%. The growth rate is about 6.7% assuming a 10% reinvestment and a ROCE of 67%, resulting in about 10% ROI.
This is a key insight that we’ve learned from Buffett – when you think like a business owner, you do not need a 10% growth rate to achieve a 10% return. We feel much more comfortable with a few percent of reliable and sustainable growth rate in stocks that we understand well.
The road map below shows the ROI based on an assumption of a 10% reinvestment rate, which is the average rate for the large and mature businesses in the S&P 500 index. Admittedly, both MSFT’s and AAPL’s reinvestment rate (especially APPL) is not as high as 10% currently. So the total ROI would be a bit lower than what is shown in the roadmap below. However, note that both boast strong cash generation capability and fortress balance sheet, which provide the optionality to crank up reinvestment rates or to boost growth through acquisitions.
In contrast, the overall market is currently valued at about 26.5x PE, resulting in an OEY of about 3.8%. however, the overall market’s ROCE is on the order of 20% or so. And with a 10% reinvestment rate, the growth rate would be about 2%, leading to a long-term ROI of about 6% per year.

Source: author
Risks
First and foremost, I do not see any structural risk associated with AAPL or MSFT at this moment. Remotely, there might be an antitrust regulatory risk. But even if it comes to that, I’m not entirely certain if it will be bad for AAPL or MSFT investors for sure. If it really comes to that and the company has to be broken up, the market would be forced to value each of its business segments separately. And such a complete and transparent valuation may or may not result in a lower valuation.
There can be significant short-term volatility risks too. Regardless of AAPL and MSFT scale and business model, the valuation is at a high level and the overall market itself is also near a historical record valuation. There are several large macroeconomic and geopolitical uncertainties unfolding right now, including the pandemic, Ukraine conflicts, global logistic chain interruptions, and Fed’s interest rate decisions. Such a combination of high valuation and high volatility certainly could cause short terms risks – but are irrelevant for the long term.
Conclusion and final thought
When we invest like a business owner, not a stock trader, our long-term ROI is simply the sum of two things: A) the price paid to buy the business and B) the quality of the business. In both MSFT and AAPL’s case, they provide a far superior return for long-term investors than the overall market because of their far superior ROCE over the market average. Such high ROCE gives it the ability to grow without the need for too much capital and subsequently can return most of the earnings to shareholders (either as dividends or share buybacks).
The key takeaways are:
- Both dominate the intersection of technology and consumer access and both are protected by a formidable moat. They both provide favorable odds for double-digit returns in the long term.
- As such, we really do not see a bad choice here. Investors just need to pick the one that suits their own risk profile and fits in their own circle of competence.
- We like AAPL better ourselves mostly because we understand its consumer-centric business model better. We understand the roots of its superb profitability and consumer stickiness. After all and above all, having a coherent investing roadmap and staying within one’s circle of competence is the key to investing.
Be the first to comment