

imaginima
Introduction
Houston-based APA Corporation (NASDAQ:APA) released its third quarter of 2022 results on November 2, 2022.
Note: I have followed APA quarterly since 2017, with 26 articles and counting. This new article is a quarterly update of my article published on January 24, 2022.
Apache Corp. owns energy-producing assets in the U.S., the North Sea, and Egypt. Also, the company is involved with two blocks in Suriname.
APA Assets map Presentation (APA Presentation)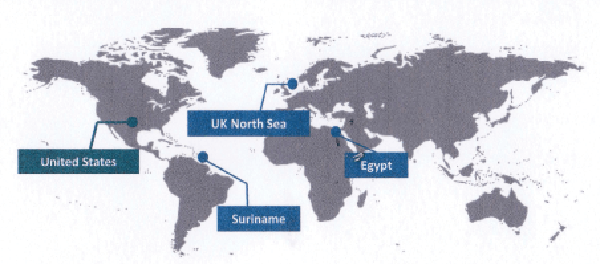
1 – 3Q22 results snapshot
During the third quarter of 2022, APA reported a net income attributable to common stock of $422 million, or $1.28 per diluted share. When adjusted for certain items that impact the comparability of results, APA’s third-quarter earnings totaled $651 million, or $1.97 on a diluted share basis.
APA 3Q22 Highlights (APA Presentation)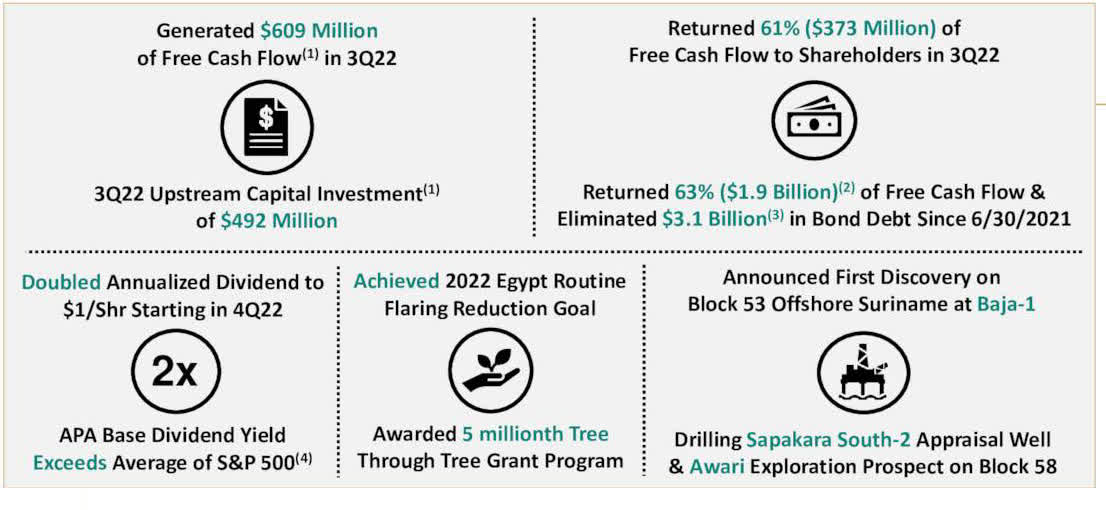
The net cash provided by operating activities was $1,104 million, and adjusted EBITDAX was $1,684 million, in 3Q22. Total Production was 381,934 Boep/d in 3Q22.
APA 3Q22 metrics presentation (APA Presentation)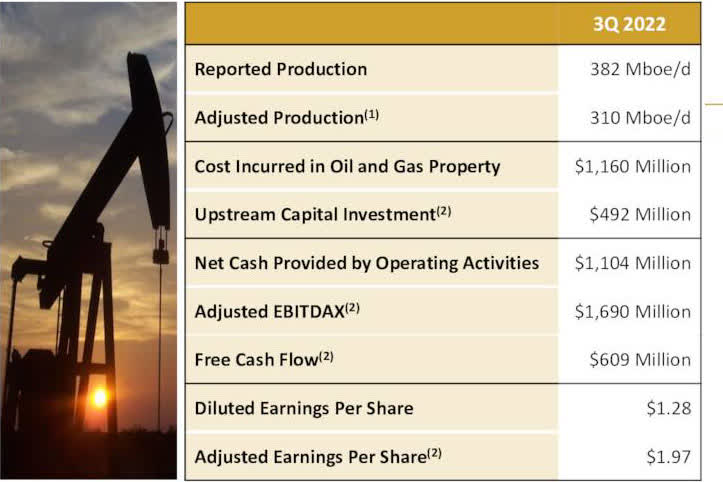
CEO John Christmann said in the conference call:
APA continues to enjoy a robust free cash flow profile provided by our unhedged exposure to a globally diversified product price mix. With activity in Egypt and the Permian Basin now at levels capable of driving sustainable corporate production growth, our free cash flow is also expected to grow, assuming flat year-over-year oil and gas prices.
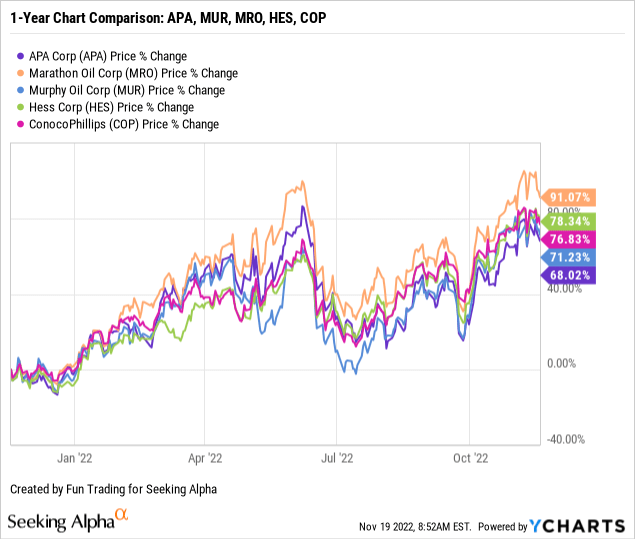
2 – Stock performance
Let’s compare APA to a few other E&P oil and gas companies (e.g., Murphy Oil (MUR), Hess Corp. (HES), ConocoPhillips (COP), Marathon Oil (MRO), etc.).
We can see that APA has underperformed the group and is up 68% on a one-year basis, down from a recent peak in June.
Balance sheet and production history for 3Q22: the raw numbers
| APA | 3Q21 | 4Q21 | 1Q22 | 2Q22 | 3Q22 |
| Revenues from oil and gas in $ billion | 2.059 | 2.299 | 2.669 | 3.047 | 2.887 |
| Total Revenues and others in $ Billion | 1.651 | 2.403 | 3.828 | 3.052 | 2.872 |
| Net Income in $ Billion | -0.083 | 0.471 | 1.813 | 0.926 | 0.422 |
| EBITDA $ Billion | 0.56 | 1.08 | 2.68 | 1.81 | 1.56 |
| EPS diluted in $/share | -0.30 | 1.05 | 5.43 | 2.71 | 1.28 |
| Cash from Operating activities in $ Million | 771 | 1,085 | 891 | 1,535 | 1,104 |
| CapEx in $ Million | 236 | 315 | 379 | 388 | 994 |
| Free Cash Flow in $ Million | 535 | 770 | 512 | 1,147 | 110 |
| Total cash $ Billion | 0.38 | 0.30 | 0.23 | 0.28 | 0.27 |
| Total LT Debt in $ Billion | 7.41 | 7.51 | 5.89 | 5.29 | 5.53 |
| Dividend per share in $ | 0.025 | 0.125 | 0.125 | 0.125 | 0.25 |
| Shares outstanding (diluted) in Million | 379 | 363 | 347 | 342 | 330 |
| Oil Production | 3Q21 | 4Q21 | 1Q22 | 2Q22 | 3Q22 |
| Total Oil Equivalent in K Boepd | 389.0 | 385.6 | 404.0 | 384.6 | 381.9 |
| International | 151.5 | 187.6 | 193.1 | 184.4 | 163.1 |
| USA | 237.5 | 228.0 | 211.0 | 200.3 | 218.8 |
| Global liquid price ($/Boe) | 71.72 | 78.52 | 100.23 | 113.79 | 97.81 |
| Global Natural gas price ($/MMBtu) | 3.87 | 4.95 | 4.70 | 5.65 | 5.62 |
Source: Company filing. Historical data since 2015 are only available to the Gold and Oil Corner subscribers.
Analysis: Revenues, Earnings Details, Free Cash Flow, And Oil Production
1 – Revenues and others were $2,872 million in 3Q22
APA Quarterly Revenues history (Fun Trading)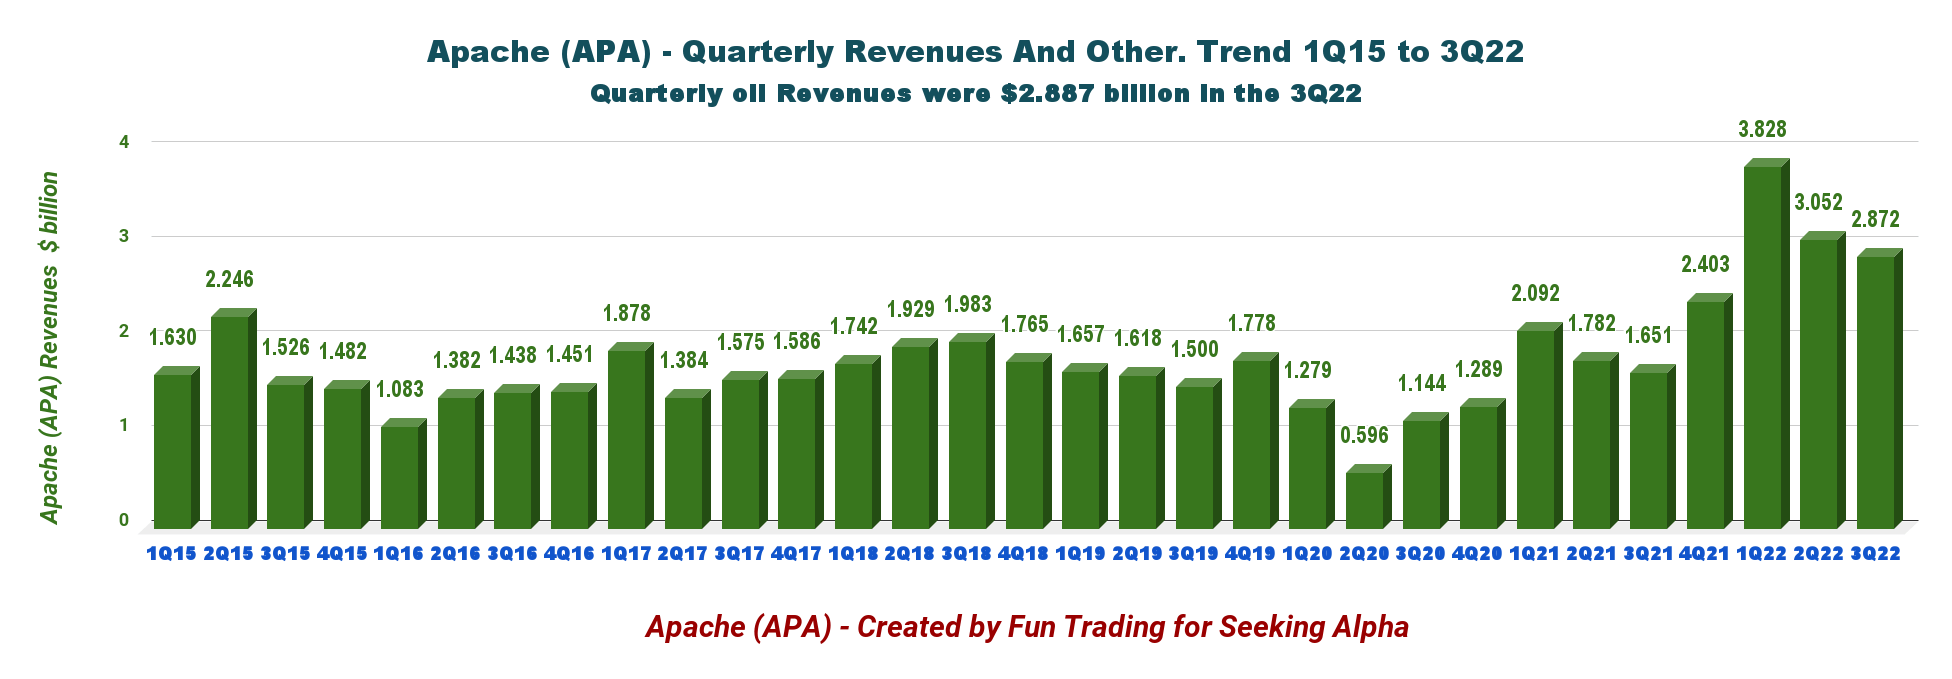
3Q22 total revenues and others were $2.872 billion (with oil revenues of $2.887 billion), up from $1.685 billion the same quarter a year ago.
Good revenues, but lower-than-expected income.
One crucial positive element is that the global liquid price was $97.81 in 3Q22 compared to $71.72 in 3Q21, as shown in the chart below. The global liquid price was down from the preceding quarter’s record of $113.79 per barrel, but significantly up from last year’s quarter, as shown below:
APA Quarterly Oil and Gas price history (Fun Trading)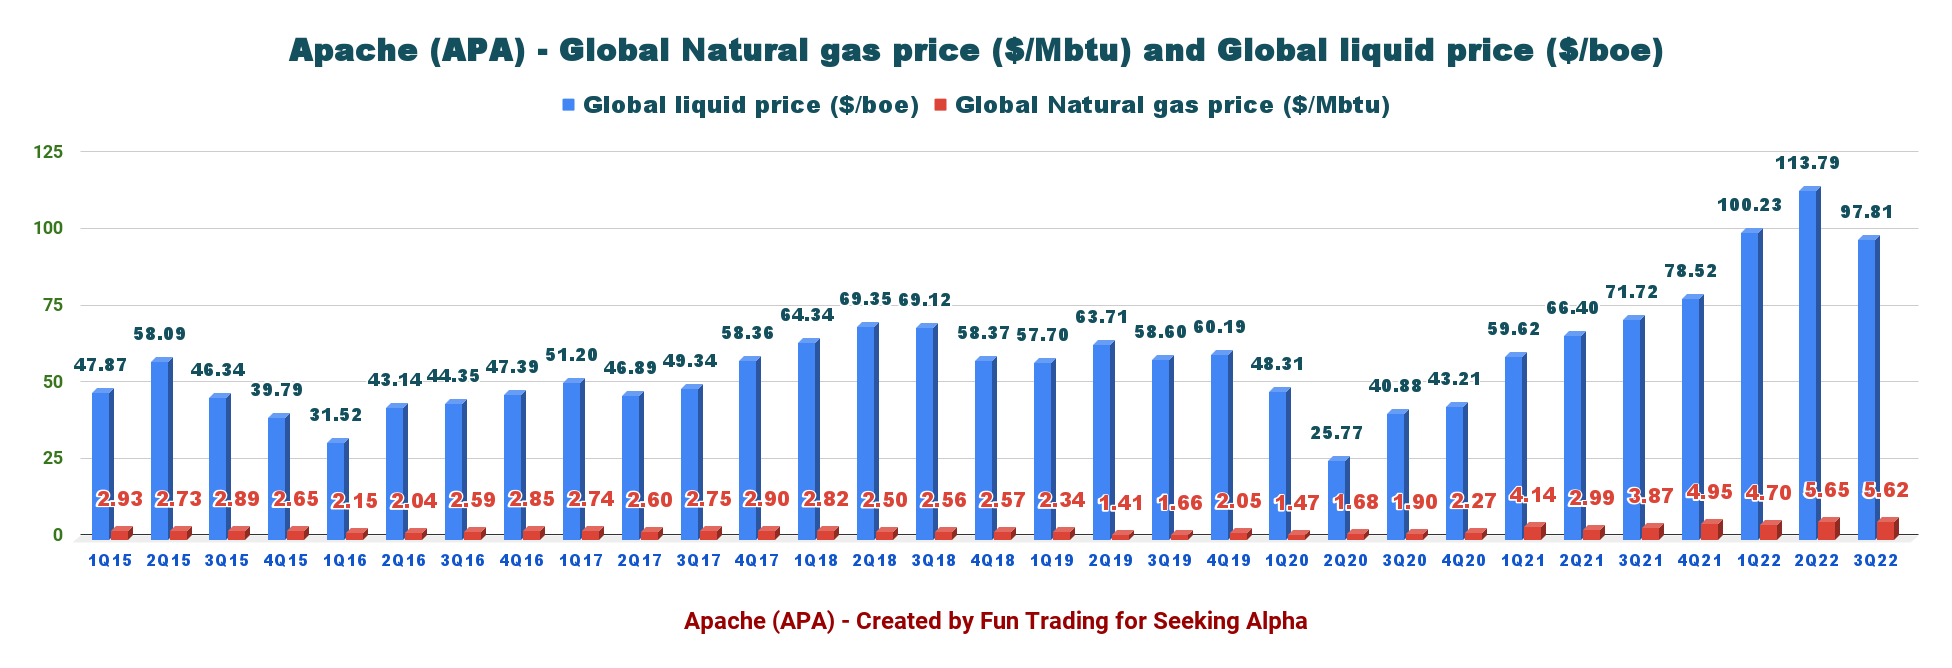
This price level allowed the company to double the dividend this quarter and buy back 10 million shares of APA common stock during the quarter at an average price of $33.85.
2 – Free cash flow was a gain of $110 million in 3Q22
APA Quarterly Free cash flow history (Fun Trading)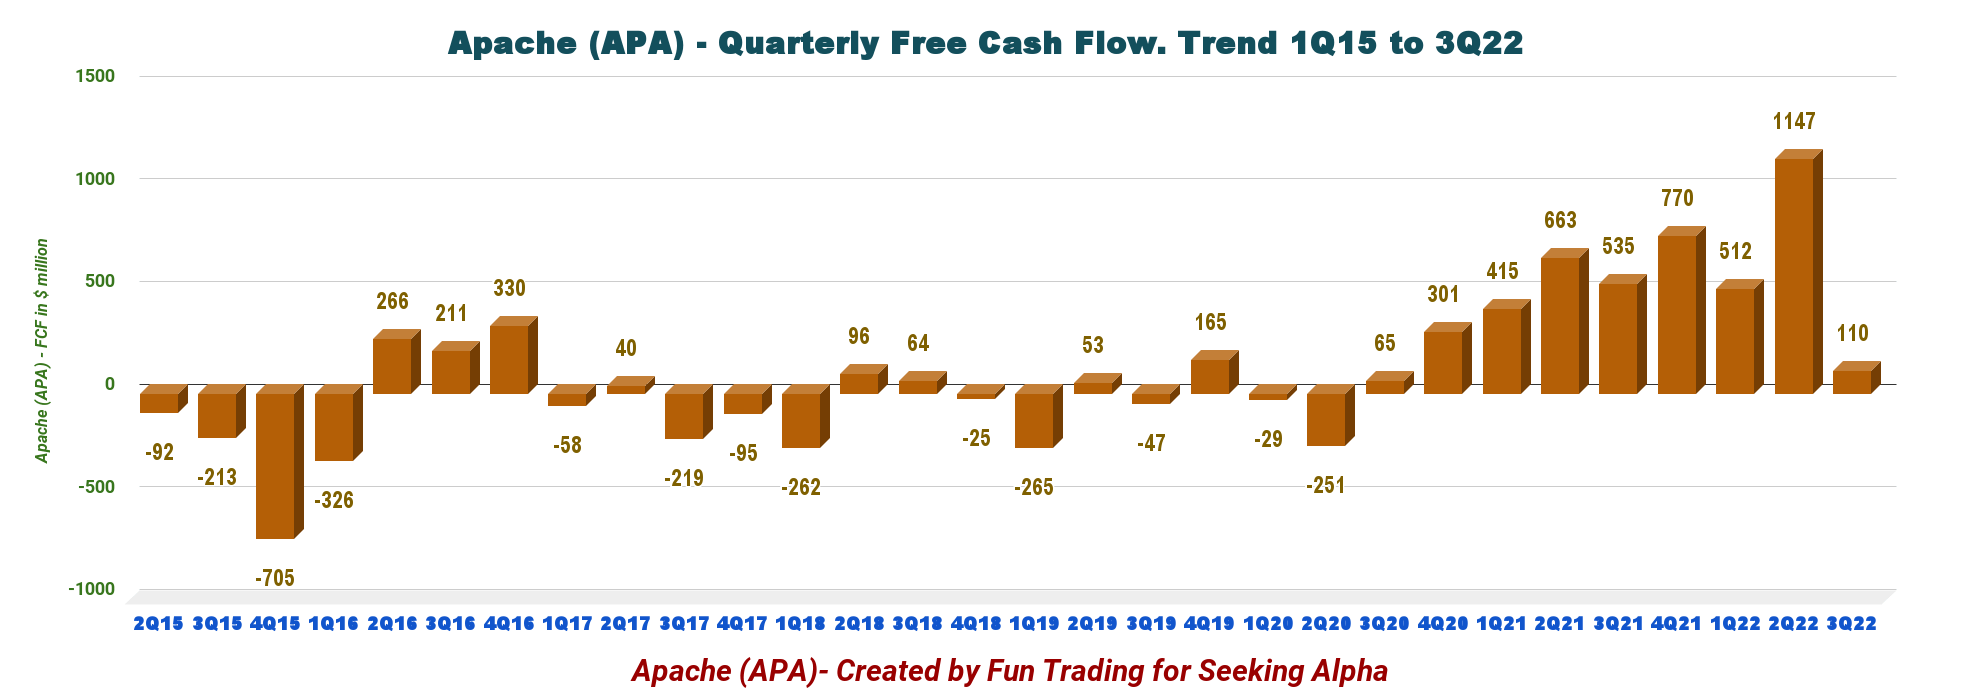
Trailing 12-month free cash flow is now $2,537 million, with a free cash flow of $110 million for the third quarter.
APA repurchased 10 million shares of common stock during the quarter at an average price of $33.85 per share. The company said:
Since the inception of APA’s capital return framework in October 2021, the company has repurchased 55.2 million shares at an average price of $31.33 through the end of the third quarter.
Details are indicated below:
APA Dividend and Buyback history (APA Presentation)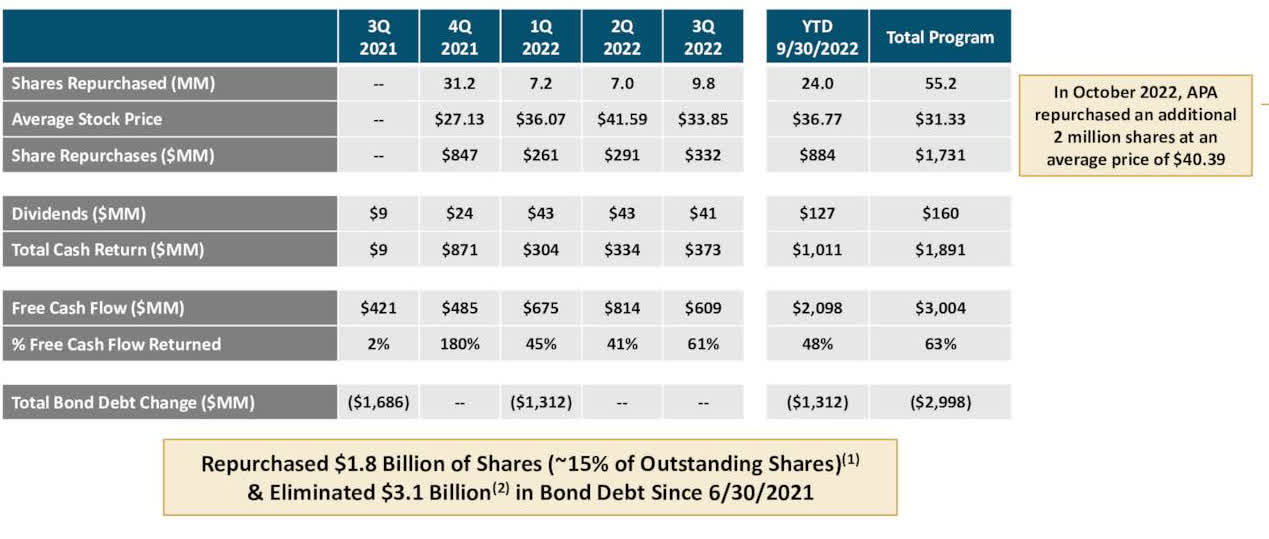
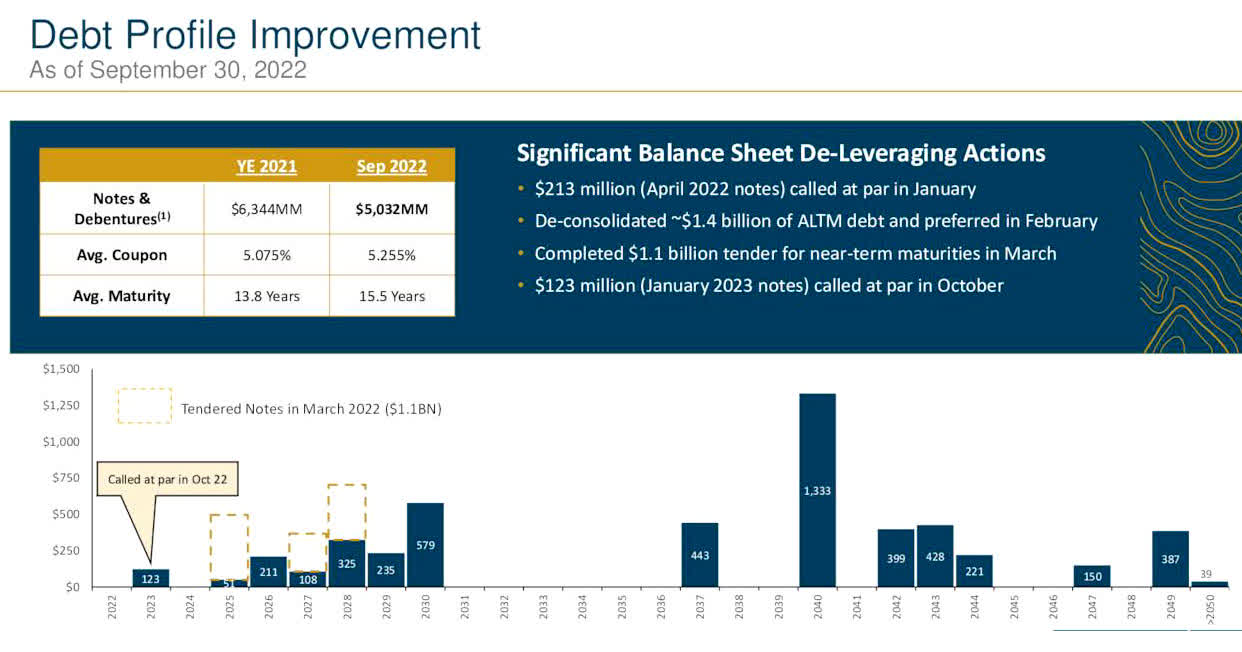
3 – Net debt dropped significantly to $5.26 billion in 3Q22
APA Quarterly Cash versus Debt history (Fun Trading) APA was deleveraging its debt profile and continues to do an excellent job in the third quarter of 2022, even if we see a slight increase sequentially. The net debt is now $5.26 billion, up from $5 billion in 2Q22. Since mid-2021, $3.1 billion in bond debt has been eliminated, including the recent redemption of $123 million of notes due January 2023, through tender offers, open market repurchases and early redemptions (press release). APA Debt Profile (APA Presentation)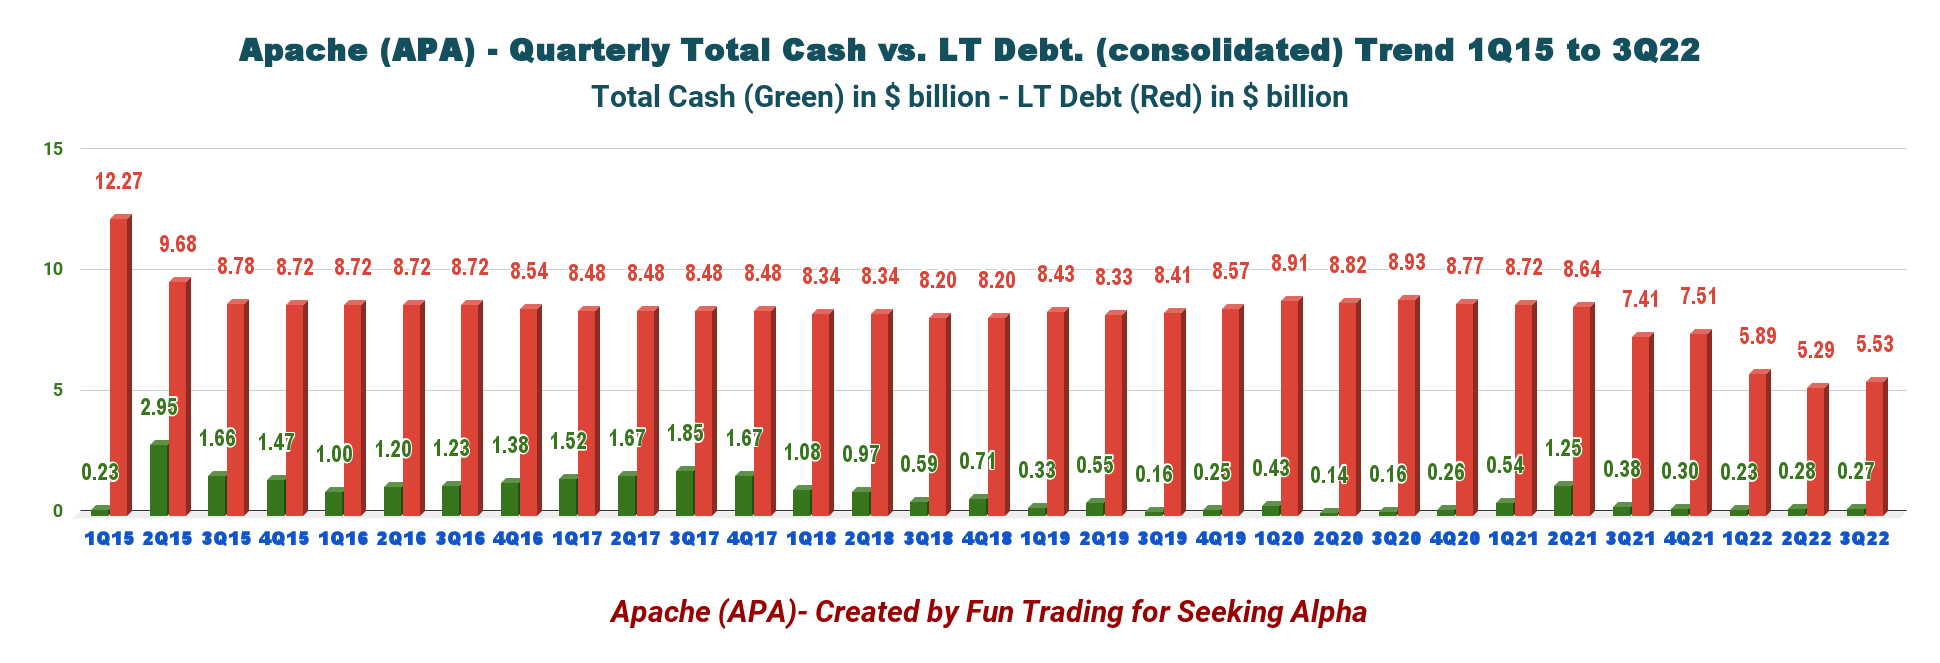
4 – Oil-equivalent production was 381,934 Boep/d in 3Q22 which comprises 64% liquids (oil + NGL).
4.1 – Production Details
APA Quarterly production detail history (Fun Trading) APA North Sea update 3Q22 (APA Presentation)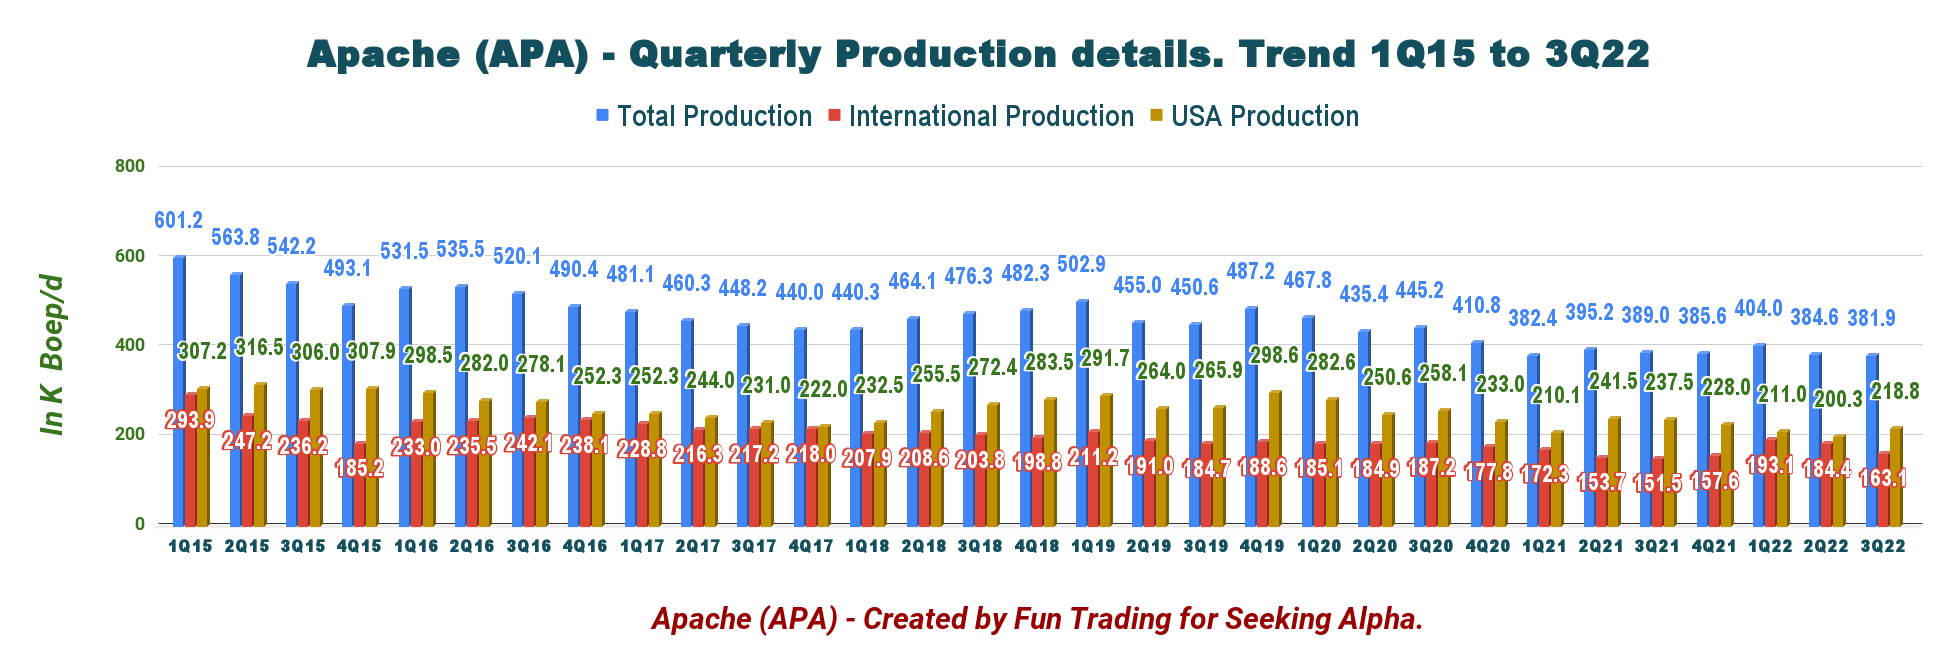
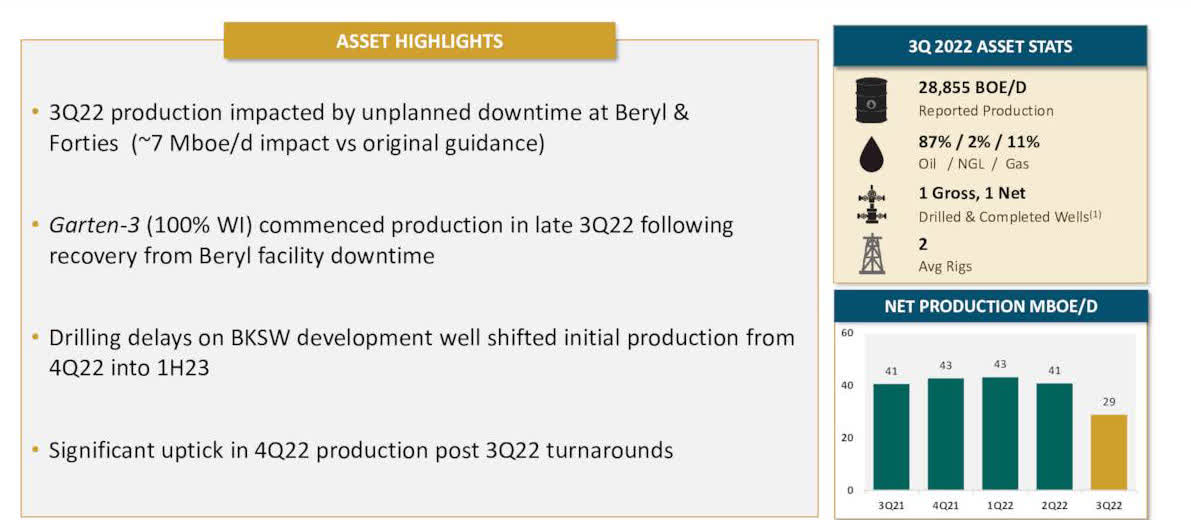
After returning to production from seasonal turnarounds, the North Sea incurred an unusually high amount of unplanned downtime in August. Most of these issues have been mitigated, and volumes have become more normalized.
APA Quarterly Oil equivalent Production history (Fun Trading)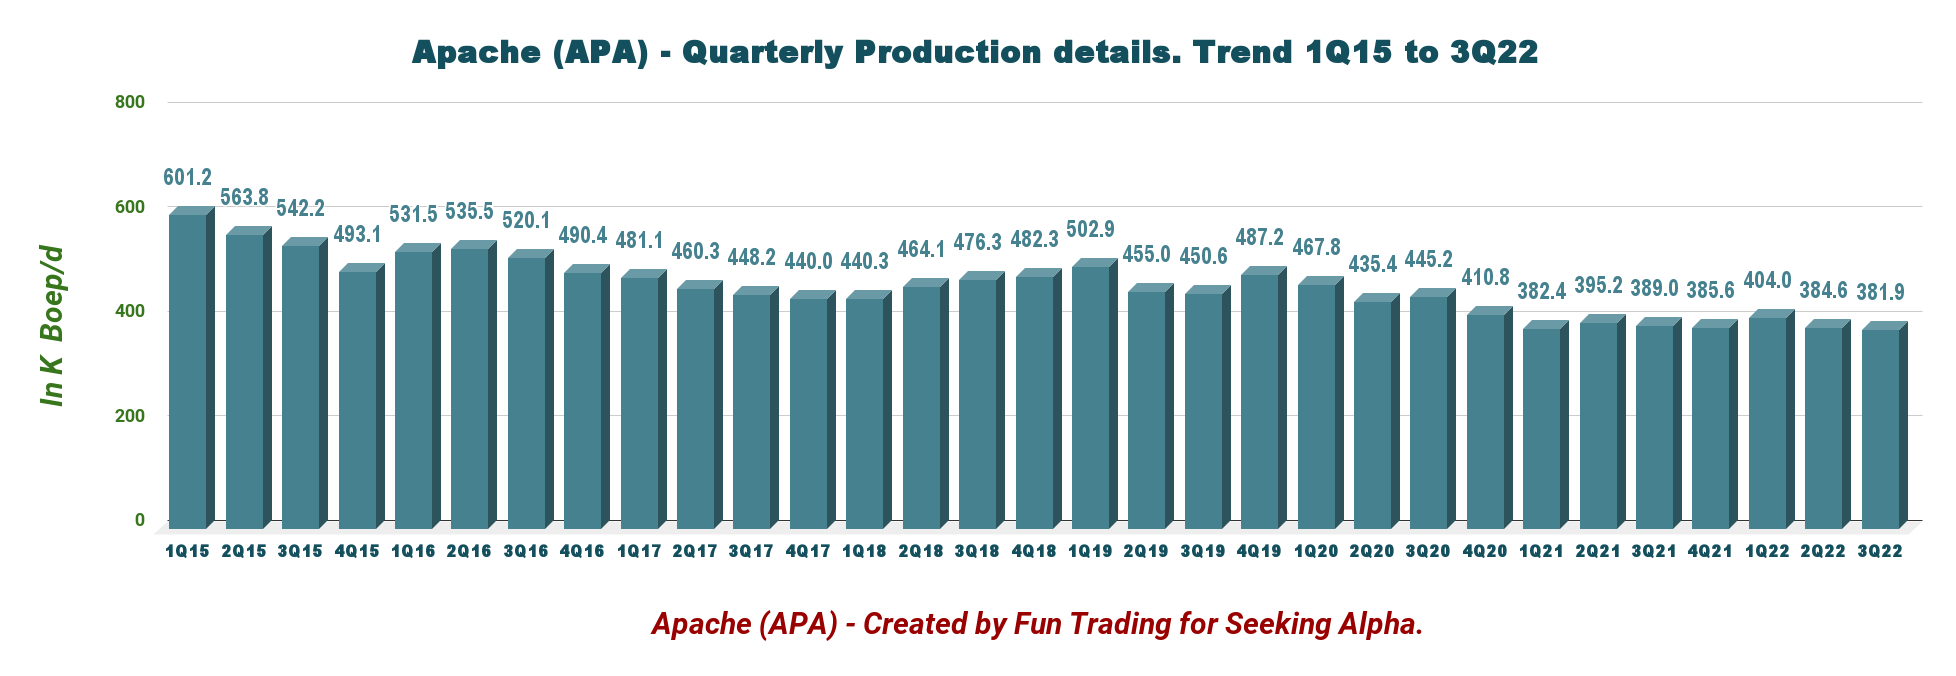
Production in the USA is the most important for the company, with 218,826 Boep/d in 3Q22, or 57.3% of the total output.
APA Quarterly Production details 3Q22 (Fun Trading)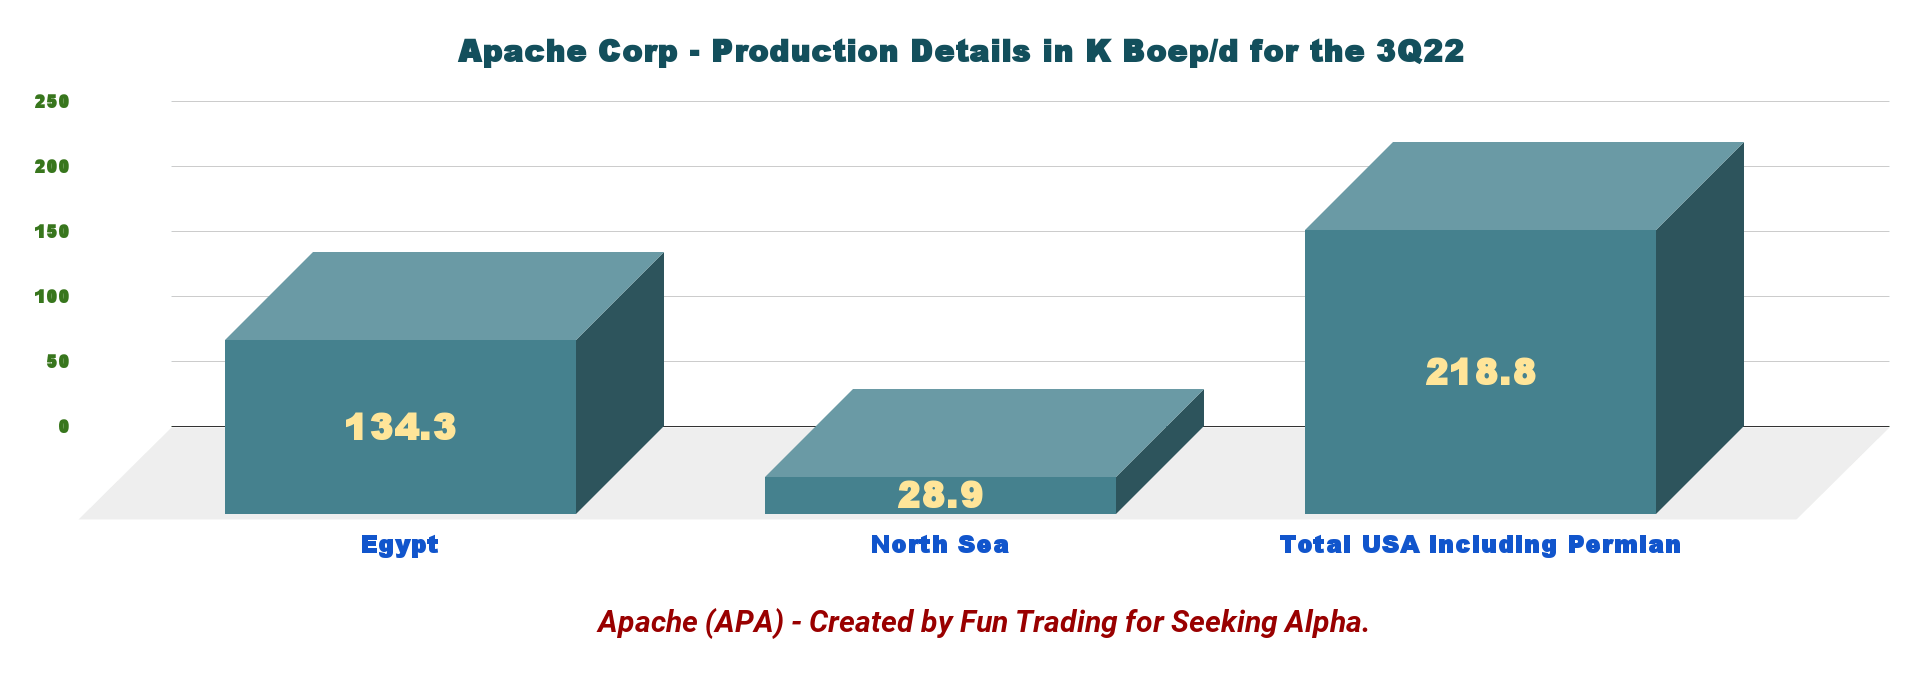
4.2 – Block 58 in Suriname 3Q22 update – Five exploration discoveries since 2020. Block 53 first discovery.
Block 58 and now block 53 are great potential long-term assets and could be a game changers for the company.
CEO John Christmann said in the conference call:
In Suriname, we advanced our exploration and appraisal program with the first oil discovery on Block 53 at Baja and a successful flow test of the CrabDagu discovery well in Block 58.
APA Suriname update 3Q22 (APA Presentation)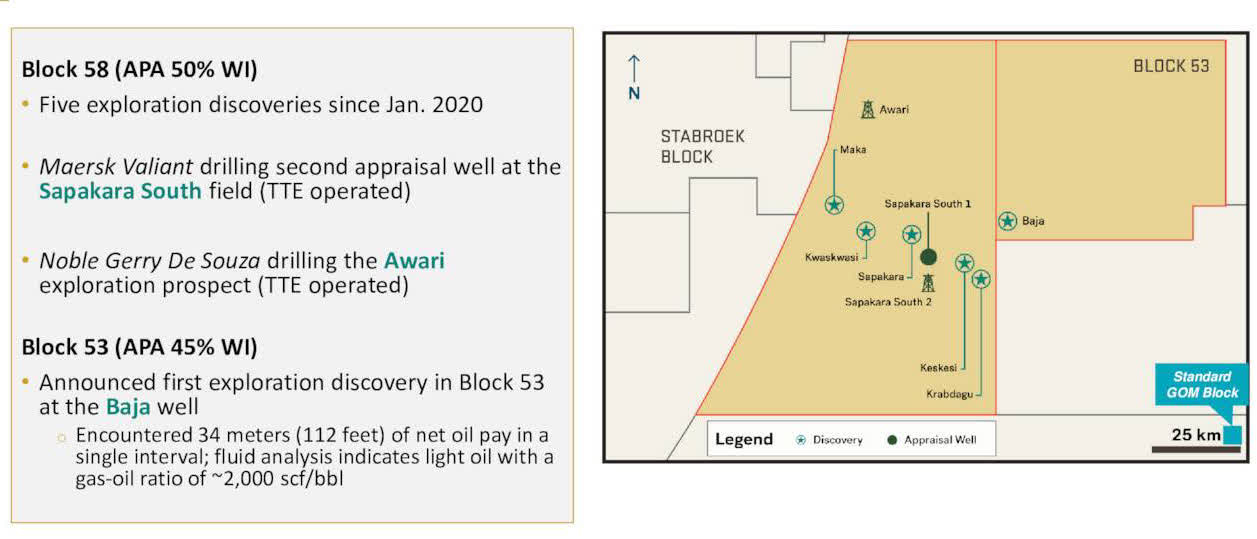
Note: in December 2019, APA (then known as Apache) and TotalEnergies (TTE) formed a joint venture to develop the project off Suriname. Under the Suriname deal, Apache and Total held 50% working interest in Block 58. Also, APA Suriname is the operator of Block 53 (45%) with PETRONAS Carigali Sdn Bhd (30%) and Cepsa (25%).
5 – 2022 Guidance
CapEx is projected to be around $450 million in Q4 2022, and our full-year guidance of $1.725 billion remains unchanged. Total production for 4Q22 will be between 405K and 409K Boep/d.
As said during the third quarter earnings call, APA expects adjusted production will increase by around 5% from the third quarter, driven primarily by an increase in new well-connections and re-completion activity in Egypt and a rebound from planned and unplanned platform maintenance downtime in the North Sea:
In Suriname on Block 58, we are currently participating in drilling 2 wells, a second appraisal well at Sapakara South, and an exploration well at Aware.
APA 4Q22 and full-year Guidance (APA Presentation)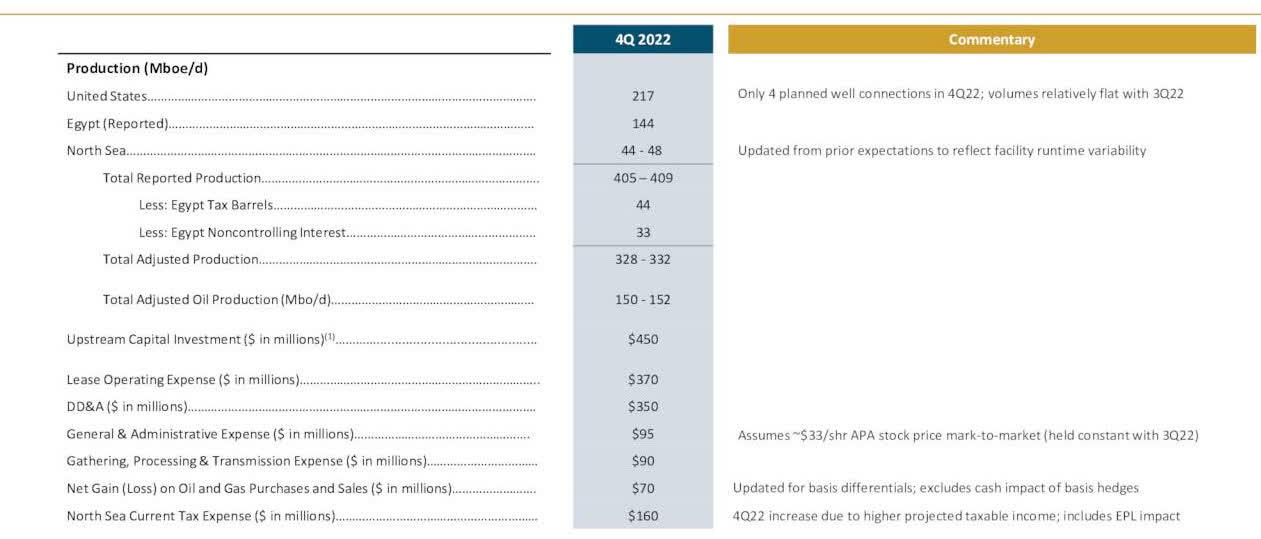
Commentary and Technical Analysis
APA TA Chart short-term (Fun Trading StockCharts)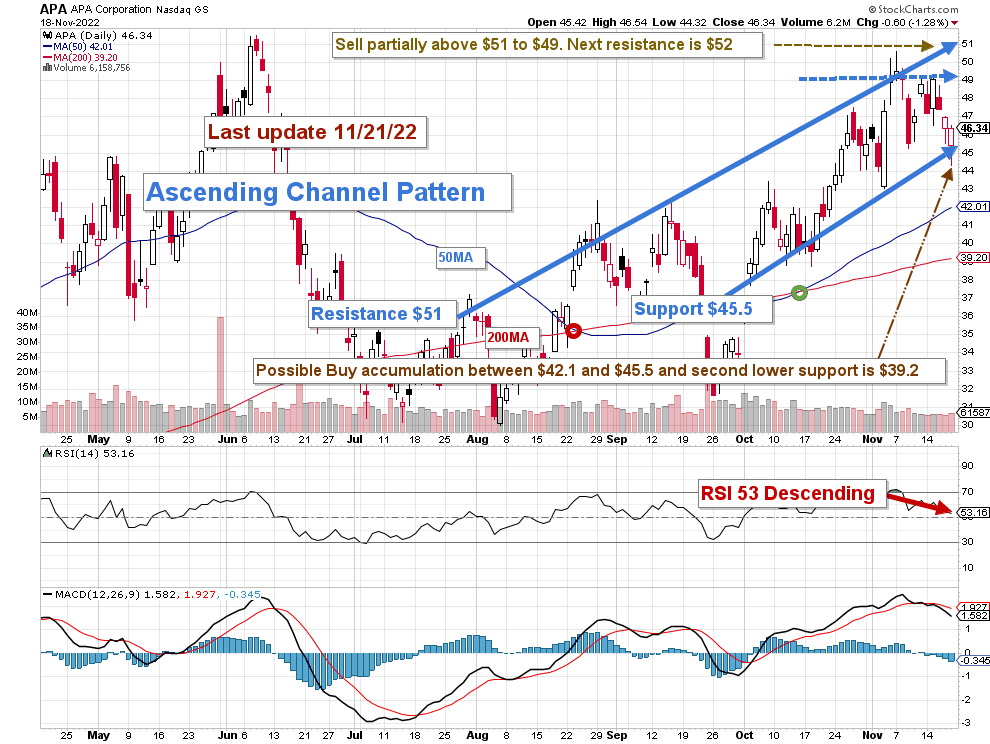
Note: The chart has been adjusted for the dividend.
APA forms an ascending channel pattern with resistance at $51 and support at $45.5. Ascending channel patterns are short-term bullish moving higher within an ascending channel, but these patterns often form within longer-term downtrends as continuation patterns.
The short-term strategy is regularly trading LIFO at about 30%-35% of your position. I suggest selling between $52 and $49 and waiting for a retracement between $42.1 and $45.5 with possible lower support at $39.2 if oil turns even more bearish.
However, this simple strategy will have to be adjusted depending on the situation in Ukraine and the growing risk of stagflation which could significantly hurt the oil stocks that have been overheating again recently.
Watch oil prices like a hawk.
Note: The LIFO method is prohibited under International Financial Reporting Standards (IFRS), though it is permitted in the United States by Generally Accepted Accounting Principles (GAAP). Therefore, only U.S. traders can apply this method. Those who cannot trade LIFO can use an alternative by setting two different accounts for the same stock, one for the long-term and one for short-term trading.
Warning: The TA chart must be updated frequently to be relevant. It is what I am doing in my stock tracker. The chart above has a possible validity of about a week. Remember, the TA chart is a tool only to help you adopt the right strategy. It is not a way to foresee the future. No one and nothing can.
Author’s note: If you find value in this article and would like to encourage such continued efforts, please click the “Like” button below to vote for support. Thanks.
Be the first to comment