

makaule/iStock via Getty Images
The Global Financial Crisis, and the subsequent changes in the regulatory and operational environment has meant that ever since it has been challenging for banks to incrementally generate profits while being shackled by burdensome safeguards. This has resulted in seemingly meagre returns for shareholders, who may feel that the risk-reward proposition for banks is skewed to the downside, and perhaps outrightly unrewarding. We have built a valuation model that attempts to illustrate the risk-reward profile of modern-day banks, and have applied it to ANZ (OTCPK:ANZBY).
We look to demonstrate that ANZ shareholders are not at significant risk in the instance of another crisis-like scenario, but also can expect limited upside in terms of capital appreciation. We suggest that the stock price will accrete at the same rate as long-term inflation (conveniently assumed as 3.5%), whilst continuing to pay out 6.5% dividend yields most years.
Our Banking Valuation Model
Before we commence, we would like to take readers through the metrics and filters we use to establish valuation for banks.
Price-to-Book Value: Although not a metric we often reference for other industry stocks, we think the valuation of a bank should be loosely anchored to a price-to-book value of 1, as we would expect their balance sheets to be predominately made up of financial instruments carried at fair value. A bank with inconsistent returns or operational inefficiencies (e.g. Credit Suisse (NYSE:CS)) may warrant a lower P/B ratio; and a bank with stronger standing in its competitive environment (e.g. DBS (OTCPK:DBSDY)) may use this to justify a higher value. However, we wouldn’t expect persistent deviation (especially higher) away from a P/B of 1 over the long run.
Return on Equity: We observe that most banks target and have been able to consistently achieve (in recent times at least) a Return on Equity (RoE) of 10%. Combined with the above assertion of 1 as a fair P/B ratio, this translates to a generalisation that a P/E ratio of 10x is fair value.
Risk Weighted Assets: Banks cannot conceivably exceed 10% RoE because to do so would mean they are taking on more risk. The calculation methodology for Risk Weighted Assets (RWA) takes into account the types of risks that banks encounter: credit (counterparty) risk, market risk (e.g. interest rate risk), and operational risk. A bank looking to increase growth might look to utilise more leverage, lend to less credit-worthy clients, or take significant exposure in the markets in anticipation of favourable price movements. Doing so incurs a higher RWAs under capital regulations, which will manifest in a lower CET1 ratio.
CET1 Ratio: Formulaically, CET1 is the amount of (tier 1) capital in a bank as a percentage of Risk Weighted Assets. The higher the value the safer the institution is perceived to be, and below a certain level (approximately 10%) a bank could be considered undercapitalised and be forced by regulators to raise additional capital.
Our rules of thumb on bank valuations revolve around the above metrics:
- A healthy bank should have a CET1 ratio significantly higher than the regulatory minimum (at least 13%)
- A healthy bank should have strong track record of >10% RoE
- P/E ratio of 10x is fair value for a healthy bank
- Price-to-book of 1 is fair value for a healthy bank
In terms of risk-reward, we think this means banks have an upper bound as to how much growth they can achieve given the capital restraints imposed on them. On the other hand, there is a longer earnings tail risk. These could come about through lower volumes during economic downturns, increased impairments on bad loans, adverse impacts from market dislocations, or even operational errors and poor conduct. The fatness of the tail also depends on the type of banking businesses, operating jurisdictions, as well as its reputation for sound risk management.
To borrow from statistics, we view the risk-reward profile of bank earnings as a non-normal distribution with negative skew.
We visualise a negative skew on the risk-reward profile of bank earnings, with limited scope for upside surprise, and significant left-tail risks (Woodforde Investments)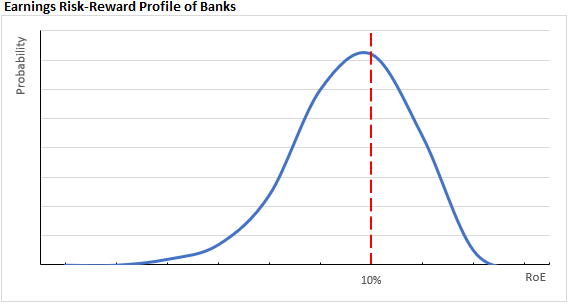
In determining an investment case for a bank stock, we look to map out the risk-reward profile 10 years out. We then establish where the current stock price sits to determine relative value.
Traditionally, the value-investment approach is to predict the future earnings potential of a company and assess if it is undervalued. We think for banks we need to additionally account for earnings risk and then factor in an adequate margin-of-safety, particularly from the risk of six-sigma events that could lead to significant losses, additional capital raising and dilution of shareholder value.
Our model requires us to forecast the risk-reward profile 10 years out, and overlay with the current stock price. Naturally we like to see downside risks further right, and stock prices cheap relative to fair value. (Woodforde Investments)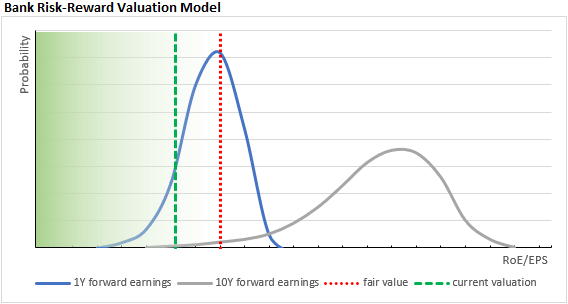
The Company
ANZ is an Australasian bank operating predominately in Australia and New Zealand, but also maintains a smaller international business franchise mostly serving Asian institutional customers. Its business composition is weighted towards residential mortgages and corporate lending and reflects on its RWA composition, whereby credit risk accounts for 80%. Its CET1 ratio under international computation standards is 18.0%, which implies a healthy capital position and at the high end within the industry. Likely, ANZ’s healthy balance sheet has also earnt it strong credit ratings, which comes with the benefit of relatively cheaper funding rates, and potential for higher net interest margin.
ANZ’s RWAs (left) are predominately driven by credit risk exposure (shades of blue). Its CET1 ratio (right) of 18% reflects a healthy balance sheet relative to many of its global peers. (ANZ financial results presentation)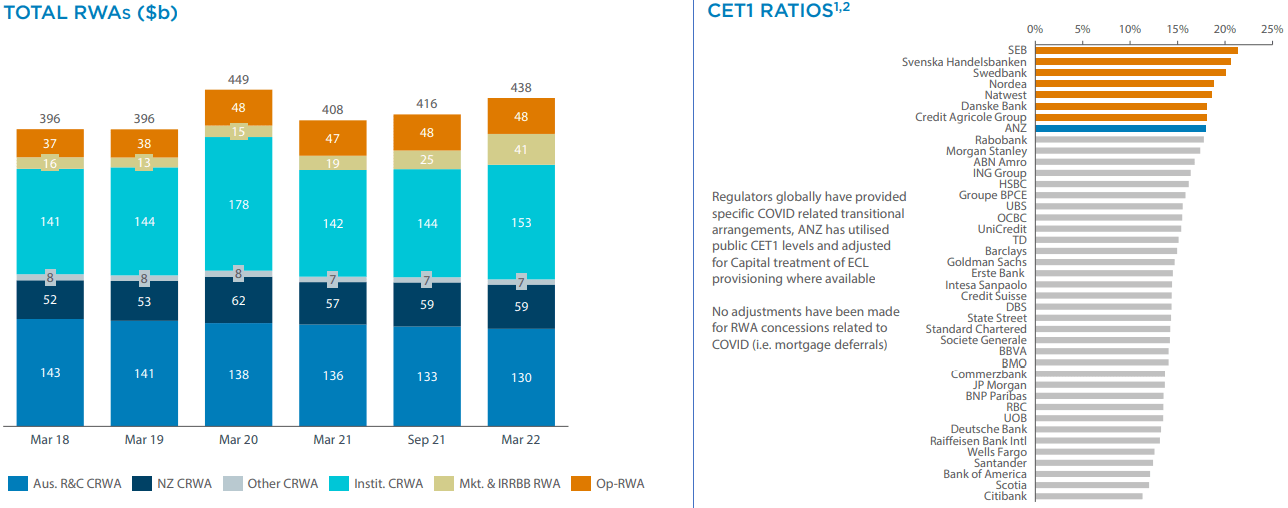
Its 2022 half-year earnings of A$3,530m equates to an annualised RoE of 11.4%. Looking back through recent history, the bank has broadly achieved consistent returns around 10%, with 2020 an exception although only because of the credit provisions it took during the pandemic recession.
In recent times ANZ has mostly consistently reached 10% RoE. The outlier being 2020, although the bank took impairment charges of A$2.7bn during that year. (collated from financial reports)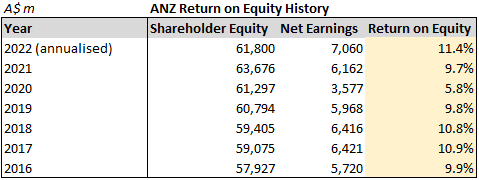
Future Outlook
In modelling 10 years out, due to its strong capitalisation, concentration in less volatile banking businesses, and steady earnings record, coupled with likely continued growth of Australia and New Zealand‘s economies, we don’t foresee as large a tail risk as feared. Our worse-case scenarios centre around a recessionary environment similar to 2020, which although result in lower earnings do not come close to raising concerns about excessive losses and undercapitalisation.
The flipside is that we also think outsized earnings growth expansion as unlikely despite a track record of 10% RoE. This is predominately due to its current policy to return around 65% of earnings via dividends (as well as a buy-back program we deem immaterial), meaning the capital base only increases incrementally by 3.5% every year.
We think that moving towards a higher interest rate environment, ANZ’s net interest margin can expand and contribute to RoE expansion, however this often comes with increased writedowns which would offset some of these anticipated earnings increase. Ultimately this boils down to the quality of the loan book, although for now we take a neutral stance and assume no change in RoE even as interest rates go up.
Our conclusion is that ANZ sustains 10% RoE on a capital base that expands at 3.5% annually, and continues dividend payouts yielding 6.5% for most years. History does suggest though that a recession is probable to occur within the next ten years, and were it to be severe we may see one or two reporting periods with lower profits, and consequently lower dividend payouts.
Valuation
With a hypothetical stock price around A$22 reflecting P/B of 1, we see that the stock has traded just above this level for the last 12 months. Its P/E ratio of 10x merely reflects a bank with 10% RoE trading close to book value, which we have established to be fair value.
Our valuation model suggests that in the event of another severe economic crisis, ANZ’s earnings will remain resilient. However, even in good times we project only modest EPS potential (c.A$4 by 2032), due to the limited incremental capital base growth of the bank. We think the stock price will appreciate at an equivalent trajectory to around A$40 over 10 years, a rate of increase we suggest would merely keep pace with long-term inflation. The upside is that we calculate A$20 per share will be received as cash dividends over this time period. Total returns of 2.5x on initial investment could be achieved should an existing investor choose to reinvest the dividends instead.
We view ANZ’s current stock price as close to fair value, and forecast price appreciation to around A$40 (EPS A$4 x P/E 10x) in ten years (Woodforde Investments)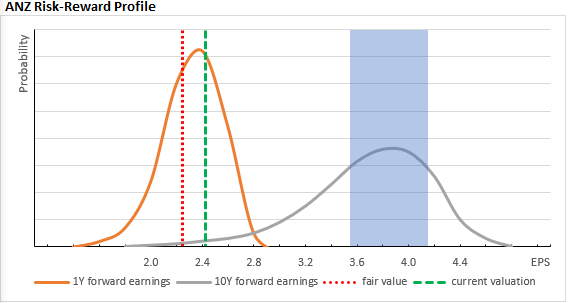
Bonds Comparison
Specific to bank stocks, we think it is valuable to also compare it to bond issuances from the same entity, as relative to common shares they inherently offer more principal protection. With the advent of hybrid capital instruments that now contribute to a bank’s capital base, there are a plethora of options for differing risk appetites when factoring in seniority, currency, and duration. To cherry-pick one, we currently see yields on USD-denominated Tier 2 note maturing 2026 at 6.2%, which is not much lower than dividend yields on the stock.
We should note that different currency instruments use different risk-free rates in traditional valuation methodologies, and for an international investor factoring in the cost of funding in their base currency equivalent may yield wildly disparate results. However, if we assume the relative principal protection and guaranteed coupons of bonds as a fair trade-off for the capital appreciation potential but less certain dividend yield on stocks, we think it is prudent for an investor to weigh up the merits of both fixed income and equity options when it comes to banks.
Conclusion
With a robust CET1 ratio of 18%, consistent track record of 10% RoE, a P/E ratio around 10x and price-to-book just above 1, we view ANZ as a healthy bank trading at fair value.
We think the stock would be perform dependably in an equity investment portfolio, with continued dividends yielding 6.5% probable assuming normal economic conditions. However, we predict that unless the bank can boost RoE without materially weakening its CET1 ratio ANZ’s growth potential is capped, the stock price will meander towards A$40 over the next 10 years. A patient investor could see a 2.5x gain on their investment over this time period though should they elect to reinvest dividends.
It is also not out of the question that a recession resulting in sub-par earnings and dividend payouts for 1-2 years may occur in the next decade, and to mitigate some of this downside risk we would be inclined to contemplate ANZ-issued fixed-income offerings as comparable investments on a risk-adjusted basis.
(Reported $ amounts reference AUD as it is the reporting currency of ANZ. AUDUSD = 0.63 assumed in analysis)
Be the first to comment