

Rajesh Pandit/iStock via Getty Images
Focus of Article:
The focus of this two-part article is to provide a very detailed analysis comparing Annaly Capital Management Inc. (NYSE:NLY) to all the mortgage real estate investment trust (mREIT) peers I currently cover. I am writing this two-part article due to the continued requests that such an analysis be specifically performed on NLY and some of the company’s mREIT peers at periodic intervals. For readers who just want the summarized conclusions/results, I would suggest to scroll down to the “Conclusions Drawn” section at the bottom of each part of the article.
PART 1 of this article analyzed NLY’s recent results and compared several of the company’s metrics to 19 mREIT peers. PART 1 also showed how NLY’s book value (“BV”) as of 12/31/2021 compared to the 19 other mREIT peers. PART 1 helps lead to a better understanding of the topics and analysis that will be discussed in PART 2. The link to PART 1’s analysis is provided below:
REIT Forum Version (Expanded Analytics):
Public Version:
Annaly Capital’s BV, Dividend, And Valuation Vs. 19 mREIT Peers – Part 1 (Post Q4 2021 Earnings)
The focus of PART 2 of this article is to compare NLY’s recent dividend per share rates, yield percentages, and several dividend sustainability metrics to 19 mREIT peers. This analysis will show recent past data with supporting documentation within Table 4 below. This article will also discuss NLY’s dividend sustainability which is partially based on the metrics outlined in Table 4. A more in-depth analysis of NLY’s dividend sustainability will be provided in Table 5 below. This includes a discussion of NLY’s dividend decrease of ($0.05) and ($0.03) per common share which occurred during the second quarter of 2019 and 2020, respectively.
By analyzing these metrics, one will better understand which mREIT generally has a safer dividend rate going forward versus other peers who generally have a higher risk for a dividend decrease or a higher probability of a dividend increase and/or a special periodic dividend being declared. When both back testing and projecting the metrics within this analysis, the results have continued to be proven reliable. This is not the only data that should be examined to initiate a position within a particular stock/sector. However, I believe this analysis would be a good “starting-point” to begin a discussion on the topic.
At the end of this article, there will be a conclusion regarding the following comparisons between NLY and the 19 mREIT peers: 1) trailing 12-month (“TTM”) yields based on a stock price as of 3/29/2022 (including 1- and 3-year dividend change); 2) annual forward yield based on a stock price as of 3/29/2022; and 3) annual forward yield based on my estimated CURRENT BV (BV as of 3/25/2022). I will also provide my current BUY, SELL, or HOLD recommendation, dividend per share rate projection for the second-third quarters of 2022, and price target on NLY.
Side Note: I believe there are several different classifications when it comes to mREIT companies. For purposes of this article, I am focusing on 4. For readers who are new to my articles or for existing readers who need a “refresher” on several different mREIT classifications, please see PART 1 of this article (link provided above).
Dividend Per Share Rates and Yield Percentages Analysis – Overview:
Let us start this analysis by getting accustomed to the information provided in Table 4 below. This will be beneficial when comparing NLY to the 19 mREIT peers within this analysis.
Table 4 – Dividend Per Share Rates and Yield Percentages
The REIT Forum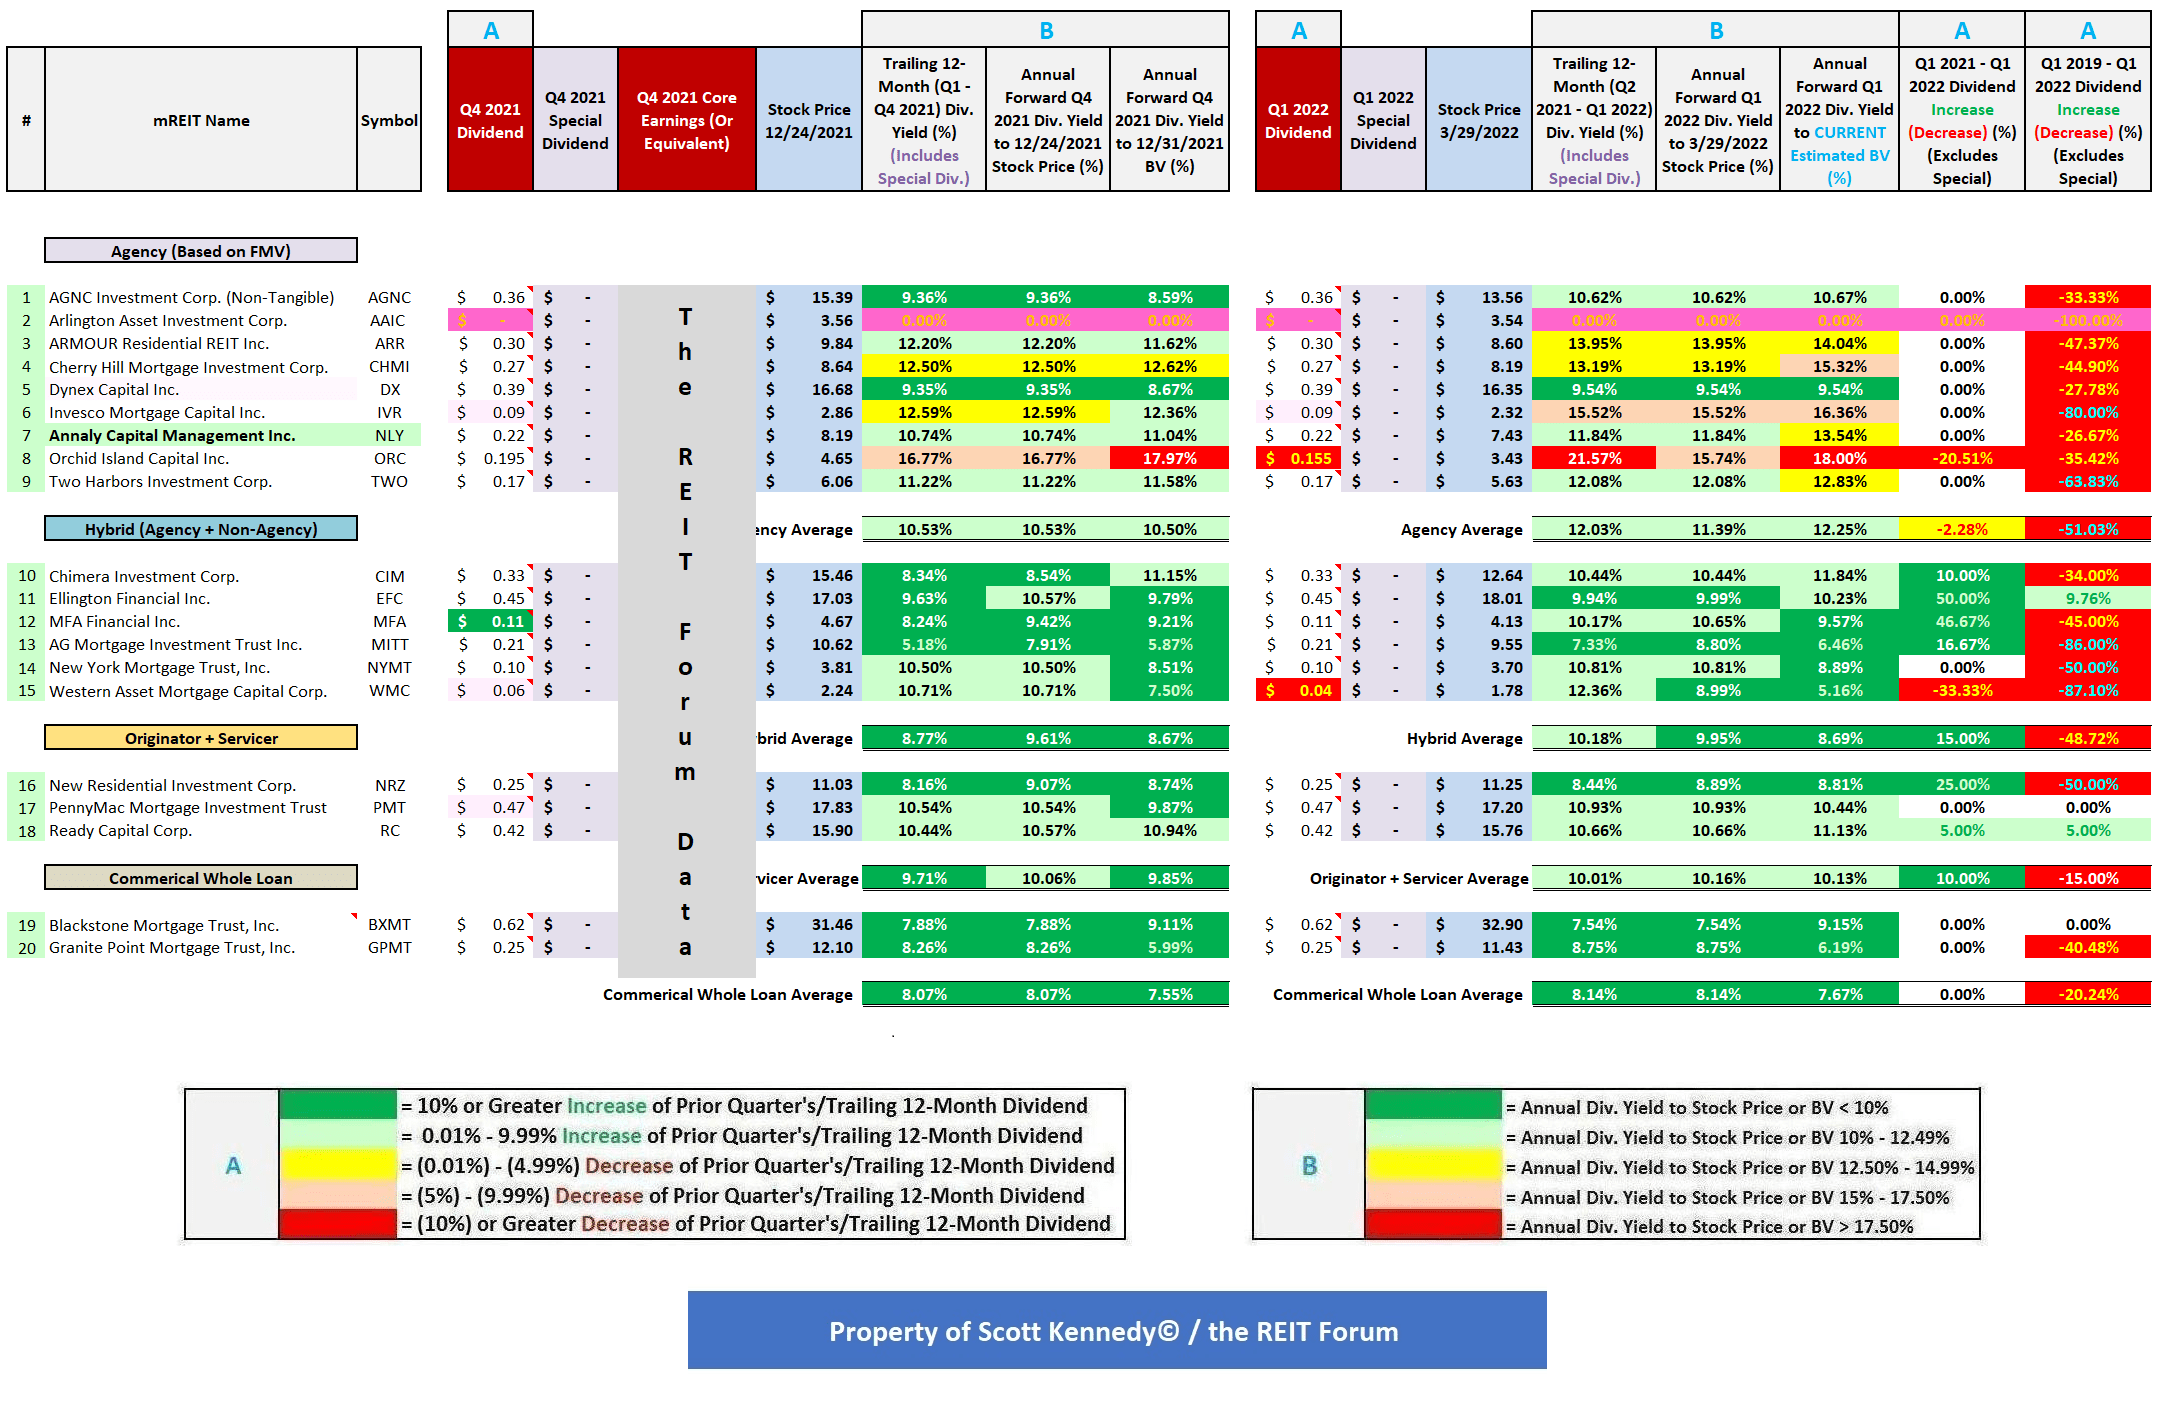
(Source: Table created by me, obtaining historical stock prices from NASDAQ and each company’s dividend per share rates from the SEC’s EDGAR Database)
Using Table 4 above as a reference, the following information is provided (see each corresponding column): 1) dividend per share rate for the fourth quarter of 2021 (for monthly dividend payers, the total monthly dividends during the quarter); 2) core earnings (or core earnings equivalent) for the fourth quarter of 2021; 3) stock price as of 12/24/2021; 4) TTM dividend yield (dividend per share rate from the first-fourth quarter of 2021); 5) annual forward dividend yield based on the dividend per share rate for the fourth quarter of 2021 using the stock price as of 12/24/2021 (for monthly dividend payers, the latest monthly dividend per share rate during the quarter); 6) annual forward dividend yield based on the dividend per share rate for the fourth quarter of 2021 using a BV as of 12/31/2021 (for monthly dividend payers, the latest monthly dividend per share rate during the quarter); 7) dividend per share rate for the first quarter of 2022 (for monthly dividend payers, the total monthly dividends during the quarter); 8) stock price as of 3/29/2022; 9) TTM dividend yield (dividend per share rate from the second quarter of 2021-first quarter of 2022); 10) annual forward dividend yield based on the dividend per share rate for the first quarter of 2022 using the stock price as of 3/29/2022 (for monthly dividend payers, the latest monthly dividend per share rate during the quarter); 11) annual forward dividend yield based on the dividend per share rate for the first quarter of 2022 using estimated CURRENT BV (BV as of 3/25/2022) (for monthly dividend payers, the latest monthly dividend per share rate during the quarter); 12) dividend per share rate for the first quarter of 2022 versus the first quarter of 2021 (percentage fluctuation); and 13) dividend per share rate for the first quarter of 2022 versus the first quarter of 2019 (percentage fluctuation; shows COVID-19 impact to dividend).
As of 3/29/2022, ARMOUR Residential REIT Inc. (ARR), Dynex Capital Inc. (DX), MFA Financial Inc. (MFA), and New York Mortgage Trust, Inc. (NYMT) had a stock price that “reset” lower regarding each company’s monthly/quarterly dividend accrual. In other words, each company’s “ex-dividend date” for March 2022/the first quarter of 2022 had already occurred.
As of 3/29/2022, NLY, AGNC Investment Corp. (AGNC), Cherry Hill Mortgage Investment Corp. (CHMI), Invesco Mortgage Capital Inc. (IVR), Orchid Island Capital Inc. (ORC), Two Harbors Investment Corp. (TWO), Chimera Investment Corp. (CIM), Ellington Financial Inc. (EFC), AG Mortgage Investment Trust Inc. (MITT), Western Asset Mortgage Capital Corp. (WMC), New Residential Investment Corp. (NRZ), PennyMac Mortgage Investment Trust (PMT), Ready Capital Corp. (RC), Blackstone Mortgage Trust, Inc. (BXMT), and Granite Point Mortgage Trust, Inc. (GPMT) had a stock price that had not reset lower in reference to the company’s March 2022/the first quarter of 2022 dividend accrual. Arlington Asset Investment Corp. (AAIC) has not declared (and very likely will not declare) a common stock dividend for the first quarter of 2022.
Readers should take these points into consideration as the analysis is presented below. Let us now begin the comparative analysis between NLY and the 19 mREIT peers.
Analysis of NLY:
Using Table 4 above as a reference, NLY declared a dividend of $0.22 per common share for the fourth quarter of 2021. This was an unchanged per common share dividend when compared to the prior quarter. It should also be noted previously, after 22 consecutive quarters of a stable quarterly per share rate, NLY decreased the company’s common stock dividend by ($0.05) per share during the second quarter of 2019. Due to the fact NLY aggressively reduced the company’s dividend from $0.65 per share during the fourth quarter of 2011 to $0.30 per share by the fourth quarter of 2013, the company was also able to maintain its quarterly dividend per share rate over a longer time period when compared to most sector peers (especially its fixed-rate agency mREIT sub-sector peers). Mainly due to a flattening yield curve that began back in 2018, along with the continued less “specialness” when it came to dollar-roll (off-balance sheet) financing, there was mounting pressure for NLY to reduce the company’s dividend per share rate as 2019 progressed as short-term interest rates rose to 2.50%-2.75%.
NLY’s ($0.03) per common share dividend decrease for the second quarter of 2020 was mainly the result of the lower size of NLY’s investment portfolio coming out of the initial COVID-19 “pandemic panic” during March 2020. During this timeframe, prior to the Federal (“Fed”) Reserve’s quick, decisive action to calm markets through both interest rate and monetary policy, repurchase (“repo”) agreement and hedging counterparties quickly (and incorrectly in my opinion) initiated margins calls on most sector peers which created a “snowball” effect on this specific market. This included both agency and non-agency mortgage-related investments. In other words, there was a quick, sharp leverage/liquidity crisis across certain pockets of credit markets where certain assets/investments are used as collateral to underlying outstanding borrowings/debt. Most sector peers either voluntarily, or were forced, to deleverage and raise cash during this time period. Results varied greatly from peer-to-peer regarding the severity of each company’s investment portfolio reduction. NLY was one of the sector peers who actually came out of the COVID-19 pandemic panic not too much “worse for wear”. Some agency, most hybrid, some originator + servicer, and some commercial whole loan mREIT peers could not make the same claim.
NLY’s stock price traded at $8.19 per share on 12/24/2021. When calculated, this was a TTM dividend yield of 10.74%, an annual forward yield to NLY’s stock price as of 12/24/2021 of 10.74%, and an annual forward yield to the company’s BV as of 12/31/2021 of 11.04%. When comparing each yield percentage to NLY’s agency mREIT peers within this analysis, the company’s TTM dividend yield percentage and annual forward yield percentage based on its stock price was near (less than 0.50%) average while its annual forward yield percentage based on its BV as of 12/31/2021 was slightly (at or more than 0.50% but less than 1.00%) above average. That said, I would also point out AAIC’s 0% yield metrics “skewed” the agency sub-sector mREIT yield averages down a bit.
As was discussed in PART 1 of this article, as of 12/31/2021 NLY had the 4th lowest at-risk leverage ratio (on- and off-balance sheet) when compared to the 8 other agency mREIT sub-sector peers within this analysis. NLY typically runs lower leverage versus most of its fixed-rate agency mREIT peers. From charting past trends, typically lower leverage ratios within the fixed-rate agency mREIT sector generally equate to below average-average dividend yield percentages. Of course, there are various other factors at play regarding dividend sustainability (especially in light of the events surrounding the COVID-19 pandemic panic back in March 2020). However, a company’s leverage ratio is one “general” metric which I believe should be analyzed.
I continue to believe three important metrics to analyze when assessing NLY’s near-term dividend sustainability are the company’s quarterly estimated REIT taxable income (“ERTI”), estimated core earnings (“ECE”), and its normalized core earnings (“NCE”). NLY’s earnings available for distribution (“EAD”) is now the equivalent to the company’s previously disclosed NCE. As such, the terms are interchangeable within the NCE analysis within this article. Currently, NLY’s NCE (or EAD) is the closest metric to the company’s “true earnings power” regarding its investment portfolio’s performance. To analyze/explain these three metrics, Table 5 is provided below.
Table 5 – NLY Quarterly ERTI, ECE, and NCE/EAD Analysis (Q1 2019 – Q4 2021)
The REIT Forum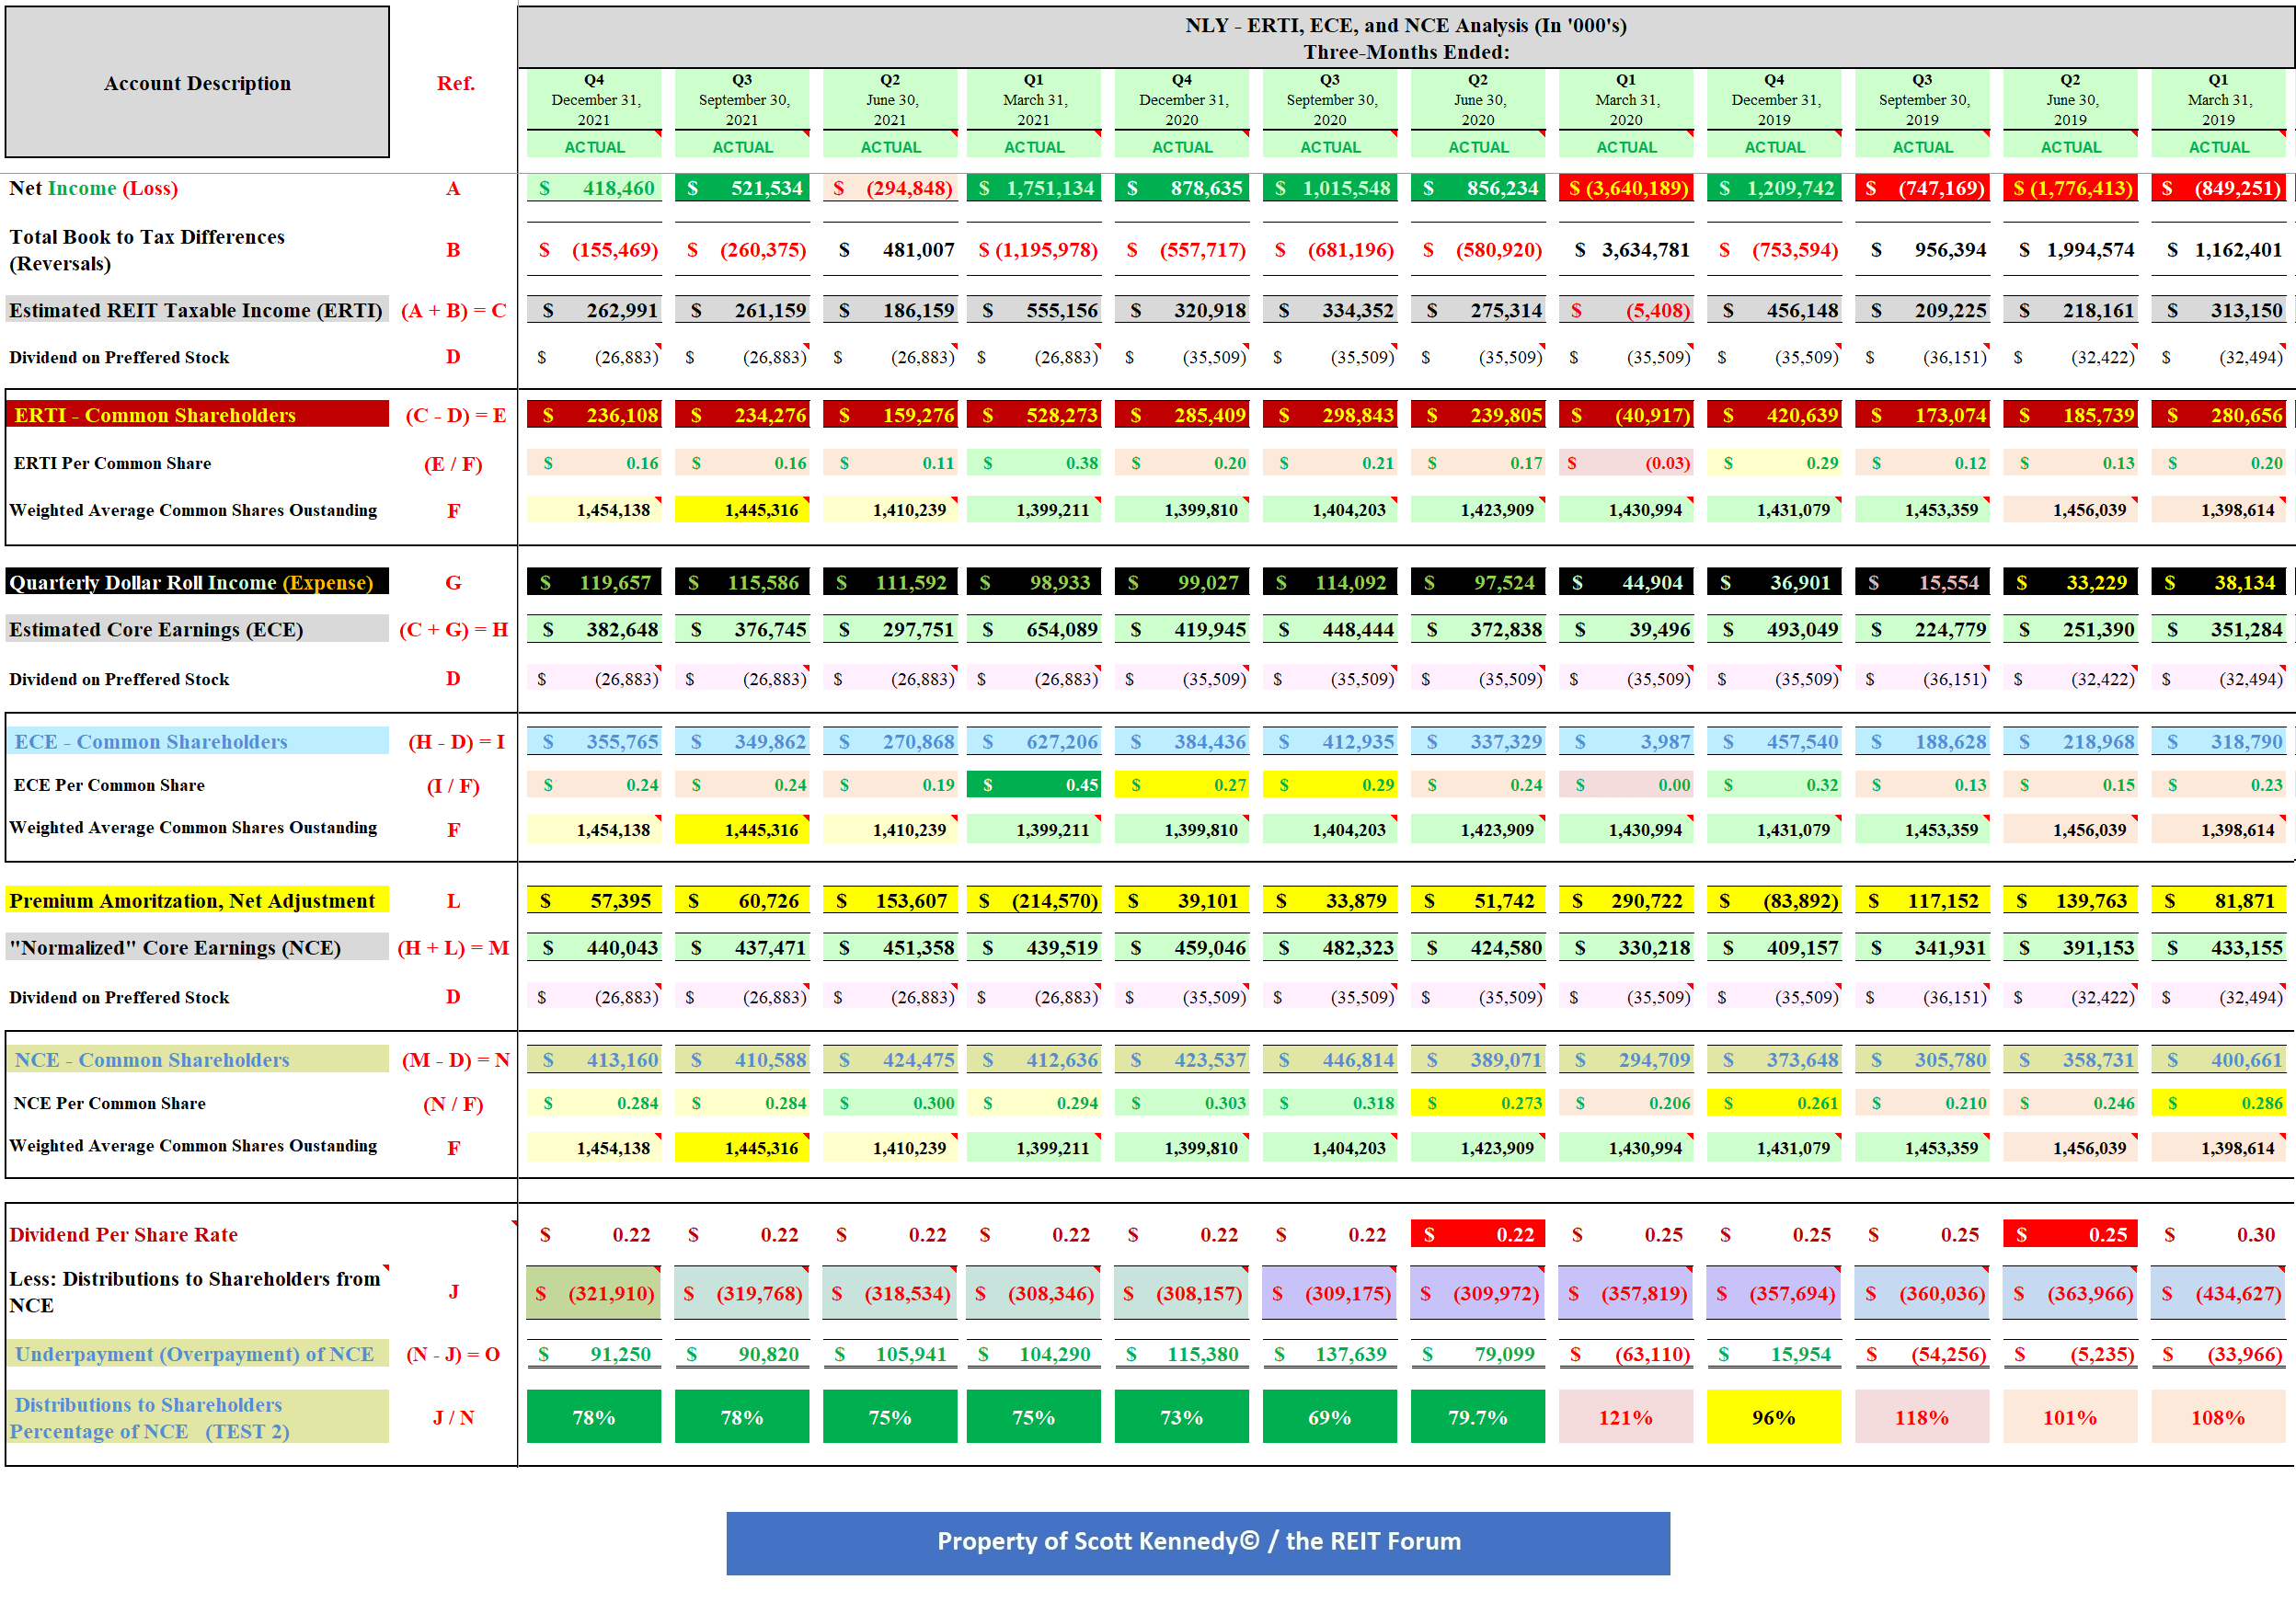
(Source: Table created by me, partially using data obtained from NLY’s quarterly shareholder presentation for the first quarter of 2019-fourth quarter of 2021)
Using Table 5 above as a reference, NLY reported quarterly ERTI available to common shareholders of $280.7, $185.7, $173.1, and $420.6 million for the first, second, third, and fourth quarters of 2019, respectively (see red reference “E”). When calculated, NLY had ERTI available to common shareholders of $0.20, $0.13, $0.12, and $0.29 per share, respectively (see red reference “E / F”). This was notably below, notably below, notably below, and slightly above the company’s dividend of $0.30, $0.25, $0.25, and $0.25 per common share, respectively.
However, this figure excluded the impact of NLY’s net long “to-be-announced” (“TBA”) mortgage-backed securities (“MBS”) position during each quarter. When including “net dollar roll” (“NDR”) income of $38.1, $33.2, $15.6, and $36.9 million (see red reference “G”), NLY reported quarterly ECE available to common shareholders of $318.8, $219.0, $188.6, and $457.5 million for the first, second, third, and fourth quarters of 2019, respectively (see red reference “I”). When calculated, NLY had quarterly ECE available to common shareholders of $0.23, $0.15, $0.13, and $0.32 per share, respectively (see red reference “I / F”). As readers can see, NLY’s quarterly ECE was very volatile during 2019.
However, NCE considers an additional Generally Accepted Accounting Principles (“GAAP”) to IRC adjustment when compared to quarterly ERTI and ECE (specifically when it comes to NLY). When it comes to most other mREIT peers, this specific adjustment is performed within each mREIT’s quarterly ERTI figure. Very important to understand. Dependent upon management’s projected lifetime conditional prepayment rate (“CPR”) in regards to NLY’s MBS portfolio, the “catch-up” premium amortization expense adjustment can materially alter the company’s quarterly ERTI and ECE figures. NCE excludes/reverses this GAAP adjustment since an entity’s cost basis per the IRC is not par.
As such, when also including NLY’s catch-up premium amortization expense adjustment of $81.9, $139.8, $117.2, and ($83.9) million (see red reference “L”), the company reported NCE/EAD available to common shareholders of $400.7, $358.7, $305.8, and $373.6 million for the first, second, third, and fourth quarters of 2019, respectively (see red reference “N”). When calculated, NLY had NCE/EAD available to common shareholders of $0.29, $0.25, $0.21, and $0.26 per share, respectively (see red reference “N / F”). NLY’s NCE/EAD calculates to a quarterly dividend distributions payout ratio of 108%, 101%, 118%, and 96% for the first, second, third, and fourth quarters of 2019, respectively (see red reference “J / N”).
NLY’s NCE/EAD payout ratio of 108% for the first quarter of 2019 was the largest overpayment of this metric since the first quarter of 2014. As such, the “pressure” to consider reducing NLY’s quarterly common stock dividend of $0.30 per share began to grow earlier in 2019. I believe two of the main reasons why NLY reduced the company’s quarterly common stock dividend during the second quarter of 2019 were the following: 1) notably less “specialness”/attractiveness of the forward TBA market (notable decrease in NDR income when keeping constant one’s net long TBA MBS notional balance); and 2) 2017-2018 rapid rise of the Fed Funds Rate which led to a rapid increase in repurchase (“repo”) loan rates (borrowing costs). I believe this provides strong, factual evidence as to why NLY, at the time, reduced the company’s quarterly dividend rate to $0.25 per common share during the second quarter of 2019.
Furthermore, even with NLY’s ($0.05) per common share decrease to the company’s dividend during the second quarter of 2019, NLY still had a quarterly dividend distributions payout ratio of 101% for the second quarter of 2019. I believe this was a bit “alarming” since NLY just reduced the company’s common stock dividend by (17%) while still having a very minor overpayment (greater than 100% but less than 105% payout). In addition, during the third quarter of 2019, NLY already had a quarterly dividend distributions payout ratio of 118%. Simply put, this should have been seen as “very alarming” since this payout was already based on NLY’s reduced dividend of $0.25 per common share. This “hinted” there was already some pressure on NLY to reduce the dividend again.
I also believe this 118% payout for the third quarter of 2019 was the main reason NLY “pre-announced” their common stock dividend for the fourth quarter of 2019 (which was unchanged at $0.25 per common share). Simply put, management wanted to “calm down” markets with an unchanged dividend. At the time, this was due to the fact management believed the partially inverted yield curve would “correct itself” during 2020. While I previously correctly projected NLY’s NCE/EAD for the fourth quarter of 2019 would increase when compared to the third quarter of 2019 (recent steepening of the yield curve; including the beginning of a decrease in repo loan rates/borrowing costs), when it comes to dividend sustainability, I previously stated this specific metric still needed to be monitored over the foreseeable future.
Moving to 2020, NLY reported quarterly ERTI available to common shareholders of ($40.9) million for the first quarter of 2020. When calculated, NLY had ERTI available to common shareholders of ($0.03) per share. This figure was notably below the company’s dividend of $0.25 per common share for the first quarter of 2020. As discussed earlier, this figure excluded the impact of NLY’s net long TBA MBS position and lifetime CPR adjustment. When including NDR income of $44.9 million, NLY reported quarterly ECE available to common shareholders of $4.0 million for the first quarter of 2020. When calculated, NLY had quarterly ECE available to common shareholders of less than $0.01 per share. When also including NLY’s catch-up premium amortization expense adjustment of $290.7 million, the company reported NCE/EAD available to common shareholders of $294.7 million for the first quarter of 2020. When calculated, NLY had NCE/EAD available to common shareholders of $0.21 per share. This calculates to a quarterly dividend distributions payout ratio of 121%. This percentage surpassed the third quarter of 2019 as being NLY’s highest quarterly dividend distributions payout ratio since the first quarter of 2014.
As such, the pressure to consider reducing NLY’s quarterly common stock dividend of $0.25 per share, which began back in the second half of 2019, only mounted with the company’s performance of this specific metric during the first quarter of 2020. I believe two of the main reasons why NLY reduced the company’s quarterly common stock dividend during the second quarter of 2020 were the following: 1) reduction in investment portfolio size as a direct result of the “spike” in leverage, liquidity; and 2) spread/basis risk in March 2020 as a direct result of the COVID-19 pandemic panic (including the impact this event had on broader credit/equity markets).
With that said, NLY’s quarterly dividend was reduced twice within five quarters. Simply from an annual taxation standpoint, this boded well for dividend sustainability in the future (less taxable income is being paid out during the year; leading to less “short-falls” at year-end). As important, NLY’s “prospects” for taxable income over the foreseeable future “brightened” as a direct result of the early 2020 rapid decline of the Fed Funds Rate; which in turn caused a quick drop in agency repo loan rates. In addition, the specialness/attractiveness of the forward TBA MBS market once again increased (especially within lower coupons).
At the time, since the probability of short-term rates remaining “lower for longer” appeared to greatly outweigh the 2018-2019 trend of rising short-term interest rates, mREIT peers who continued (or “rotated”) capital into agency MBS experienced attractive net interest margins (even as lower coupons become a greater share of the secondary MBS market). This began to play out during the second quarter of 2020 which continued during the third and fourth quarters of 2020 (which was previously correctly projected). The magnitude of borrowing cost decreases “outweighed” continued elevated prepayments and the gradual shift into lower coupons. As such, net portfolio yields are an important metric to continually monitor (which is something I always project/track).
NLY reported quarterly ERTI available to common shareholders of $239.8, $298.8, and $285.4 million for the second, third, and fourth quarters of 2020, respectively. When calculated, NLY had ERTI available to common shareholders of $0.17, $0.21, and $0.20 per share, respectively. These figures were slightly-modestly below the company’s dividend of $0.22 per common share for the second-fourth quarters of 2020. As discussed earlier, this figure excluded the impact of NLY’s net long TBA MBS position and lifetime CPR adjustment. When including NDR income of $97.5, $114.1, and $99.0 million, NLY reported quarterly ECE available to common shareholders of $337.3, $412.9, and $384.4 million for the second, third, and fourth quarters of 2020, respectively. When calculated, NLY had quarterly ECE available to common shareholders of $0.24, $0.29, and $0.27 per share, respectively.
When also including NLY’s catch-up premium amortization expense adjustment of $51.7, $33.9, and $39.1 million, the company reported NCE/EAD available to common shareholders of $389.1, $446.8, and $423.5 million for the second, third, and fourth quarters of 2020, respectively. When calculated, NLY had NCE/EAD available to common shareholders of $0.27, $0.32, and $0.30 per share, respectively. This calculates to a quarterly dividend distributions payout ratio of 80%, 69%, and 73%, respectively. With the nice “bounce back” in NLY’s NCE/EAD, along with the reduced dividend, these were the lowest quarterly dividend distributions payout ratios since the I began covering this mREIT back in the first quarter of 2013 (a very positive catalyst/trend).
Moving to 2021, NLY reported quarterly ERTI available to common shareholders of $528.3, $159.3, $234.3, and $236.1 million for the first, second, third, and fourth quarters of 2021, respectively. When calculated, NLY had ERTI available to common shareholders of $0.38, $0.11, $0.16, and $0.16 per share, respectively. This figure was notably above, notably below, modestly below, and modestly below the company’s dividend of $0.22 per common share for the first, second, third, and fourth quarters of 2021, respectively. As discussed earlier, this figure excluded the impact of NLY’s net long TBA MBS position and lifetime CPR adjustment. When including NDR income of $98.9, $111.6, $115.6, and $119.7 million, NLY reported quarterly ECE available to common shareholders of $627.2, $270.9, $349.9, and $355.8 million for the first, second, third, and fourth quarters of 2021, respectively. When calculated, NLY had quarterly ECE available to common shareholders of $0.45, $0.19, $0.24, and $0.24 per share, respectively. When also including NLY’s catch-up premium amortization expense adjustment of ($214.6), $153.6, $60.7, and $57.4 million, the company reported NCE available to common shareholders of $412.6, $424.5, $410.6, and $413.2 million for the first, second, third, and fourth quarters of 2021, respectively. When calculated, NLY had NCE available to common shareholders of $0.29, $0.30, $0.28, and $0.28 per share, respectively. This calculates to a quarterly dividend distributions payout ratio of 75%, 75%, 78%, and 78% for the first, second, third, and fourth quarters of 2021, respectively. Simply put, an attractive quarterly dividend distributions payout ratio throughout 2022.
When compared to my NLY NCE/EAD projection of $0.275 per common share for the fourth quarter of 2021 (provided to subscribers of the REIT Forum), NLY’s NCE/EAD of $0.284 per common share was nearly an exact match – very minor outperformance (range $0.250-$0.300 per share). As such, I projected a NCE decrease of ($0.009) per common share. In actuality, NLY reported an unchanged NCE per common share. The institutional analysts’ consensus average was $0.263 per common share for the fourth quarter of 2021. So, my projection was slightly more accurate (a consistent theme during this past earnings season).
Including this past quarter, I personally have beaten the institutional analysts’ consensus average on earnings in 36 out of a total of 39 quarters regarding the stocks I personally cover in 2 different sectors. This calculates to a 92.1% outperformance rating. Simply put, to be among the best (regarding projecting valuations/earnings), you have to get your hands dirty (have to put in the extensive research/work necessary to set [and keep] the bar high). This is especially true when it comes to any type of paid, subscriber-based platform in my professional opinion. This is something long-term readers/subscribers of our service have come to know, understand, and rely upon quarter-after-quarter, year-after-year.
Once again using Table 4 as a reference, NLY declared a dividend of $0.22 per share for the first quarter of 2022. This was an unchanged dividend when compared to the prior quarter. NLY’s stock price traded at $7.43 per /share on 3/29/2022. When calculated, this was a TTM dividend yield of 11.84%, an annual forward yield to NLY’s stock price as of 3/29/2022 of 11.84%, and an annual forward yield to the company’s estimated CURRENT BV of 13.54%. When comparing each yield percentage to NLY’s agency mREIT peers within this analysis, the company’s TTM dividend yield percentage and annual forward yield percentage based on its stock price remained near (less than 0.50%) average while its annual forward yield percentage based on its estimated CURRENT BV was now modestly (at or greater than 1.00% but less than 2.00%) above average. Going forward, I continue to believe NLY should have an annual forward yield slightly-modestly above the agency mREIT average. I would also point out, similar to the prior quarter, AAIC’s 0% yield metrics skew the agency mREIT yield averages down a bit.
A Couple Ranked Comparisons Between NLY and the Company’s 19 Other mREIT Peers (For The REIT Forum Subscribers):
Previously, I correctly projected most mREIT peers declared their “dividend lows” back in 2020 (which I originally correctly projected “as it was occurring” last year). However, as noted in the prior yield analysis, there are now some agency mREIT sub-sector peers that have yields in the “cautious” (yellow-/tan-shaded) range. In addition, unlike the prior yield analysis, NLY and TWO are now also in this cautious (yellow-shaded) range as well. Personally, I am not too worried yet about this specific yield metric’s results regarding NLY and TWO. However, I believe it only solidifies some caution regarding ARR, CHMI, and IVR.
However, it should be noted all hybrid, originator + servicer, and commercial whole loan sub-sector peers still have very low-relatively low forward yields. Since these mREIT peers, generally speaking, have not had as severe BV declines during the first quarter of 2022 (a couple could even report a BV increase), these companies are less vulnerable to dividend per share rate declines over the next couple of quarters. However, as is always the case, this is something I/we will continuously monitor as 2022 unfolds.
I would point out ORC accounts for the company’s premium amortization expense equivalent differently when compared to its agency mREIT sub-sector peers. First, this leads to timing differences which can “prop up” weighted average yields during certain interest rate cycles. As such, ORC’s yield percentages continue to be above the agency mREIT sub-sector average. Second, this can “appear to buoy” ORC net spread metrics when, in reality, a reclassification of the company’s equivalent to premium amortization expense would show a much more modest net spread income metric. This is also why a larger than average agency mREIT percentage of ORC’s dividend declarations over the past several years have been classified as a “return on capital” (“ROC”) distribution. Simply put, ORC continues to distribute dividends in excess of the company’s annual REIT taxable income (“AREITTI”). Further discussion of this ORC topic is beyond a NLY sector comparison article (also has been extensively covered in prior ORC mREIT articles over the years).
Conclusions Drawn (PART 2):
PART 2 of this article compared NLY to 19 mREIT peers in regards to recent dividend per share rates, yield percentages, and several other dividend sustainability metrics. This article also discussed NLY’s past dividend decrease of ($0.05) and ($0.03) per common share during the second quarter of 2019 and 2020, respectively. Using Table 4 as a reference, the following were the recent dividend per share rate and yield percentages for NLY:
$0.22 per common share dividend for the first quarter of 2022; 11.84% TTM dividend yield; 11.84% annual forward yield to the company’s stock price as of 3/29/2022; and 13.54% annual forward yield to my projected CURRENT BV.
When combining this data along with metrics within Table 5 (most notably NCE/EAD) and other modeling sources, the following probability regarding NLY’s near-term dividend sustainability is provided:
NLY: High (80%) probability of a stable dividend for Q2 2022 (10% decrease compared to last quarter’s Q2 2022 dividend probability)
NLY: Relatively High (70%) probability of stable dividend for Q3 2022
Q2 2022 Projected NCE/EAD: $0.245-$0.295 per common share
Preliminary Q3 2022 Projected NCE/EAD: $0.230-$0.260 per common share
I believe the movement of MBS prices will directly impact NLY’s use of the TBA forward market (which directly impacts NDR income). As explained in PART 1 of this article, NLY’s portfolio composition, leverage, borrowing costs, hedging coverage ratio (risk management strategy), and prepayment speeds also need to be considered when discussing this topic. The main factor for NLY’s projected NCE/EDA to remain above the company’s dividend per share rate is the continued historically low borrowing costs in direct relation to the company’s agency MBS holdings (rising but still remaining historically low during 2022) partially mitigated by higher borrowing costs of NLY’s other sub-portfolios (due to credit risk), growing extension risk, and an eventual increase in net hedging costs on all new derivative instruments (though existing interest rate payer swaps will experience an attractive reversal of expenses to income which partially assists rising repo costs).
20 mREIT Dividend Projections for Q2 2022 (Solely for The REIT Forum Subscribers):
My BUY, SELL, or HOLD Recommendation:
From the analysis provided above (using Table 1b as a reference), including additional catalysts/factors not discussed within this article, I currently rate NLY as a SELL when I believe the company’s stock price is trading at or greater than a 5% premium to my projected CURRENT BV ($6.50 per share), a HOLD when trading at less than a 5% premium through less than a (5%) discount to my projected CURRENT BV, and a BUY when trading at or greater than a (5%) discount to my projected CURRENT BV. These percentage ranges are unchanged when compared to my last public NLY article (PART 1 of this analysis).
Therefore, I currently rate NLY as a SELL.
As such, I currently believe NLY is overvalued from a stock price perspective. My current price target for NLY is approximately $6.85 per common share. This is currently the price where my recommendation would change to a HOLD. The current price where my recommendation would change to a BUY is approximately $6.15 per common share.
Along with the data presented within this article, this recommendation considers the following mREIT catalysts/factors: 1) projected future MBS/investment price movements; 2) projected future derivative valuations; and 3) projected near-term dividend per share rates. These recommendations also consider the 8 Federal (“Fed”) Funds Rate increases by the FOMC during December 2016-2018 (a more hawkish tone/rhetoric when compared to 2014-2016), the three Fed Funds Rate decreases during 2019 due to the more dovish tone/rhetoric regarding overall monetary policy as a result of recent macroeconomic trends/events, and the very quick “plunge” in the Fed Funds Rate to near 0% in March 2020. This also considers the previous wind-down/decrease of the Fed Reserve’s balance sheet through gradual runoff/partial non-reinvestment (which began in October 2017 which increased spread/basis risk) and the prior “easing” of this wind-down that started in May 2019 regarding U.S. Treasuries and August 2019 regarding agency MBS (which partially reduced spread/basis risk when volatility remained subdued). This also considers the early Spring 2020 announcement of the start of another round of quantitative easing (“QE”) that includes the Fed specifically purchasing agency MBS (and “rolling over” all principal and interest payments into new agency MBS) which bolstered prices while keeping long-term/mortgage interest rates near historical lows (which lowered spread/basis risk for quite some time when volatility remained subdued). This also includes the recent “taper” of the Fed’s most recent QE program regarding its monthly purchases of $80 billion of U.S. Treasury securities and $40 billion of agency MBS. This taper began in November 2021 and market speculation around this future event has already caused a rise in spread/basis risk this past summer and during the second half of the fourth quarter of 2021-first quarter of 2022 (as correctly previously anticipated). This includes the FOMC’s recent accelerated taper and the continued rise in the Fed Funds Rate which began in March 2022. Spread/Basis risk should begin to abate during the spring of 2022.
Current Sector/Recent NLY/AGNC Stock Disclosures:
On 3/18/2020, I initiated a position in NLY at a weighted average purchase price of $5.05 per share (large purchase). This weighted average per share price excluded all dividends received/reinvested. On 6/9/2021, I sold my entire NLY position at a weighted average sales price of $9.574 per share as my price target, at the time, of $9.55 per share was surpassed. This calculates to a weighted average realized gain and total return of 89.6% and 112.0%, respectively. I held this position for approximately 15 months.
On 3/18/2020, I once again initiated a position in AGNC at a weighted average purchase price of $7.115 per share (large purchase). This weighted average per share price excludes all dividends received/reinvested. On 6/2/2021, I sold my entire AGNC position at a weighted average sales price of $18.692 per share as my price target, at the time, of $18.65 per share was surpassed. This calculates to a weighted average realized gain and total return of 162.7% and 188.6%, respectively. I held this position for approximately 14.5 months.
On 1/31/2017, I initiated a position in NRZ at a weighted average purchase price of $15.10 per share. On 6/29/2017, 7/7/2017, and 12/21/2018, I increased my position in NRZ at a weighted average purchase price of $15.775, $15.18, and $14.475 per share, respectively. When combined, my NRZ position had a weighted average purchase price of $14.912 per share. This weighted average per share price excluded all dividends received/reinvested. On 2/6/2020, I sold my entire NRZ position at a weighted average sales price of $17.555 per share as my price target, at the time, of $17.50 per share was surpassed. This calculates to a weighted average realized gain and total return of 17.7% and 41.2%, respectively. I held this position, on a weighted average basis, for approximately 20 months.
On 9/22/2020, I once again initiated a position in NRZ at a weighted average purchase price of $7.645 per share. On 1/28/2021, 7/16/2021, and 8/20/2021, I increased my position in NRZ at a weighted average purchase price of $9.415, $9.525, and $9.485 per share, respectively. When combined, my NRZ position has a weighted average purchase price of $8.918 per share. This weighted average per share price excludes all dividends received/reinvested.
On 1/2/2020, I initiated a position in AAIC at a weighted average purchase price of $5.57 per share. On 1/9/2020, 3/16/2020, 9/24/2020, 5/6/2021, 9/2/2021, 9/10/2021, 11/10/2021, 11/24/2021, and 3/3/2022, I increased my position in AI at a weighted average purchase price of $5.59, $3.25, $2.53, $3.875, $3.748, $3.75, $3.752, $3.70, and $3.39 per share, respectively. When combined, my AAIC position has a weighted average purchase price of $3.456 per share. This weighted average per share price excludes all dividends received/reinvested.
On 10/19/2020, I initiated a position in PMT at a weighted average purchase price of $16.275 per share. On 10/29/2020, 8/12/2021, 8/20/2021, 11/18/2021, and 2/4/2022, I increased my position in PMT at a weighted average purchase price of $14.90, $18.693, $18.407, $18.180, and $16.024 per common share, respectively. When combined, my PMT position has a weighted average purchase price of $16.349 per share. This weighted average per share price excludes all dividends received/reinvested.
On 12/1/2020, I initiated a position in DX at a weighted average purchase price of $16.59 per share. On 12/20/2021, I increased my position in DX at a weighted average purchase price of $15.35 per share. When combined, my DX position has a weighted average purchase price of $15.66 per share. This weighted average per share price excludes all dividends received/reinvested.
On 10/12/2018, I initiated a position in GPMT at a weighted average purchase price of $18.155 per share. On 5/12/2020, 5/27/2020, 5/28/2020, 8/26/2020, 9/10/2020, and 9/11/2020, I increased my position in GPMT at a weighted average purchase price of $4.745, $5.144, $5.086, $6.70, $6.19, and $6.045 per share, respectively. My last two purchases made up approximately 50% of my total position (to put things in better perspective). When combined, my GPMT position had a weighted average purchase price of $6.234 per share. This weighted average per share price excluded all dividends received/reinvested. On 6/8/2021, I sold my entire GPMT position at a weighted average sales price of $15.783 per share as my price target, at the time, of $15.75 per share was surpassed. This calculates to a weighted average realized gain and total return of 153.2% and 168.7%, respectively. I held this position, on a weighted average basis, for approximately 11 months.
On 12/10/2021, I once again initiated a position in GPMT at a weighted average purchase price of $11.817 per share. On 12/15/2021, I increased my position in GPMT at a weighted average purchase price of $11.318 per share. When combined, my GPMT position has a weighted average purchase price of $11.484 per share. This weighted average per share price excludes all dividends received/reinvested.
On 1/24/2022, I initiated a position in RC at a weighted average purchase price of $13.39 per share. This weighted average per share price excludes all dividends received/reinvested.
Final Note: All trades/investments I have performed over the past several years have been disclosed to readers in “real time” (that day at the latest) via either the StockTalks feature of Seeking Alpha or, more recently, the “live chat” feature of the Marketplace Service the REIT Forum (which cannot be changed/altered). Through these resources, readers can look up all my prior disclosures (buys/sells) regarding all companies I cover here at Seeking Alpha (see my profile page for a list of all stocks covered). Through StockTalk disclosures and/or the live chat feature of the REIT Forum, at the end of March 2022 I had an unrealized/realized gain “success rate” of 91.8% and a total return (includes dividends received) success rate of 95.1% out of 61 total past and present mREIT and business development company (“BDC”) positions (updated monthly; multiple purchases/sales in one stock count as one overall position until fully closed out). I encourage other Seeking Alpha contributors to provide real time buy and sell updates for their readers/subscribers which would ultimately lead to greater transparency/credibility. Starting in January 2020, I have transitioned all my real-time purchase and sale disclosures solely to members of the REIT Forum. All applicable public articles will still have my “main ticker” purchase and sale disclosures (just not in real time).
Table 6 – NLY + AGNC The REIT Forum Seeking Alpha Recommendations (November 2019 – March 2022 Timeframe)
The REIT Forum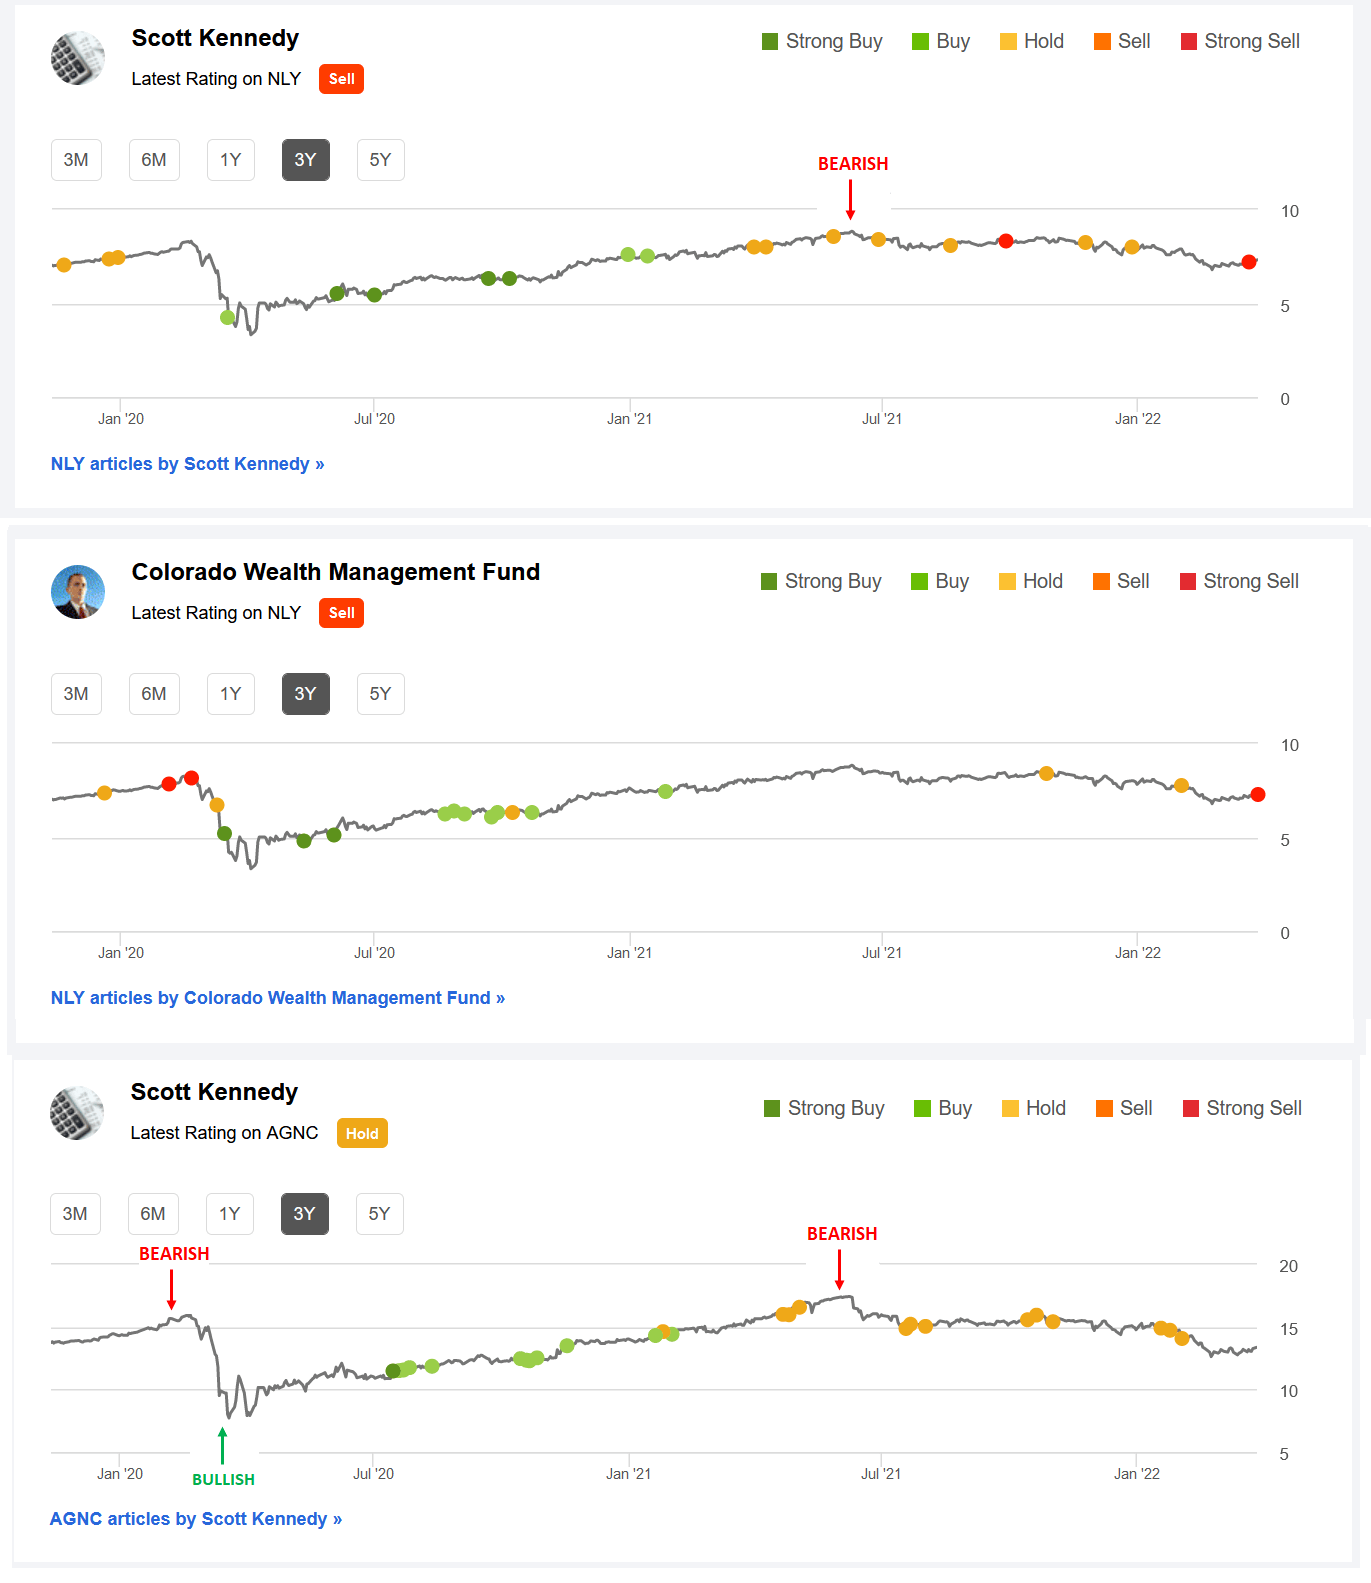
(Source: Table directly from Seeking Alpha; 1st AGNC “Bearish” indicator included by me directly from the public AGNC article dated 2/5/2020 recommendation (which can’t be changed once public), AGNC “Bullish” indicator included by me directly from the public AGNC article dated 4/17/2020 recommendation, and 2nd “Bearish” indicator included by me directly from the REIT Forum’s weekly subscriber recommendation article series [week of 6/4/2021 for AGNC and week of 6/11/2021 for NLY])
Lastly, I just want to quickly highlight my/our AGNC and NLY Seeking Alpha recommendation ranges over the past 3 years or so. In my personal opinion, a stock with a BUY recommendation should increase in price over time, a SELL recommendation should decrease in price over time, and a HOLD recommendation should remain relatively unchanged in price over time (pretty logical). Simply put, my/our “valuation methodology” has correctly timed when both AGNC and NLY have been undervalued (a BUY recommendation; bullish), overvalued (a SELL recommendation; bearish), and appropriately valued (a HOLD recommendation; neutral).
Using Table 6 above as a reference, I believe we have done a pretty good job in my/our AGNC and NLY recommendation ratings. For NLY, both pricing charts should really be viewed as 1 combined chart since CO and I are part of the same Marketplace service team. Not only do I/we want to provide guidance/a recommendation that enhances total returns for subscribers, I/we also want to protect these generated returns by subsequently minimizing total losses. I personally believe this methodology/strategy is very important. In other words, correctly spotting both positive catalysts/trends and negative factors/trends as economic and interest rate cycles fluctuate.
This methodology/strategy was extremely useful/accurate when going back to very late 2019 and early 2020 (both pre-COVID-19) where I/we had a SELL recommendation on both AGNC and NLY. For some reason, this S.A. pricing chart does not show my AGNC SELL recommendation pre-COVID-19 but one can simply look to past public articles in early 2020 (just an omission on S.A.’s end in this particular case). As an alternative, simply look at the NLY SELL recommendation highlighted in CO’s pricing chart (AGNC and NLY typically have very similar recommendation ranges when considering similar time periods). Furthermore, after the initial “pandemic panic”, I/we had a STRONG BUY recommendation on both AGNC and NLY later in the spring of 2020.
Simply put, a contributor’s/team’s recommendation track record should “count for something” and should always be considered when it comes to credibility/successful investing. You will not see most (if not all) other contributor teams use this type of factual, recommendation-driven price chart because the results are not nearly as “attractive” when compared to our own.
Each investor’s BUY, SELL, or HOLD decision is based on one’s risk tolerance, time horizon, and dividend income goals. My personal recommendation will not fit each reader’s current investing strategy. The factual information provided within this article is intended to help assist readers when it comes to investing strategies/decisions.
Understanding My Valuation Methodology Regarding mREIT Common and BDC Stocks:
The basic “premise” around my recommendations in the mREIT common and BDC sectors is value. Regarding operational performance over the long-term, there are above average, average, and below average mREIT and BDC stocks. That said, better-performing mREIT and BDC peers can be expensive to own, as well as being cheap. Just because a well-performing stock outperforms the company’s sector peers over the long-term, this does not mean this stock should be owned at any price. As with any stock, there is a price range where the valuation is cheap, a price where the valuation is expensive, and a price where the valuation is appropriate. The same holds true with all mREIT common and BDC peers. As such, regarding my investing methodology, each mREIT common and BDC peer has their own unique BUY, SELL, or HOLD recommendation range (relative to estimated CURRENT BV/NAV). The better-performing mREITs and BDCs typically have a recommendation range at a premium to BV/NAV (varying percentages based on overall outperformance) and vice versa with the average/underperforming mREITs and BDCs (typically at a discount to estimated CURRENT BV/NAV).
Each company’s recommendation range is “pegged” to estimated CURRENT BV/NAV because this way subscribers/readers can track when each mREIT and BDC peer moves within the assigned recommendation ranges (daily if desired). That said, the underlying reasoning why I/we place each mREIT and BDC recommendation range at a different premium or (discount) to estimated CURRENT BV/NAV is based on roughly 15-20 catalysts which include both macroeconomic catalysts/factors and company-specific catalysts/factors (both positive and negative). This investing strategy is not for all market participants. For instance, not likely a “good fit” for extremely passive investors. For example, investors holding a position in a particular stock, no matter the price, for say a period of 5+ years. However, as shown throughout my articles written here at Seeking Alpha since 2013, in the vast majority of instances I have been able to enhance my personal total returns and/or minimize my personal total losses from specifically implementing this particular investing valuation methodology. I hope this provides some added clarity/understanding for new subscribers/readers regarding my valuation methodology utilized in the mREIT common and BDC sectors. Please disregard any minor “cosmetic” typos if/when applicable.
Be the first to comment