

Ozgu Arslan/iStock via Getty Images
Investment Summary
We are neutral on AngioDynamics, Inc. (NASDAQ:ANGO) shares. The investment debate is split between sector-specific tailwinds and systematic risks the market continues to price in for FY22. With a lack of profitability, upshifting covariance structure, and unjustified premium, we struggle to see how ANGO will re-rate in this current regime.
Exhibit 1. ANGO 12-month price action
Data: HB Insights; Updata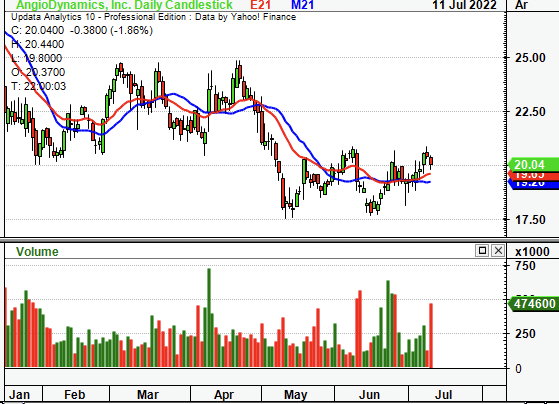
However, softening platinum prices and a weaker PPI for the medical and surgical catheter segment point to a potential growth in margins and earnings protection in FY22. With this in mind, there’s a balance to the risk/reward calculus. We price ANGO at $25 per share and look to other names in the space. Rate neutral.
Q4 and FY22 earnings recap illustrates sales trajectory
First, turning to the quarter, revenues came in at ~$87 million, a ~13% YoY growth schedule. The medical technology (“medtech”) segment contributed ~$22.5 ($0.58/share) million to the top, up 40% YoY from ~$16 million last quarter. Sales were driven by the company’s Auryon Peripheral Atherectomy platform (“APA”) and its NanoKnife irreversible electroporation (“NIE”) platform. APA sales came in at almost $10 million ($0.25/share), adding momentum to ANGO’s thrombectomy portfolio. Medical device (“med device”) sales meanwhile came in at ~$64.5 million ($1.66/share), a ~600bps YoY gain. The newly-named endovascular therapies segment also posted a $45 million ($1.15/share) gain in Q4 after expanding ~18.5% YoY.
Meanwhile, net sales in its oncology segment came in at $15 million ($0.38), a YoY gain of ~580bps, underscored by uptick in sales of disposables of NIE. Whereas vascular access revenues were ~$26.5 million ($0.68/share) as well after gaining 9% on the year. Vascular Access net sales were $26.7 million ($0.68), an increase of 9.3%, compared to $24.5 million a year ago.
Non-GAAP gross margin came in at 53.5% with GAAP adjustment to 47.8%, each down ~170bps YoY but up sequentially. Management notes margins have been impacted by macroeconomic headwinds plaguing the sector, particularly, labour shortages, supply shortages, and surging input costs. Still, it printed more than $8.5 million ($0.21) in operating cash flow on tight CAPEX of $1 million, resulting in an operating loss of $6.4 million. Consequently, it printed a net loss of ~$6 million and a FCF loss of $7.5 (-$0.25/share) million.
Turning to the full year for FY22, ANGO printed sales of $316 million, a ~9% YoY gain. Medtech sales contributed ~25% of this with ~$79 million ($2.02/share), in line with FY21. Input cost pressures were felt throughout the P&L with gross margin tightening by ~150bps YoY. Management noted guidance of $342–$348 million, calling for ~10% growth at the top. It envisions this to pull through to $0.01–$0.06 in EPS for FY23, behind consensus $0.08 EPS.
Exhibit 2. ANGO came in with an above-average result in Q4 FY22
Gross-net margins lifting in FY22, FCF margins within range
Data: ANGO SEC Filings; HB Insights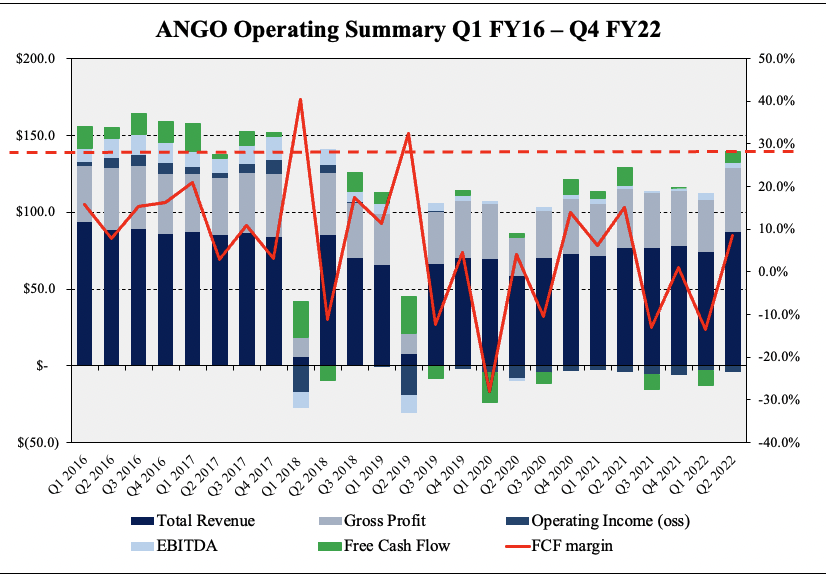
Macro-backdrop more relevant than ever
ANGO’s Q4 FY22 and FY22 annual results are integral to the company’s share price amid the current macro landscape. It has been beaten down in 2022 amid a number of macro-compressors that have plagued equity markets. Indeed, the macro-thematic has shifted to cost inflation, central bank tightening, and supply-chain headwinds, with plenty of other factors dotted in the mix. It’s imperative to have a grasp over the macro landscape to understand where the investment case lies for ANGO.
Firstly, the growth/bond correlation is showing signs of rolling over in July as the long end of the curve catches a bid. ANGO’s beta to long-duration treasuries ensured sellers were active all the way until January–June this year. This is incredibly important for equity positioning in ANGO’s case as investors look to be adding duration back to portfolios on the fixed income side. For equity duration, the picture is far less clear, with the rates trajectory still dictating the course of high-beta growth names, by estimation.
Exhibit 3. Investors are adding back duration to portfolios
Data: HB Insights; Updata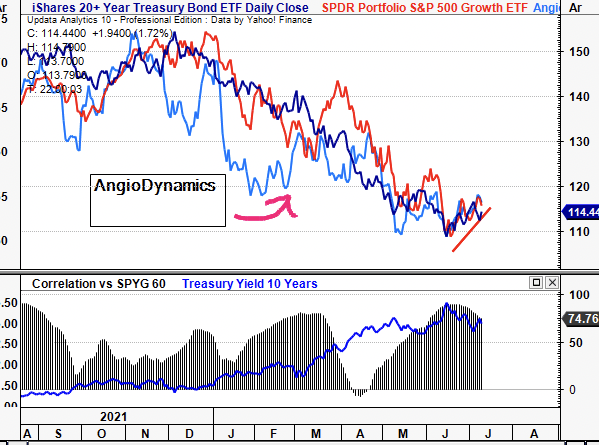
Adding complexity to the issue is the debate on inflation and where it is to head next. With nonfarm payrolls printing 21% ahead of estimates in June, economic expectations (and therefore, inflationary expectations) logically remain strong. This calls for the Fed to continue on its 75bps hiking trajectory. However, Brent Crude and copper futures have both slipped from March highs with copper, in particular, sliding deep into the red on recession fears. With Brent looking toppish, and copper paring FY21’s gains, the outlook for producer pricing activity may be brighter by dampening cost inflation. Moreover, US TIPS have de-rated and now trade back in line with FY19 levels as US 5y breakeven now look to inflation of ~2.6%.
Exhibit 4. Key producer pricing indicators cooling off whilst US TIPS trade back to FY19 levels
What’s this say for inflation? This is crucial to consider in the ANGO investment debate.
Data: HB Insights; Updata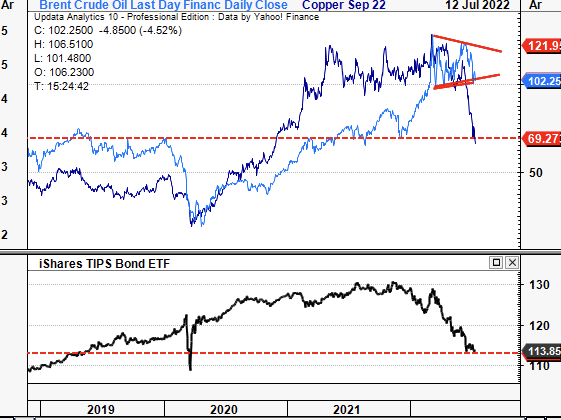
Reduction in cost inputs is integral to the outlook for the medtech sector, not to mention ANGO’s earnings quality. ANGO is set up for substantial contraction at the margin if cost inflation continues to hurt earnings power. Price elasticity in the thrombectomy and peripheral vascular sectors is relatively benign, making the pass-through of costs onto customers quite difficult. Hence the topic of inflation, central bank tightening, and supply chain headwinds are integral to the ANGO investment debate. One way we can examine this is to gauge the markets for the components of ANGO’s vascular access systems.
On this note, our findings indicate potential deflationary tailwinds from raw materials that are used to manufacture ablation and catheter devices. Catheters utilized in electrophysiological (“EP”) studies and ablation are typically composed of insulated wires encased in a type of polyurethane. Meanwhile, the electrodes used in EP catheters are typically made from polished platinum-iridium alloy. As the name implies, these are simply alloys of the platinum metals (platinum and iridium). It is used due to its conductive and malleable properties that make it suites for surgical instruments.
As seen in Exhibit 5, platinum spot has been compressing off a top of US$1,302 since early February 2021. This has caused a deflationary tailwind to the producer price index (“PPI”) for surgical and medical catheters index. A macro divergence has therefore emerged between these two instruments and the wider US surgical & medical instruments index (Exhibit 5) since that time. Whereas cost-inputs for the wider segment ratchet up for the surgical/medical catheters section and platinum has bifurcated to the downside.
We estimate this to be a key differential for ANGO and peers as it offers downside protection at the margin level. By extension, it gives cover over earnings and free cash conversion and is a point that investors should pay very close attention to. We’ve projected gross margins to print in line with Q4 FY22 in Q1 FY23 and continue lifting by ~100bps YoY. Management forecast a range of ~52–54% in FY23 as well. Consensus is in line with our projections at gross margin of 54.4% in FY23. Hence, this is a name set to grow sales and efficiency into the coming years in the face of cost pressures. This is supported by the underlying markets supplying producers and manufacturers.
Exhibit 5. Macro divergence in platinum/t.oz & surgical catheters to wider medical devices PPI
Divergence creates leverage at COGS and gross-net margins
Data: Refinitiv Datastream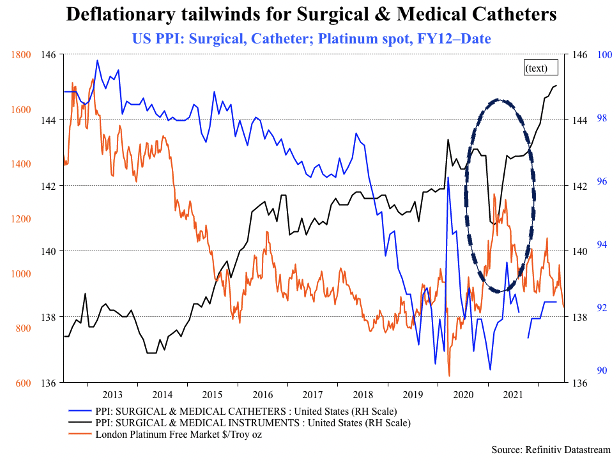
Factor premia have shifted to bottom line fundamentals
However, the market has shifted focus away from top line growth onto bottom line fundamentals in 2022 as investors look to step up in quality to protect wealth from equity drawdown. Profitability is therefore paramount, and investors have been rewarding low-beta, high-quality names in 2022 as the growth trade completely unwinds. Those with alternatives weighting across portfolios have fared well in 2022, retaining strategic and tactical alpha with uncorrelated equity return in the process. This point is important to the outlook for ANGO, seeing as low-beta names look set to continue outperforming beyond 2022 as well, by estimate.
Exhibit 6. Alternatives continue to offer strategic and tactical alpha looking ahead
Managed futures in particular providing ITM equity hedge
Data: HB Insights; Updata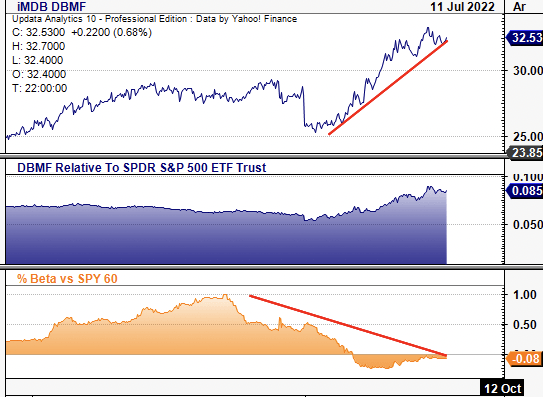
The ANGO share price has lost relative strength against the benchmark (SPX) in 2022 whereas its covariance structure has shifted upwards, as seen below. It trades as a high-beta name whose profitability has been compressed since the onset of Covid-19. As a result, investors have shunned the stock as they continue to price in a number of systematic risks outlined in this report. However, these are factors we are seeking to reduce exposure to in 2022 in favour of low-beta, cash-rich propositions.
Exhibit 7. ANGO turns out to be high-beta, low-quality – 2 factors investors are shunning in FY22, unlike last year
Data: HB Insights; Updata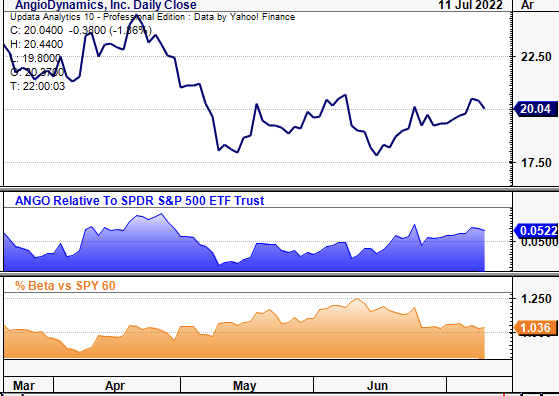
Further evidence of our thesis is seen in Exhibit 8. The ANGO share price looks to be converging towards its bottom line fundamentals, with EPS forecasts pointing to further downside beyond Q1 FY23. The price-premium it has enjoyed over its earnings yield from FY20–date has narrowed substantially as investors have de-rated names with weak cash flow and bottom line growth. This also adds to the point of low-beta outperforming, as so much of the market was tied up to unprofitability/top line growth emphasis last year. We estimate its lagging EPS to be a drag on share price appreciation looking ahead.
Exhibit 8. ANGO Converging to bottom line fundamentals
Corroborates to thesis laid out in this report
Data: Refinitiv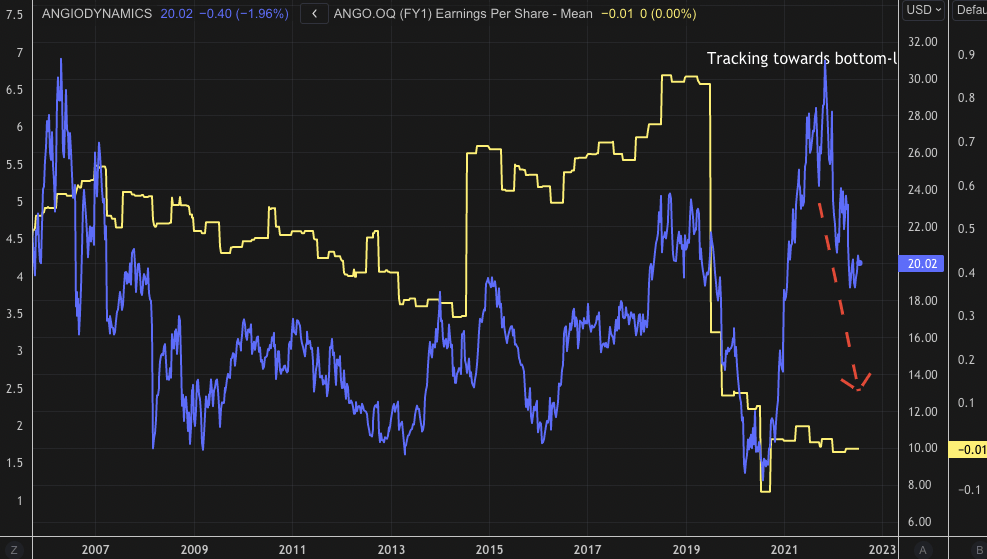
Valuation
Shares are trading at a substantial premium to peers in the industry group. It comes in at ~2x book and 2.5x sales, but its lack of profitability makes a firm valuation difficult. Judging from names within this comps table, we can’t justify ANGO’s premium across key multiples, particularly given its headwinds at the market level.
Exhibit 9. Multiples & Comps table
Data: HB Insights Investment Strategy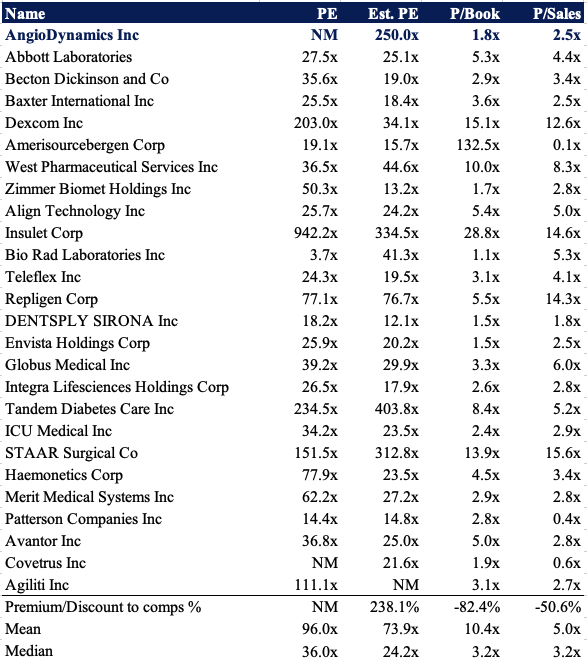
Realized incremental value flow has also been lacklustre to date and these trends look set to continue. Tangible value flow (FCF/share + EPS) has lagged, leading to a substantial weakness in value creation for shareholders. Looking ahead, we forecast the company to print FCF of around $11 million in FY23, suggesting a lack of unrealized value for shareholders. In total, shareholders have lost an incremental $6.31 in tangible value since August 2019, as seen below.
Exhibit 10. Incremental Tangible value flow has lagged
Provides soft backdrop for realized value flow for shareholders and valuation
Data & Image: HB Insights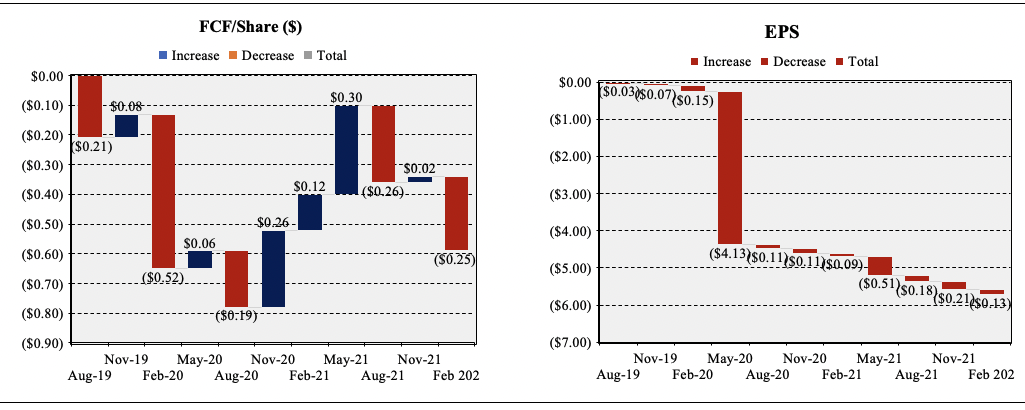
Point and figure charting reveals unambiguous price targets clustered around the $3.50–$5.50 zones. Upside targets point to a price objective of ~$24. Price action is bearish and prices have yet broken away from the outer resistance line to the downside. This corroborates the thesis that there’s a lack of upside to be harvested in the name for the foreseeable future until the market begins to re-rate names such as ANGO on all the drivers outlined in this report.
Exhibit 11. Multiple downside targets, upside target to $24
Data: HB Insights; Updata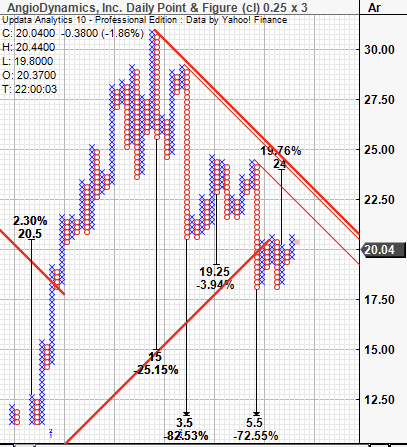
Assigning the sector median’s 3.5x forward sales sees a price objective of $26. Blending these with upside targets obtained above has us price ANGO at $25 per share.
Technical studies
On a 6-month daily cloud chart, shares are testing the cloud after trading in a flag-type setup since May. The lag line has yet to confirm any bullish action, however. OBV and momentum have ticked up lately and broke above longer-resistance levels but look to have settled again. These don’t seem convincing enough reversals in the trend indicators to suggest a breakout could be on the way. Price, OBV, and momentum are all fairly tight still with no divergence.
Exhibit 12. Trading below cloud support
Data: HB Insights; Updata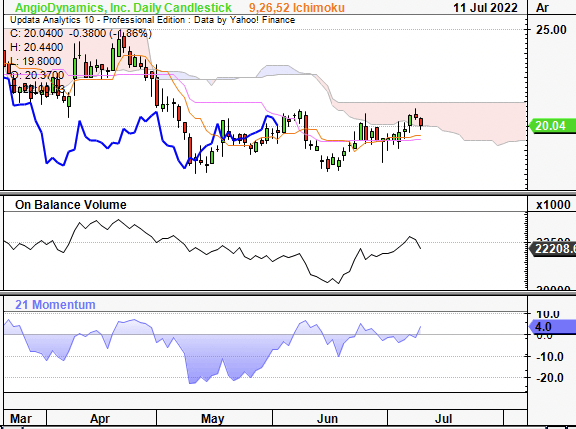
Retracing the fibs down from the 2021 high and we see the stock has respected the 50% level before 3x at resistance before breaking away to the downside. It is now testing the bottom bar of the retracement level and has been in a flag setup since May, trading in a sideways channel and respecting the 23% and 0% tabs of the fibs in striking fashion.
Exhibit 13. Testing 23 on the fibs and looks to head to $17.51
Data: HB Insights; Updata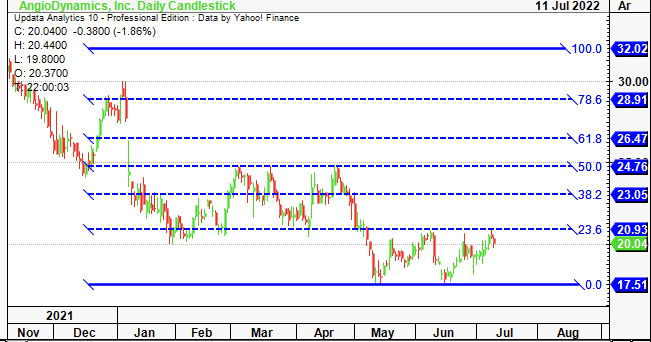
In short
ANGO presents with deflationary tailwinds in its niche operating segment that could protect earnings into the future. This needs to be factored into the investment debate as a key differentiator in the medtech sector. However, market fundamentals illustrate investors are rewarding profitability and bottom line fundamentals look set to keep this trend in situ. This explains some of ANGO’s downside this YTD and helps investors how to position the stock looking ahead.
We’ve priced ANGO at $25 per share, leading us to chase more respectable upside in other names. Without a directional view on the market, rate neutral.
Be the first to comment