

Oleh Stefaniak/iStock via Getty Images
Amphenol (NYSE:APH) is a global leader that provides electrical connections and sensors that power the modern way of life. Amphenol’s customers reach into just about every end market/industry imaginable. From aerospace, military, industrial, automotive that have longer product cycles to mobile devices, networking, broadband, and IT which has shorter cycles. Amphenol is one of those boring businesses that can ride the wave of many end markets as just about everything is becoming connected and electrified.
During FY 2021 only around 1/3 of sales came from North America with nearly half coming from Asia. As such FX changes can and will play a role in their underlying results.
APH FY 2021 Revenue by Region (APH FY 2021 Annual Report)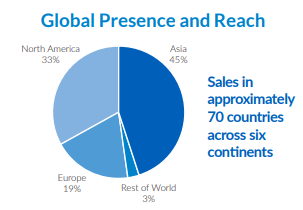
Amphenol also makes critical components for their customers; however, those individual components are typically cheap compared to the overall costs their customers bare to make their own products. The low cost and critical nature of their connections allows Amphenol to have relatively strong pricing power.
APH Acquisitions Evercore Conference Presentation (APH Acquisitions Evercore Conference Presentation sept 2022)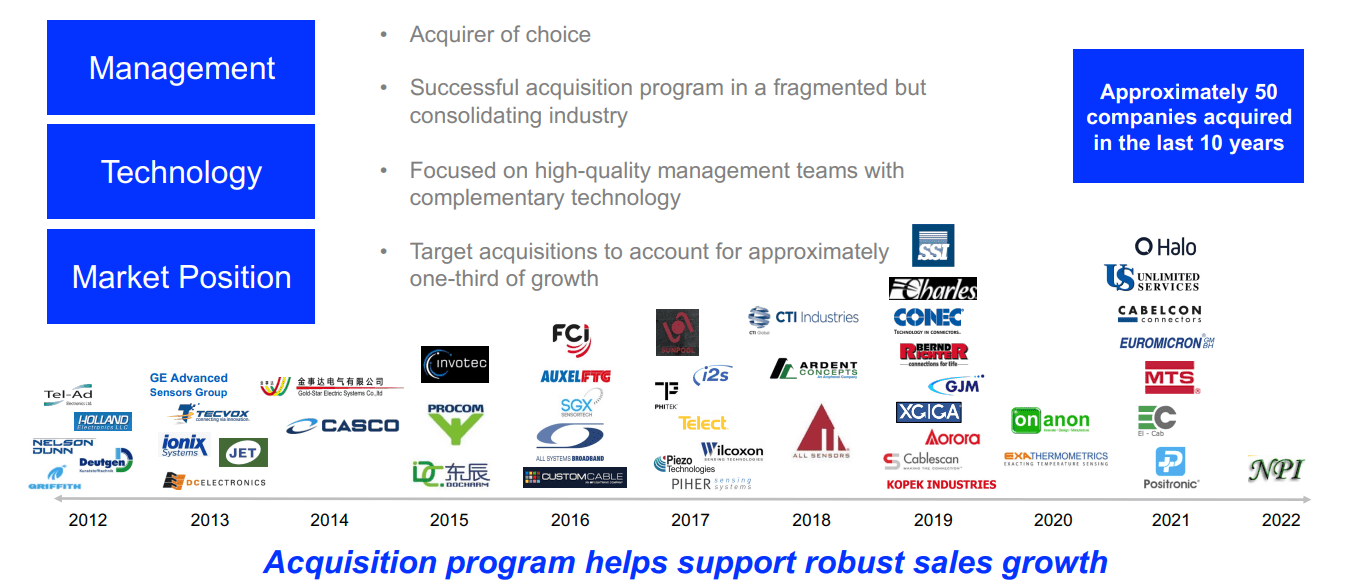
Amphenol does employ acquisitions with 50 being completed over the last decade and 7 in 2021. Amphenol tends to leave the businesses alone once they are acquired while integrating the raw material sourcing, lower cost manufacturing and sharing customer contacts.
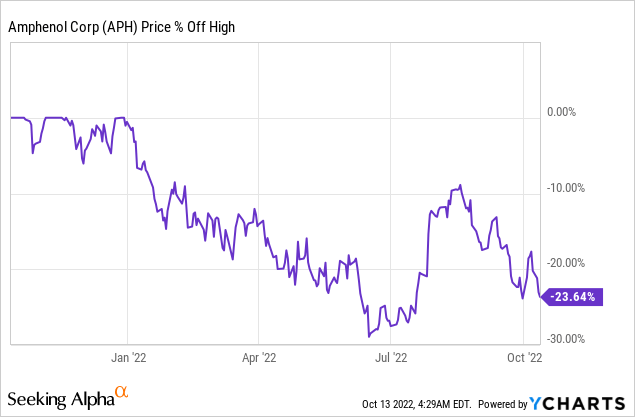
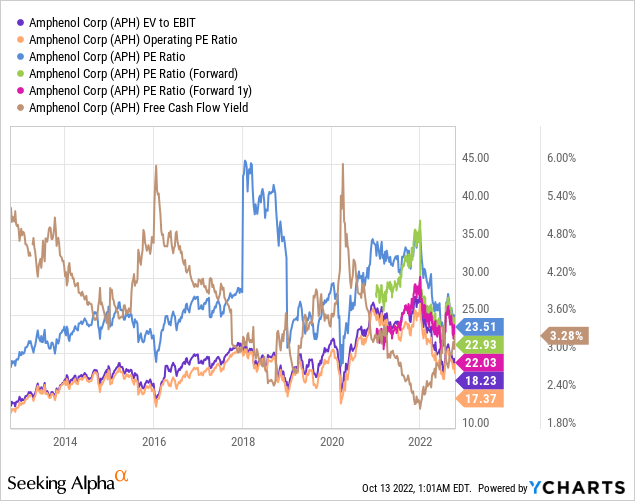
Amphenol’s share price has fallen over 23% from its high reached in late 2021, although it still sits about its June lows. That kind of decline in a quality business prompted me to take another look to see where the valuation stands.
Dividend History
When I first began investing in individual companies, the strategy that most appealed to me was dividend growth investing. As I’m still looking at an investment horizon that’s at least 30-40 years long I want to make sure that I’m adding businesses that have the ability to grow their dividend substantially over time.
Amphenol Dividend History (APH Investor Relations)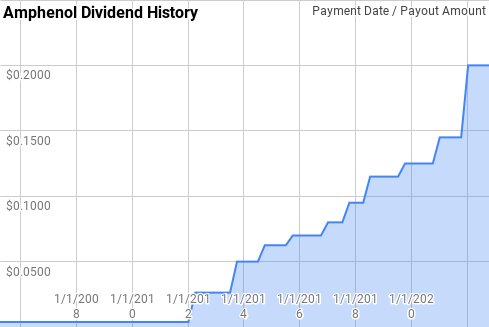
Amphenol initiated a dividend in 2005; however, they didn’t begin their streak of consistent annual raises until 2012 when dividend growth began in earnest. Since then they’ve given shareholders hefty dividend increases each year and have pushed their streak up to 11 years giving them the title of Dividend Contender.
Over that time Amphenol has given year over year dividend growth ranging from 8.3% to 47.4% with an average of 22.9% and a median of 20.7%, exclusive of 2012’s 592% increase.
Amphenol’s 3-year annualized dividend growth rates have come in between 13.0% to 36.1% with an average of 19.9% and a median of 18.3%.
Similarly, Amphenol has delivered rolling 5-year annualized dividend growth rates from 14.4% to 27.2% with an average of 19.7% and a median of 17.0%.
The rolling 1-, 3-, 5-, and 10-year annualized dividend growth rates from Amphenol since 2005 can be found in the following table.
| FY | Annual Dividend | 1 Year | 3 Year | 5 Year | 10 Year |
| 2005 | $0.015 | ||||
| 2006 | $0.015 | 0.0% | |||
| 2007 | $0.015 | 0.0% | |||
| 2008 | $0.015 | 0.0% | 0.0% | ||
| 2009 | $0.015 | 0.0% | 0.0% | ||
| 2010 | $0.015 | 0.0% | 0.0% | 0.0% | |
| 2011 | $0.015 | 0.0% | 0.0% | 0.0% | |
| 2012 | $0.105 | 592.1% | 90.6% | 47.2% | |
| 2013 | $0.153 | 45.1% | 115.7% | 58.6% | |
| 2014 | $0.225 | 47.4% | 145.5% | 71.4% | |
| 2015 | $0.265 | 17.8% | 36.1% | 77.1% | 33.1% |
| 2016 | $0.290 | 9.4% | 23.9% | 80.3% | 34.3% |
| 2017 | $0.350 | 20.7% | 15.9% | 27.2% | 36.8% |
| 2018 | $0.440 | 25.7% | 18.4% | 23.6% | 40.0% |
| 2019 | $0.480 | 9.1% | 18.3% | 16.4% | 41.2% |
| 2020 | $0.520 | 8.3% | 14.1% | 14.4% | 42.4% |
| 2021 | $0.635 | 22.1% | 13.0% | 17.0% | 45.2% |
Source: Author; Data Source: Amphenol Investor Relations
The payout ratio is a metric that dividend growth investors will track closely. All else being equal a lower payout ratio is preferred as there’s plenty of room for the inevitable fluctuations of the business to not jeopardize the dividend and there’s also the potential for faster dividend growth.
APH Dividend Payout Ratios (APH SEC filings)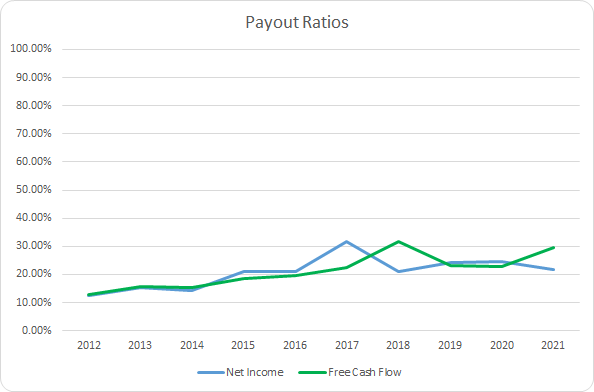
Amphenol’s payout ratio, both based on net income and free cash flow, has been on the rise over the last decade as management has made a firmer commitment to returning cash to shareholders. That being said neither metric show signs of concern at this time.
Amphenol’s net income payout ratio has averaged 20.7% over the last 10-years and 24.7% for the most recent 5-years. Similarly, the average free cash flow payout ratios are 21.1% and 25.8%, respectively.
Quantitative Quality
Over time it’s the quality of the business, and its ability to continue to grow and improve, that drives the returns that investors will ultimately earn. As such I examine a variety of financial metrics to try and get comfortable with the business from quality viewpoint.
APH Revenue Profits and Cash Flow (APH SEC filings)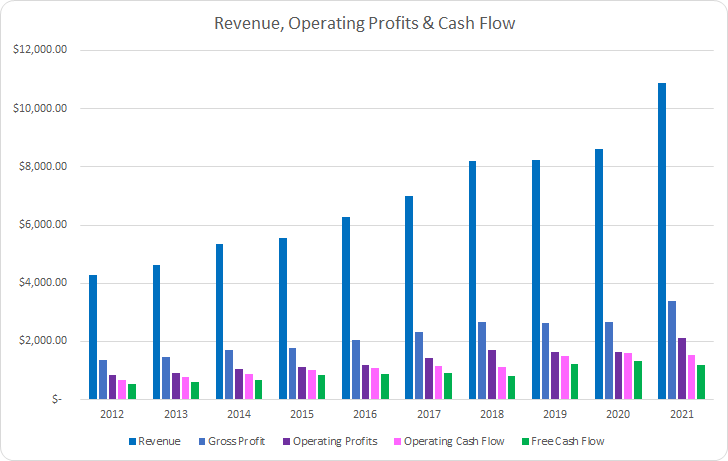
Amphenol has done an excellent job continuing to push their business forward. Through organic growth as well as steady dose of acquisitions, Amphenol’s revenue grew by 153.4% in total over the last decade or 10.9% annualized. Gross profits tracked right along with revenues.
Similarly, operating profits improved by 154.1% or 10.9% annualized. Although operating cash flow only rose 128.3% or 9.6% annualized. Surprisingly, free cash flow was the laggard rising just 116.2% or 8.9% annualized.
My expectation is that strong businesses will be able to maintain their margins over time and more than likely be able to improve them. I prefer to see a free cash flow margin greater than 10% and take that as a sign of a strong cash generator.
APH Margins (APH SEC filings)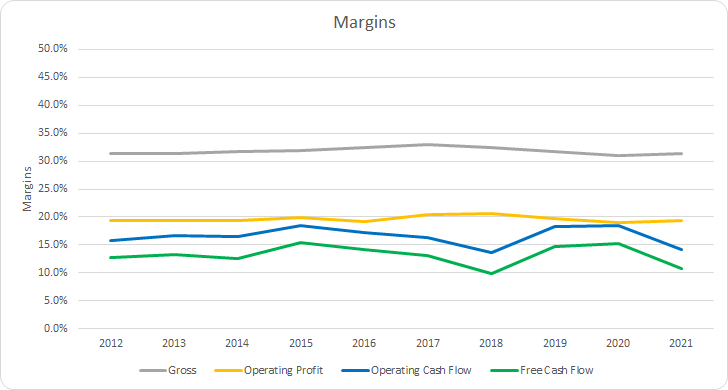
Amphenol’s gross margins have been remarkably consistent during the last decade. The 10-year average gross margin is 31.8% with the 5-year average coming to 31.9%.
Free cash flow margins for Amphenol have surpassed the 10% threshold in all but one year, 2018, over the last decade. The 10-year average free cash flow margin comes to 13.2% with the 5-year average sitting at 12.7%.
Another measure of profitability for a business is to see how efficient it is at generating free cash flow based on different capital measures. I prefer to see a free cash flow return on invested capital, FCF ROIC, greater than 10%.
APH Free Cash Flow Returns (APH SEC filings)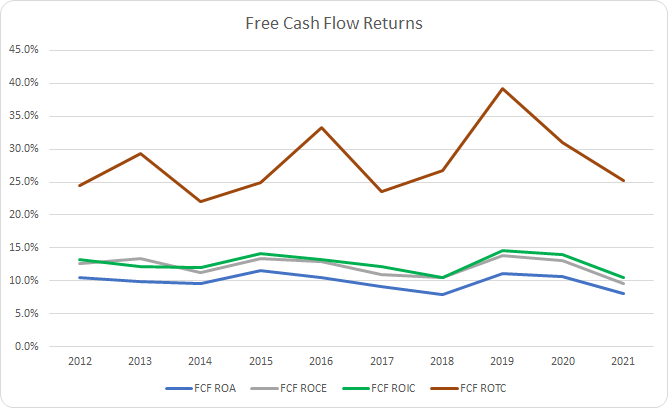
Amphenol has been able to maintain strong free cash flow returns with a FCF ROA averaging 9.9% for the last 10-years and 9.4% for the last 5-years. Amphenol’s FCF ROIC has surpassed the 10% threshold each year during that time. The 10-year average FCF ROIC comes to 12.7% with the 5-year average at 12.4%.
To understand how Amphenol uses its free cash flow I calculate three variations of the metric, defined below:
- Free Cash Flow, FCF: Operating cash flow less capital expenditures
- Free Cash Flow after Dividend, FCFaD: FCF less total cash dividend payments
- Free Cash Flow after Dividend and Buybacks, FCFaDB: FCFaD less net cash used on share repurchases
APH Free Cash Flows (APH SEC filings)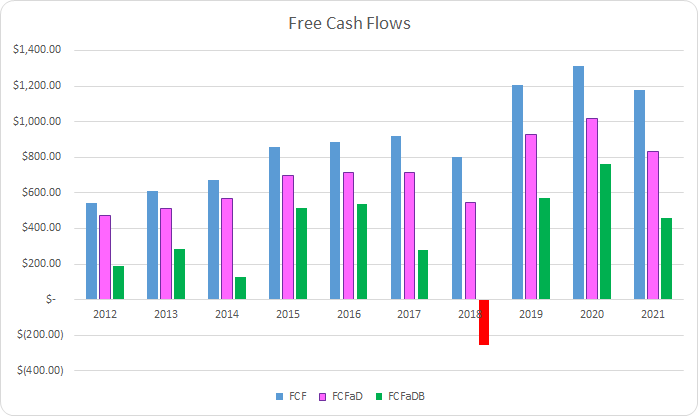
Amphenol has generated $9.0 B in total FCF over the last decade. With that FCF they have sent $2.0 B back to shareholders through rising dividend payments which brings the cumulative FCFaD for the last decade to $7.0 B. Additionally, Amphenol has spent a net total of $3.5 B on share repurchases. That puts the cumulative FCFaDB for the prior decade at $3.5 B.
Amphenol has preferred buybacks to dividends during that time. For every net $1.00 used on buybacks Amphenol has spent roughly $0.56 on dividends.
APH Shares Outstanding (APH SEC filings)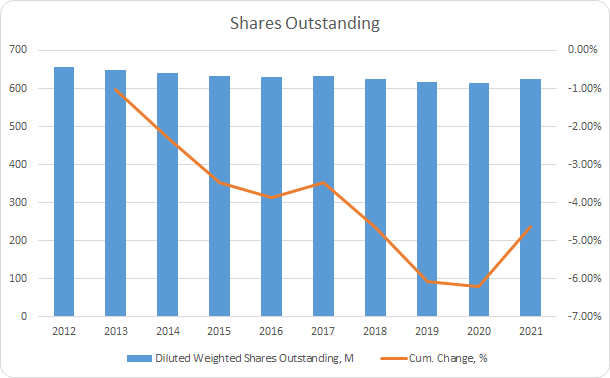
Despite spending $3.5 B on share repurchases between FY 2012 and FY 2021 Amphenol’s share count is only down 4.6%. That works out to a 0.5% annualized decline in shares. Part of that is due to the numerous acquisitions that Amphenol has made over that time. Prior to FY 2021’s increase the total decline was 6.2%.
My aim is to find a business that I’m comfortable owning for the long term. That means that the balance sheet becomes that much more important as I want my equity stake to avoid being at risk due to excessive leverage.
APH Debt to Capitalization (APH SEC filings)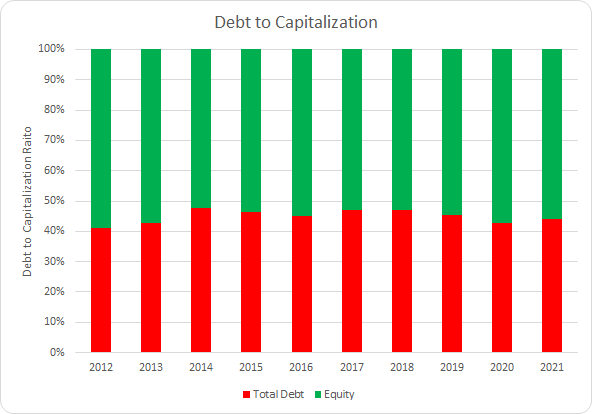
Amphenol has largely resisted the temptation to lever up over the prior decade at least from a capital structure standpoint. While total debt levels have risen by nearly 200% that’s come with a similar increase in equity. The 10-year and 5-year average debt-to-capitalization ratios for Amphenol both work out to 45%.
I place more emphasis on the net debt ratios in making the judgement call on whether the debt is burdensome. As we’ve seen this year so far, interest rates can in fact go above zero and being forced to refinance any near term debt payments at inopportune times could see large swings in your profits or cash flow.
APH Debt Ratios (APH SEC filings)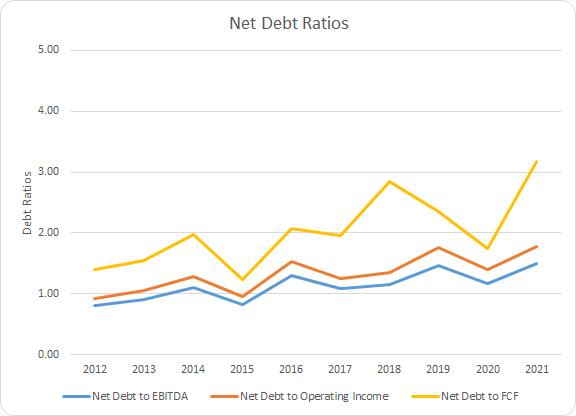
Amphenol’s 10-year average net debt-to-EBITDA, net debt-to-operating income, and net debt-to-FCF ratios are 1.1x, 1.3x, and 2.0x. The 5-year averages are 1.3x, 1.x, and 2.5x, respectively. In other words Amphenol’s debt load could be paid off entirely with
How Did We Get Here?
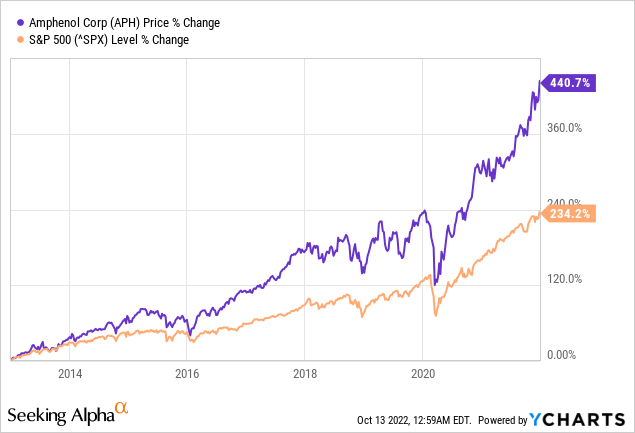
From December 31, 2012 through December 31, 2021 Amphenol’s shares gained 440.7% which handily beat the S&P 500’s 234.2% increase. Add in the 0.7% starting dividend yield and Amphenol has delivered an impressive 19.0% CAGR over that time.
Not all returns are created equally. Obviously the best type of returns are driven from a growing and improving business. I’ve begun trying to break down the returns into business performance, capital allocation, and sentiment change.
- Business Returns: Measured by revenue growth and change in net profit margin
- Capital Allocation Returns: Measured by dividend yield and annualized change in share count
- Sentiment Returns: Measured by the annualized change in starting and ending P/E multiples
As we saw earlier, Amphenol’s revenues improved by 153.4% in total or 10.9% annualized. Amphenol’s net profit margin improved by 13.1% over that same time or 1.4% annualized. That gives a business performance annualized return attribution of +12.0%.
Amphenol repurchased ~4.6% of their share count between the end of FY 2012 and FY 2021. That works out to a 0.5% annualized reduction. Combined with the initial dividend yield of 0.7% and Amphenol’s capital allocation annualized return attribution is +1.2%.
Lastly we come to the sentiment change returns. While they are a bonus and can provide excellent returns they are the least sustainable. Amphenol’s P/E multiple at the beginning of the period was 19.1x and by the end it had risen to 34.4x. That’s a total increase of 80.0% and puts the sentiment change return attribution at +5.9%.
| Annualized Returns | % of Returns | |
| Business Returns | 12.0% | 63% |
| Capital Allocation Returns | 1.2% | 6% |
| Sentiment Change | 5.9% | 31% |
| Total Annualized Returns | 19.0% |
Source: Author
Combined the business and capital allocation returns were 13.2% over that time and accounted for ~69% of the CAGR during that period.
APH Return Break Down (APH SEC filings)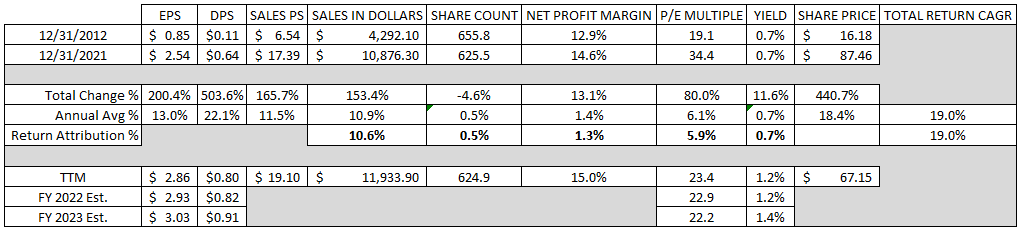
Valuation
Business quality and longevity is a much bigger determinant toward your returns than valuation. That being said valuation does play a role and one must make sure to not overpay for a potential asset. As such I use three valuation models to try and narrow down a range of fair value. The models that I use are dividend yield theory, a reverse discounted cash flow analysis, and a minimum acceptable rate of return, “MARR”, analysis.
Dividend yield theory is a valuation method predicated on the idea of reversion to the mean and that investors will collectively value a business such that it offers a normal dividend yield. For Amphenol I’ll use the 3-year average forward dividend yield as a proxy for fair value.
Amphenol Dividend Yield Theory (APH Investor Relations and Google Finance)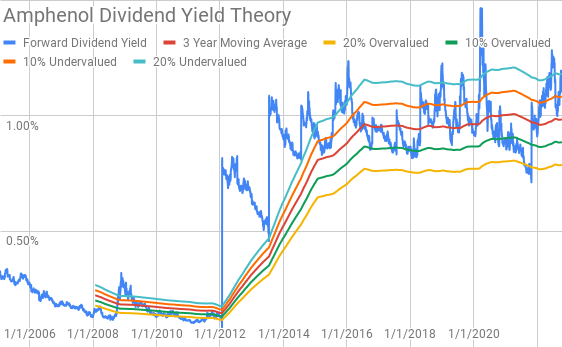
Since late 2013 Amphenol has regularly offered a forward dividend yield between approximately 0.8% and 1.1%. Currently Amphenol’s shares offer a yield of 1.19% compared to the 3-year average forward yield of 0.98%.
A reverse discounted cash flow analysis is a way to figure out what the current market valuation implies about expectations for the growth and margins of a business.
I use a simplified DCF model based on revenue growth, an initial free cash flow margin of 11.6% that improves to 14.0% during the forecast period and a terminal growth rate of 3.5%. For the discount rate I’ve used an after-tax cost of debt of 3.10% along with a cost of equity of 10% and 8%. That gives a discount rate of 9.3% for the 10% cost of equity scenario and 7.5% for the 8% cost of equity.
Under those assumptions with a 9.3% discount rate Amphenol would need to grow revenues 10.4% annually during the forecast period in order to generate the cash flows that would support the current market valuation. Based on the 8.0% return target, 7.5% discount rate, Amphenol’s required revenue growth comes to 4.6% annually during the forecast period.
A MARR analysis requires you to estimate the future earnings and dividends that a business will produce over a given period of time. Then you apply a reasonable, and hopefully conservative, multiple on those future earnings to determine what the share price would be at that future date. If the expected returns are greater than your hurdle rate for investment then you can feel free to invest in the business.
Analysts currently expect Amphenol to report FY 2022 EPS of $2.93 and FY 2023 EPS of $3.03. They also expect Amphenol to be able to grow EPS at an 8.5% annual rate over the next 5 years. I then assumed that EPS growth would slow to 5.0% annually for the following 5 years. Dividends are assumed to target a 30% payout ratio.
Over the last 10 years Amphenol has typically been valued between ~17.5x TTM EPS and 30.0x TTM EPS. For the MARR analysis I’ll examine terminal multiples spanning that range.
The following table shows the potential internal rates of return that Amphenol could potentially provide investors if the assumptions laid out above prove out. Returns assume that Amphenol will pay and increase dividends along the timeline they have usually followed and that all dividends are taken in cash. Returns also assume shares are purchased for $67.15, Wednesday’s closing price.
| IRR | ||
| P/E Level | 5 Year | 10 Year |
| 30 | 13.4% | 9.9% |
| 25 | 9.6% | 8.1% |
| 22.5 | 7.5% | 7.0% |
| 20 | 5.2% | 5.9% |
| 17.5 | 2.7% | 4.6% |
| 15 | -0.2% | 3.2% |
Source: Author
Alternatively I use the MARR analysis framework to work backwards to determine what price I could pay for shares today in order to generate the returns that I desire from my investments. My base hurdle rate is a 10% IRR and for Amphenol I’ll also examine 8% and 12% return thresholds.
| Purchase Price Targets | ||||||
| 10% Return Target | 12% Return Target | 8% Return Target | ||||
| P/E Level | 5 Year | 10 Year | 5 Year | 10 Year | 5 Year | 10 Year |
| 30 | $80 | $68 | $73 | $57 | $87 | $80 |
| 25 | $67 | $58 | $62 | $49 | $74 | $68 |
| 22.5 | $61 | $53 | $56 | $45 | $67 | $62 |
| 20 | $55 | $48 | $50 | $40 | $60 | $56 |
| 17.5 | $48 | $43 | $44 | $36 | $53 | $51 |
| 15 | $42 | $38 | $39 | $32 | $46 | $45 |
Source: Author
Conclusion
Amphenol is a fantastic business that has rewarded shareholders over the years. Amphenol been able to grow both organically and via acquisitions. They produce relatively cheap connections and sensors that enable their customers to provide the services and products that we use everyday. Amphenol has been able to maintain solid margins over time with free cash flow margins in the 10-15% range.
Dividend yield theory suggests that Amphenol is undervalued with a fair value range between $74 and $91. Amphenol is also due to announce a dividend increase later this month. My expectation is for a raise to $0.22 per share per quarter which would increase the fair value range to $81 to $100.
The reverse DCF model shows that Amphenol is likely overvalued as the required revenue growth of 10.4% annualized for the next decade is quite ambitious. While that’s within the range of potential outcomes for Amphenol it doesn’t leave any margin for error. However, 8% returns do seem readily achievable as the required growth is just 4.6%.
The MARR analysis suggests a fair value range between $55 and $67 based on a 10% IRR target 5 years out and a terminal P/E between 20x and 25x. With an 8% return target the fair value range rises to $60 to $74 while the 12% return target lowers the range to $50 to $62.
Of the three valuation models dividend yield theory is the only one that suggests that Amphenol is likely undervalued. The MARR analysis seems to show that Amphenol is trading on the upper end of fair value; however, it offers no margin of safety. Meanwhile the reverse DCF shows that Amphenol is likely overvalued.
Amphenol has a strong balance sheet that should provide them the opportunity to continue to make strategic acquisitions. Acquisitions will continue to be a driver of growth with acquisitions expected to account for roughly 1/3 of future growth.
Amphenol is a fantastic business and one that I knowingly paid up for earlier this year. While Amphenol wasn’t exactly cheap, and still doesn’t appear so, I know myself enough that if I already own a position I’m much more likely to be aware of significant drops in the share price to more attractive levels.
If Amphenol’s share price continues to drop I would become much more interested in adding to my position. Currently I would target adding shares around the $60 level but would prefer to see the mid-$50s or lower.
Be the first to comment