

Wolterk/iStock Editorial via Getty Images
This article was coproduced with Dividend Sensei.
Investor sentiment is pretty poor right now. In fact, Bank of America’s sentiment index recently hit 0.0, a level only seen in the Pandemic Crash and the Great Recession.
I understand why so many investors are terrified. After all, 76% of CEOs expect a mild recession in 2023, and 66% of CFOs do as well.
There are just two certainties on Wall Street, diversification and prudent risk management, and stock go up over the long-term.
Unless you think the global economy will collapse forever, this bear market is a wonderful long-term buying opportunity for smart dividend investors.
Warren Buffett has said,
“Your premium brand had better be delivering something special, or it’s not going to get the business.”
What does Buffett mean when he refers to a product as “premium”?
Does it mean that the “premium brand” refers to an increased price investors are willing to pay because the company supports robust and sustainable economic profits?
As Heather Brilliant and Elizabeth Collins (co-authors of Why Moats Matter) explain,
A moat worthy brand manifests itself as pricing power or repeat business that translates into sustainable economic profits.”
And that’s why I plan to add Ameriprise Financial, Inc. (NYSE:AMP) to my retirement portfolio, recognizing this blue-chip has a “wide moat” recipe to deliver something very special.
Let me show you the four reasons why Ameriprise just earned a spot in my retirement portfolio, and you might want to add it to yours as well.
Reason One: Ameriprise Is The Complete Package
Here is the bottom line up front on AMP.
Reasons To Potentially Buy AMP Today
-
89% quality low-risk 13/13 Ultra SWAN asset manager
-
80th highest quality company on the Master List (84th percentile)
-
94% dividend safety score
-
16-year dividend growth streak (every year since it began paying one)
-
2.0% very safe yield
-
0.5% average recession dividend cut risk
-
1.3% severe recession dividend cut risk
-
31% conservatively undervalued (potential very strong buy)
-
Fair Value: $358.95 (13.1X earnings)
-
9.0X forward earnings vs 12.75X to 13.5X historical
-
7.0X cash-adjusted earnings – anti-bubble blue-chip
-
A- stable outlook credit rating = 2.5% 30-year bankruptcy risk
-
63rd industry percentile risk management consensus = Above-Average
-
6% to 15% CAGR margin-of-error growth consensus range
-
13.6% CAGR median growth consensus
-
5-year consensus total return potential: 15% to 22% CAGR
-
base-case 5-year consensus return potential: 19% CAGR (2.5X S&P consensus)
-
consensus 12-month total return forecast: 35% (12.0 PE)
-
Fundamentally Justified 12-Month Returns: 47% CAGR
AMP is in a 28% bear market created by broader market sentiment and rising fears of a recession.
AMP Long-Term Growth Outlook Is Intact
|
Metric |
2021 Growth |
2022 Growth Consensus |
2023 Growth Consensus |
2024 Growth Consensus |
|
Sales |
21% |
9% |
9% |
5% |
|
Dividend |
16% |
11% |
7% |
10% (18-Year Growth Streak) |
|
EPS |
62% |
10% |
16% |
12% |
|
Operating Cash Flow |
-18% |
-6% |
12% |
NA |
|
EBITDA |
74% |
-1% |
7% |
11% |
|
EBIT (operating income) |
79% |
-6% |
6% |
14% |
|
Book Value |
14% |
8% |
18% |
21% |
(Source: FAST Graphs, FactSet)
Analysts aren’t yet forecasting a recession for AMP though in the pandemic earnings decline a peak of 13%.
Rolling Returns Since October 2005
AMP is a consistent market beater with average 15-year rolling returns of 14%, or 40% more than the S&P 500. From bear market lows it’s delivered returns as high as 26% annually for the next 10 years and 15% annually for the next 15 years.
-
8.3X return in 15 years
-
10.4X return in 10 years (post GFC)
AMP 2024 Consensus Total Return Potential
FAST Graphs FAST Graphs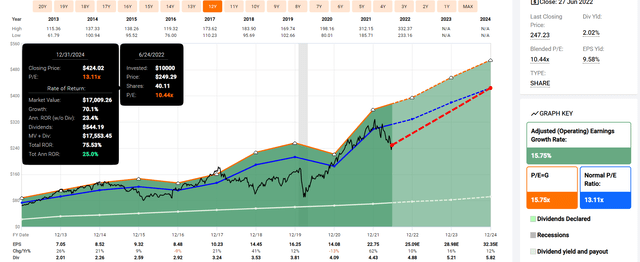
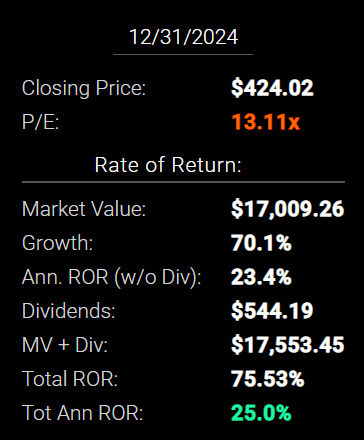
If AMP grows as analysts expect by 2024 and returns to historical mid-range fair value, it could deliver 76% total returns or 25% annually.
-
Buffett-like returns from a blue-chip bargain hiding in plain sight
AMP 2027 Consensus Total Return Potential
FAST Graphs FAST Graphs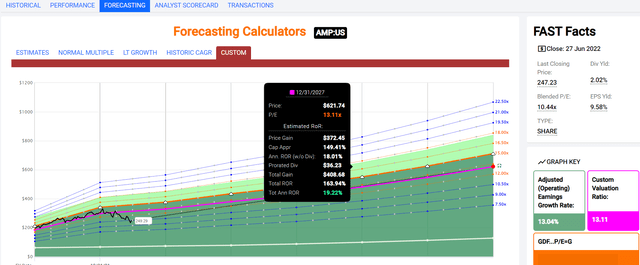
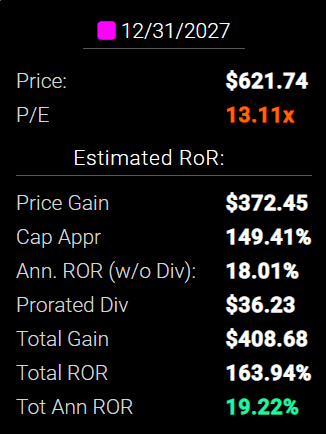
By 2027, if AMP grows as expected and returns to historical mid-range fair value, it could deliver 164% total returns or 19% annually.
-
about 2.5X the S&P 500 consensus
-
Buffett-like return potential
AMP Long-Term Consensus Total Return Potential
|
Investment Strategy |
Yield |
LT Consensus Growth |
LT Consensus Total Return Potential |
Long-Term Risk-Adjusted Expected Return |
Long-Term Inflation And Risk-Adjusted Expected Returns |
Years To Double Your Inflation & Risk-Adjusted Wealth |
10-Year Inflation And Risk-Adjusted Expected Return |
|
Ameriprise Financial |
2.0% |
13.6% |
15.6% |
10.9% |
8.5% |
8.5 |
2.25 |
|
Dividend Growth |
2.0% |
11.5% |
13.5% |
9.5% |
7.0% |
10.3 |
1.96 |
|
Dividend Aristocrats |
2.4% |
8.5% |
10.9% |
7.6% |
5.2% |
14.0 |
1.65 |
|
REITs |
3.0% |
7.8% |
10.8% |
7.6% |
5.1% |
14.1 |
1.64 |
|
S&P 500 |
1.8% |
8.5% |
10.3% |
7.2% |
4.7% |
15.2 |
1.59 |
(Sources: Morningstar, FactSet, YCharts)
-
analysts expect AMP to deliver 15.6% long-term returns, similar to what it’s done historically
-
more than most popular growth strategies including the dividend aristocrats and S&P 500
AMP Total Returns Since October 2005
AMP’s historical 14.6% CAGR total return includes the current 28% bear market.
-
9.8X return since 2005
-
6.7X adjusted for inflation
-
more than 2X more than the S&P 500
A Dividend Growth Blue-Chip You Can Trust
|
Portfolio |
2006 Income Per $1,000 Investment |
2022 Income Per $1,000 Investment |
Annual Income Growth |
Starting Yield |
2022 Yield On Cost |
|
S&P 500 |
$19 |
$71 |
8.59% |
1.9% |
7.1% |
|
Ameriprise Financial |
$12 |
$188 |
18.76% |
1.2% |
18.8% |
(Source: Portfolio Visualizer Premium)
AMP’s dividend income has grown by almost 19% annually over the last 16 years, 2.5X faster than the S&P 500.
Its 1.2% yield in 2006 has become an 18.8% yield on cost.
What about the future?
|
Analyst Consensus Income Growth Forecast |
Risk-Adjusted Expected Income Growth |
Risk And Tax-Adjusted Expected Income Growth |
Risk, Inflation, And Tax Adjusted Income Growth Consensus |
|
20.1% |
14.0% |
11.9% |
9.4% |
(Source: DK Research Terminal, FactSet)
Analysts expect 20% income growth from AMP in the future, which adjusted for the risk of it not growing as expected, inflation, and taxes is about 9.4% real expected income growth.
Now compare that to what they expect from the S&P 500.
|
Time Frame |
S&P Inflation-Adjusted Dividend Growth |
S&P Inflation-Adjusted Earnings Growth |
|
1871-2021 |
1.6% |
2.1% |
|
1945-2021 |
2.4% |
3.5% |
|
1981-2021 (Modern Falling Rate Era) |
2.8% |
3.8% |
|
2008-2021 (Modern Low Rate Era) |
3.5% |
6.2% |
|
FactSet Future Consensus |
2.0% |
5.2% |
(Sources: S&P, FactSet, Multipl.com)
What about a 60/40 retirement portfolio?
-
0.5% consensus inflation, risk, and tax-adjusted income growth.
In other words, AMP is expected to generate 4.5X faster real income growth than the S&P 500 and 19X faster income growth than a 60/40.
-
with incredible short, medium-term, and long-term return potential.
What inflation-adjusted returns do analysts expect in the future?
Inflation-Adjusted Consensus Return Potential: $1,000 Initial Investment
|
Time Frame (Years) |
7.6% CAGR Inflation-Adjusted S&P Consensus |
8.4% Inflation-Adjusted Aristocrats Consensus |
13.1% CAGR Inflation-Adjusted AMP Consensus |
Difference Between Inflation-Adjusted AMP Consensus Vs S&P Consensus |
|
5 |
$1,445.67 |
$1,493.29 |
$1,853.06 |
$407.38 |
|
10 |
$2,089.97 |
$2,229.92 |
$3,433.82 |
$1,343.85 |
|
15 |
$3,021.42 |
$3,329.92 |
$6,363.07 |
$3,341.66 |
|
20 |
$4,367.98 |
$4,972.54 |
$11,791.14 |
$7,423.16 |
|
25 |
$6,314.67 |
$7,425.45 |
$21,849.66 |
$15,534.99 |
|
30 |
$9,128.95 |
$11,088.36 |
$40,488.68 |
$31,359.73 |
(Source: DK Research Terminal, FactSet)
Analysts expect AMP to continue growing at its historical rate which could mean 6.4X inflation-adjusted returns over the next 15 years.
|
Time Frame (Years) |
Ratio Aristocrats/S&P Consensus |
Ratio Inflation-Adjusted AMP Consensus vs S&P consensus |
|
5 |
1.03 |
1.28 |
|
10 |
1.07 |
1.64 |
|
15 |
1.10 |
2.11 |
|
20 |
1.14 |
2.70 |
|
25 |
1.18 |
3.46 |
|
30 |
1.21 |
4.44 |
(Source: DK Research Terminal, FactSet)
Which is potentially 2X more than the S&P 500 and dividend aristocrats
AMP Investment Decision Score
Dividend Kings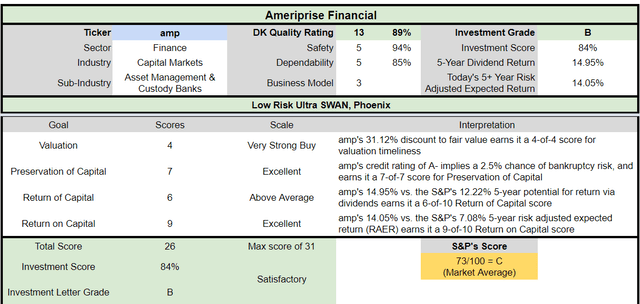
For anyone comfortable with its risk profile, AMP is a potentially reasonable and prudent fast-growing Ultra SWAN dividend growth choice.
-
31% discount vs 3% market discount = 28% better valuation
-
2.0% yield vs 1.7% yield (and a much safer yield at that)
-
potentially 55% higher long-term return potential than S&P 500 overtime
-
about 2X better risk-adjusted expected return over the next five years
Reason Two: One Of The Best Companies On Earth
There are many ways to measure safety and quality and I factor in pretty much all of them.
The Dividend Kings’ overall quality scores are based on a 253-point model that includes:
-
Dividend safety
-
Balance sheet strength
-
Credit ratings
-
Credit default swap medium-term bankruptcy risk data
-
Short and long-term bankruptcy risk
-
Accounting and corporate fraud risk
-
Profitability and business model
-
Growth consensus estimates
-
Management growth guidance
-
Historical earnings growth rates
-
Historical cash flow growth rates
-
Historical dividend growth rates
-
Historical sales growth rates
-
Cost of capital
-
GF Scores
-
Long-term risk-management scores from MSCI, Morningstar, FactSet, S&P, Reuters’/Refinitiv, and Just Capital
-
Management quality
-
Dividend-friendly corporate culture/income dependability
-
Long-term total returns (a Ben Graham sign of quality)
-
Analyst consensus long-term return potential
In fact, it includes over 1,000 fundamental metrics including the 12 rating agencies we use to assess fundamental risk.
-
credit and risk management ratings make up 41% of the DK safety and quality model
-
dividend/balance sheet/risk ratings make up 82% of the DK safety and quality model
How do we know that our safety and quality model works well?
During the two worst recessions in 75 years, our safety model 87% of blue-chip dividend cuts, the ultimate baptism by fire for any dividend safety model.
How does AMP score on our comprehensive safety and quality models?
AMP Dividend Safety
|
Rating |
Dividend Kings Safety Score (162 Point Safety Model) |
Approximate Dividend Cut Risk (Average Recession) |
Approximate Dividend Cut Risk In Pandemic Level Recession |
|
1 – unsafe |
0% to 20% |
over 4% |
16+% |
|
2- below average |
21% to 40% |
over 2% |
8% to 16% |
|
3 – average |
41% to 60% |
2% |
4% to 8% |
|
4 – safe |
61% to 80% |
1% |
2% to 4% |
|
5- very safe |
81% to 100% |
0.5% |
1% to 2% |
|
AMP |
94% |
0.5% |
1.3% |
|
Risk Rating |
Low-Risk (63rd industry percentile risk-management consensus) |
A- Stable outlook credit rating 2.5% 30-year bankruptcy risk |
7.5% OR LESS Max Risk Cap Recommendation |
Long-Term Dependability
|
Company |
DK Long-Term Dependability Score |
Interpretation |
Points |
|
Non-Dependable Companies |
21% or below |
Poor Dependability |
1 |
|
Low Dependability Companies |
22% to 60% |
Below-Average Dependability |
2 |
|
S&P 500/Industry Average |
61% (61% to 70% range) |
Average Dependability |
3 |
|
Above-Average |
71% to 80% |
Very Dependable |
4 |
|
Very Good |
81% or higher |
Exceptional Dependability |
5 |
|
AMP |
85% |
Exceptional Dependability |
5 |
Overall Quality
|
AMP |
Final Score |
Rating |
|
Safety |
94% |
5/5 very safe |
|
Business Model |
80% |
3/3 wide and stable moat |
|
Dependability |
85% |
5/5 exceptional |
|
Total |
89% |
13/13 Ultra SWAN |
|
Risk Rating |
3/3 Low-Risk |
|
|
20% OR LESS Max Risk Cap Rec |
5% Margin of Safety For A Potentially Good Buy |
AMP is the 80th highest quality company on the Masterlist.
How significant is this? The DK 500 Master List is one of the world’s best watchlists including
-
every dividend aristocrat (S&P companies with 25+ year dividend growth streaks)
-
every dividend champion (every company, including foreign, with 25+ year dividend growth streaks)
-
every dividend king (every company with 50+ year dividend growth streaks)
-
every foreign aristocrat (every company with 20+ year dividend growth streaks)
-
40 of the world’s best growth stocks
In other words, even among the world’s best companies, AMP is higher quality than 84% of them.
Why I Trust Ameriprise And So Can You
Ameriprise traces its roots back to 1894, with its founding in Minneapolis, Minnesota.
It was acquired by American Express and spun out in 2005.
Over its 128-year history AMP has survived and thrived through:
-
20 recessions
-
five depressions
-
two world wars
-
a pandemic that wiped out 5% of humanity in 1918
-
the Great Depression
-
the cold war
-
inflation as high as 20%
-
interest rates as high as 20%
-
10-year US treasury yields as high as 16%
-
over two dozen major bear markets
-
85 corrections
-
256 market pullbacks
In other words, AMP is built to last and will likely outlive us all.
-
a potential buy and hold forever Ultra SWAN
Business Description Summary
“Spun off from American Express in 2005, Ameriprise Financial has emerged as a major player in the U.S. market for asset and wealth management, with around $1.4 trillion in total assets under management and advisement at the end of 2021.
Ameriprise has one of the largest branded advisor networks in the industry, and about 80% of the company’s revenue comes from its asset and wealth management segments.
Ameriprise has reduced its exposure to insurance with the sale of its auto and home insurance business in 2019 and discontinued the sale of its proprietary fixed annuities in 2020. Around 90% of the company’s pretax earnings are from the United States.” – Morningstar
Investment Thesis Summary
“Ameriprise Financial has transformed itself into a financial powerhouse, with $1.4 trillion in total assets under management and advisement and around 10,000 financial advisors at the end of 2021. The firm continues to shift away from insurance and to place more emphasis on asset and wealth management operations.
In 2019, the company closed the sale of its auto and home insurance business, and in 2020 it discontinued the sale of its proprietary fixed annuities. Columbia Threadneedle Investments, the firm’s global asset-management business, turned Ameriprise into a contender in the global asset management industry…
… The company doesn’t have significant property and casualty tail-risk exposure. Many life insurance companies also significantly “de-risked” after the global financial crisis and became more conservative with their guaranteed benefit contracts, so we expect Ameriprise to navigate through rough economic environments relatively well.
In addition to returning most of its operating earnings to shareholders with dividends and share repurchases, the company is funding incremental growth investments. Ameriprise recently increased its presence in investment management with the acquisition of Bank of Montreal’s EMEA asset management business, which increased assets under management by roughly 20% to around $750 billion.
Ameriprise is also using its capital to support the growth of its bank. Wealth management firms have been able to increase their profits by housing client cash as deposits in their banks and offering loan products, such as securities-based loans..” – Morningstar
AMP’s new banking division is expected to generate significant earnings until 2023 but represents how the company continues to evolve and adapt just as it has for nearly 130 years.
AMP’s wide moat (profitability in the top 20% of peers historically) is driven by the trust they’ve built with clients over nearly 130 years.
-
not a stockbroker, but a generation wealth manager
-
rich people trust AMP and keep their money with them forever
-
creating a less cyclical stream of fee income
AMP has 10,149 advisors, in the top five of its industry.
-
90% fee-based revenue (fiduciaries)
-
$810,000 in TTM revenue per advisor
AMP has won numerous accolades over the years including being the most trusted wealth manager in America in Investor Business Daily’s annual survey.
-
their moat is based on trust and reputation that is built over 128 years
AMP’s total addressable market (all US-focused) was $65.7 trillion in May of 2022.
-
including $10 trillion wiped out in this bear market so far
It’s an industry growing at 4% to 6% per year, and AMP has been gaining market share.
-
8.5% sales growth since 2005 means AMP is growing the top line about 50% faster than its industry
AMP is targeting those with $500K to $5 million in wealth, with 45% of customers being Millennials and Gen-Zers.
-
150 million of those = 2X more than baby boomers
By focusing on a comprehensive client experience, AMP is able to generate 7.4X greater net inflows than its peers.
-
Ameriprise Bank is up to $13 billion in deposits and counting
-
helping AMP become a one-stop-shop for all wealth management needs
AMP’s margins have been expanding in a world of ever-shrinking management fees because of its steadily growing economies of scale and strong and effective cost management culture.
AMP has industry-leading operating margins in its fund business, nearly as good as BlackRock’s (a company with almost 10X the assets under management).
AMP was booming during the pandemic with client inflows soaring 43% and revenue per advisor growing 20%.
Its retirement protection services unit (basically hedging against volatile financial markets) has been growing like a weed, with 32% annual dividend growth back to the company over the last five years.
-
97% effective at hedging macro risks
-
620% capital reserves, over 6X the regulatory minimum
-
10X less value at risk than its peers
AMP is also great at running mutual funds.
-
129 4 and 5-star rated funds according to Morningstar
89% of its mutual funds have outperformed their peers or benchmarks over the last 10 years.
AMP is diversifying its fund offerings into all the hottest trends while delivering superior results.
-
ESG funds (10% of all global assets and growing)
-
direct real estate investments
-
private equity
-
alternatives such as long/short (hedge funds)
It’s opened 20 offices in global financial hubs in Europe and Asia, to ensure its product offerings have “boots on the ground” expertise.
Quantitative Analysis: The Math Backing Up The Investment Thesis
Ben Graham recommended combining qualitative (the story) analysis with quantitative analysis looking at the past, present, and likely future.
AMP Credit Ratings
|
Rating Agency |
Credit Rating |
30-Year Default/Bankruptcy Risk |
Chance of Losing 100% Of Your Investment 1 In |
|
S&P |
A- Stable Outlook |
2.50% |
40.0 |
|
Fitch |
A- Stable Outlook |
2.50% |
40.0 |
|
Moody’s |
A3 (A- equivalent) Stable Outlook |
2.50% |
40.0 |
|
AM Best |
A- Stable Outlook |
2.50% |
40.0 |
|
Consensus |
A- Stable Outlook |
2.50% |
40.0 |
(Source: S&P, Fitch, Moody’s, AM Best)
Four rating agencies consider AMP an A-rated company with a 2.5% fundamental risk and a 1 in 40 chance of investors losing all their money over the next 30 years.
AMP Leverage Consensus Forecast
|
Year |
Net Debt/EBITDA (1.5 Or Less Safe According To Credit Rating Agencies) |
Interest Coverage (10+ Safe) |
|
2020 |
0.26 |
18.59 |
|
2021 |
0.01 |
29.41 |
|
2022 |
-0.22 |
29.50 |
|
2023 |
-0.41 |
32.62 |
|
2024 |
-0.56 |
34.85 |
|
Annualized Change |
NA |
17.02% |
(Source: FactSet Research Terminal)
AMP is expected to have more cash than debt by the end of this year and its net cash position is expected to grow steadily in the coming years.
AMP Balance Sheet Consensus Forecast
|
Year |
Net Debt (Millions) |
Interest Cost (Millions) |
EBITDA (Millions) |
Operating Income (Millions) |
|
2020 |
$727 |
$114 |
$2,750 |
$2,119 |
|
2021 |
$36 |
$103 |
$3,416 |
$3,029 |
|
2022 |
-$824 |
$108 |
$3,757 |
$3,186 |
|
2023 |
-$1,682 |
$108 |
$4,081 |
$3,523 |
|
2024 |
-$2,451 |
$114 |
$4,368 |
$3,973 |
|
Annualized Growth |
NA |
0.00% |
12.26% |
17.02% |
(Source: FactSet Research Terminal)
AMP’s cash flows are growing at double-digit rates while its net cash position is growing rapidly.
AMP Bond Profile
-
$7.7 billion in liquidity
-
mostly short-term debt maturing by 2026
AMP GF Score: The Newest Addition To The DK Safety And Quality Model
The GF Score is a ranking system that has been found to be closely correlated to the long-term performances of stocks by backtesting from 2006 to 2021.” – GuruFocus
GF Score takes five key aspects into consideration. They are:
-
Financial Strength
-
Profitability
-
Growth
-
Valuation
-
Momentum
AMP’s excellent score of 90/100 confirms its industry-leading fundamental quality.
AMP Profitability: Wall Street’s Favorite Quality Proxy
AMP’s historical profitability is in the top 20% of its peers
-
a wide moat asset manager
Over the last 16 years, AMP’s profitability has been relatively stable adjusting for the natural cyclicality of its industry.
-
confirming a wide and stable moat
-
FCF margin is similar to Apple’s (AAPL)
AMP Profit Margin Consensus Forecast
|
Year |
EBITDA Margin |
EBIT (Operating) Margin |
Net Margin |
|
2020 |
23.0% |
17.7% |
42.5% |
|
2021 |
25.0% |
22.2% |
43.4% |
|
2022 |
25.4% |
21.6% |
41.7% |
|
2023 |
25.8% |
22.3% |
40.4% |
|
2024 |
25.9% |
23.5% |
39.1% |
|
Annualized Growth |
2.99% |
7.35% |
-2.12% |
|
Annualized Growth (Post Pandemic) |
1.10% |
1.96% |
-3.45% |
(Source: FactSet Research Terminal)
AMP’s margins are expected to remain relatively stable over time.
-
a bit of net margin compression due to the new investments in banking
-
and higher wage costs
Reason Three: Strong Growth Prospects For Decades To Come
Based on its PE ratio you might expect AMP to be a struggling or even dying company. Here’s what analysts actually expect.
AMP Medium-Term Growth Consensus Forecast
|
Year |
Sales |
EBITDA |
EBIT (Operating Income) |
Net Income |
|
2020 |
$11,958 |
$2,750 |
$2,119 |
$5,088 |
|
2021 |
$13,643 |
$3,416 |
$3,029 |
$5,921 |
|
2022 |
$14,778 |
$3,757 |
$3,186 |
$6,161 |
|
2023 |
$15,799 |
$4,081 |
$3,523 |
$6,386 |
|
2024 |
$16,881 |
$4,368 |
$3,973 |
$6,594 |
|
Annualized Growth |
9.00% |
12.26% |
17.02% |
6.70% |
|
Annualized Growth (Post Pandemic) |
7.36% |
8.54% |
9.46% |
3.65% |
|
Cumulative Over The Next 3 Years |
$47,458 |
$12,206 |
$10,682 |
$19,141 |
(Source: FactSet Research Terminal)
AMP is expected to grow at a steady rate in the coming years, delivering operating income growth of almost 10% outside of the Pandemic and generate almost $20 billion in cumulative profit over the next three years.
AMP Dividend Growth Consensus Forecast
|
Year |
Dividend Consensus |
EPS Consensus |
EPS Payout Ratio |
Retained (Post-Dividend) Earnings |
Buyback Potential |
|
2022 |
$4.85 |
$25.14 |
19.3% |
$2,232 |
8.21% |
|
2023 |
$5.19 |
$29.62 |
17.5% |
$2,687 |
9.89% |
|
2024 |
$5.73 |
$32.70 |
17.5% |
$2,967 |
10.92% |
|
Total 2022 Through 2024 |
$15.77 |
$87.46 |
18.0% |
$7,885.90 |
29.02% |
|
Annualized Rate |
8.69% |
14.05% |
-4.70% |
15.29% |
15.29% |
(Source: FactSet Research Terminal)
Rating agencies consider a 50% payout ratio safe for this industry and AMP’s is 19% and expected to fall to 17.5% by next year.
$8 billion in post-dividend retained earnings over the next three years could buy back up to 29% of shares at current valuations.
AMP Buyback Consensus Forecast
|
Year |
Consensus Buybacks ($ Millions) |
% Of Shares (At Current Valuations) |
Market Cap |
|
2022 |
$2,037.0 |
7.5% |
$27,172 |
|
2023 |
$2,315.0 |
8.5% |
$27,172 |
|
2024 |
$2,700.0 |
9.9% |
$27,172 |
|
Total 2022-2024 |
$7,052.00 |
26.0% |
$27,172 |
|
Annualized Rate |
9.55% |
Average Annual Buybacks |
$2,350.67 |
(Source: FactSet Research Terminal)
Analysts expect AMP to average $2.35 billion in annual buybacks through 2024 or $7 billion in total, or 26% of shares at current valuations.
-
almost 10% potential buyback-driven growth at current prices
Since it began its modern buy-back program in 2012 AMP has bought back almost 50% of its shares.
|
Time Frame (Years) |
Net Buyback Rate |
Shares Remaining |
Net Shares Repurchased |
Each Share You Own Is Worth X Times More (Not Including Future Growth And Dividends) |
|
5 |
6.3% |
72.11% |
27.89% |
1.39 |
|
10 |
6.3% |
52.00% |
48.00% |
1.92 |
|
15 |
6.3% |
37.50% |
62.50% |
2.67 |
|
20 |
6.3% |
27.04% |
72.96% |
3.70 |
|
25 |
6.3% |
19.50% |
80.50% |
5.13 |
|
30 |
6.3% |
14.06% |
85.94% |
7.11 |
(Source: DK Research Terminal, YCharts)
If AMP continues with its historical buyback rate over the next 30 years, it could repurchase 86% of its shares.
-
increasing the intrinsic value of your shares by 7X
-
not counting future earnings or dividend growth
AMP Long-Term Growth Outlook
-
8.0% to 13.6% growth consensus range (four sources)
-
the median consensus from all 14 analysts is 13.6%
-
the growth rate since the 2005 spin-off is 12.8% CAGR
-
Smoothing for outliers historical analyst margins-of-error are 15% to the downside and 10% to the upside
-
margin-of-error adjusted consensus growth range: 6% to 15% CAGR
-
70% statistical probability that AMP grows 6% to 15% over time
AMP has historically grown at low to mid-double-digits and analysts expect future growth similar to the last 16 years, since its 2005 spin-off.
Reason Four: Ameriprise Financial Is A Wonderful Company At A Wonderful Price
Since its spin-off, AMP has been valued by tens of millions of income growth investors at 12.75X to 13.5X earnings outside of bear markets and bubbles.
-
91% statistical probability the intrinsic value is within this range
|
Metric |
Historical Fair Value Multiples (15-year) |
2021 |
2022 |
2023 |
2024 |
12-Month Forward Fair Value |
|
Earnings |
13.11 |
$298.25 |
$329.59 |
$388.32 |
$428.70 |
|
|
Average |
$298.25 |
$329.59 |
$388.32 |
$428.70 |
$358.95 |
|
|
Current Price |
$247.23 |
|||||
|
Discount To Fair Value |
17.11% |
24.99% |
36.33% |
42.33% |
31.12% |
|
|
Upside To Fair Value (NOT Including Dividends) |
20.64% |
33.31% |
57.07% |
73.40% |
45.19% (47% including dividend) |
|
|
2022 EPS |
2023 EPS |
2022 Weighted EPS |
2023 Weighted EPS |
12-Month Forward EPS |
12-Month Average Fair Value Forward PE |
Current Forward PE |
|
$25.14 |
$29.62 |
$12.57 |
$14.81 |
$27.38 |
13.1 |
9.0 |
I estimate AMP is worth about 13.1X earnings and today it trades at 9.0X.
-
7.0X cash-adjusted earnings
-
an anti-bubble blue-chip bargain
-
even by Private Equity standards
|
Analyst Median 12-Month Price Target |
Morningstar Fair Value Estimate |
|
$328.30 (12.0X earnings) |
$338.00 (12.3X earnings) |
|
Discount To Price Target (Not A Fair Value Estimate) |
Discount To Fair Value |
|
24.69% |
26.86% |
|
Upside To Price Target (Not Including Dividend) |
Upside To Fair Value (Not Including Dividend) |
|
32.79% |
36.71% |
|
12-Month Median Total Return Price (Including Dividend) |
Fair Value + 12-Month Dividend |
|
$333.30 |
$343.00 |
|
Discount To Total Price Target (Not A Fair Value Estimate) |
Discount To Fair Value + 12-Month Dividend |
|
25.82% |
27.92% |
|
Upside To Price Target (Including Dividend) |
Upside To Fair Value + Dividend |
|
34.81% |
38.74% |
Morningstar’s DCF valuation model estimates AMP is worth 12.3X earnings, slightly below its historical market-determined fair value range.
-
but Morningstar still considers AMP a 4-star bargain
Analysts expect AMP’s PE to recover to 12 within a year.
-
a reasonable estimate given that a mild recession is looking more and more likely next year.
That’s a 35% consensus total return within a year.
I don’t make recommendations based on a 12-month price forecast but on whether or not a company’s margin of safety is sufficient to compensate you for its risk profile.
|
Rating |
Margin Of Safety For Low-Risk 13/13 Ultra SWAN quality companies |
2022 Price |
2023 Price |
12-Month Forward Fair Value |
|
Potentially Reasonable Buy |
0% |
$329.59 |
$388.32 |
$358.95 |
|
Potentially Good Buy |
5% |
$313.11 |
$368.90 |
$341.00 |
|
Potentially Strong Buy |
15% |
$280.15 |
$330.07 |
$305.11 |
|
Potentially Very Strong Buy |
25% |
$234.83 |
$291.24 |
$269.21 |
|
Potentially Ultra-Value Buy |
35% |
$214.23 |
$252.41 |
$233.32 |
|
Currently |
$247.23 |
24.99% |
36.33% |
31.12% |
|
Upside To Fair Value (Not Including Dividends) |
33.31% |
57.07% |
45.19% |
For anyone comfortable with its risk profile, AMP is a potentially very strong buy and not far from an Ultra Value buy.
Risk Profile: Why AMP Isn’t Right For Everyone
There are no risk-free companies, and no company is right for everyone. You have to be comfortable with the fundamental risk profile.
What Could Cause AMP’s Investment Thesis To Break
-
safety falls to 40% or less
-
balance sheet collapses (highly unlikely, 2.5% probability according to rating agencies)
-
growth outlook falls to less than 8% for seven years
-
AMP’s role in my portfolio is to deliver long-term 8+% returns with minimal fundamental risk
-
8+% total return requirement for defensive sectors
-
10+% for non-defensive (cyclical) sectors – like industrials
How long it takes for a company’s investment thesis to break depends on the quality of the company.
|
Quality |
Years For The Thesis To Break Entirely |
|
Below-Average |
1 |
|
Average |
2 |
|
Above-Average |
3 |
|
Blue-Chip |
4 |
|
SWAN |
5 |
|
Super SWAN |
6 |
|
Ultra SWAN |
7 |
|
100% Quality Companies (MSFT, LOW, and MA) |
8 |
These are my personal rule of thumb for when to sell a stock if the investment thesis has broken. AMP is highly unlikely to suffer such catastrophic declines in fundamentals.
Risk Profile Summary
“Because of the company’s high exposure to market movements, headwinds in the asset-management business, and regulations in wealth management, we assign a high uncertainty rating to our fair value estimate for Ameriprise.
Financial markets and economic conditions can have a significant impact on the operating results of Ameriprise’s insurance and asset-management segments. Market volatility, along with prolonged declines in asset values, can have a negative impact on flows in the asset-management business, as well as sales of annuities and insurance products.
While the company’s balance sheet is not as leveraged as some of the larger insurers, we still think an investment in Ameriprise carries a high level of uncertainty, given how sensitive its business is to the capital markets.
Shareholders’ equity can be stressed in times of substantial market volatility when investments are marked to distressed prices. Additionally, on the asset-management side, net asset flows are highly sensitive to fund performance and investors’ sentiment toward capital markets. Fee income in the asset-management business can be adversely affected in declining markets.
Ameriprise Financial has moderate exposure to environmental, social, and governance risks. Similar to other financial sector companies, the company has a relatively low environmental footprint.
Wealth management firms can often have product governance issues stemming from their trading operations, as there can be a conflict of interest between financial advisors and their clients, such as excessive trading to generate commissions. Regulatory fines and litigation expenses are a normal part of business that we generally incorporate into our valuation model.” – Morningstar
AMP’s Risk Profile Includes
-
economic/market cyclicality risk (fee income will be affected by AUM though less than many of its peers) 13% decline in earnings during the Pandemic crash
-
regulatory risk (including changes in capital requirements)
-
M&A execution risk (such as the large acquisition of BMO’s EMEA asset management business)
-
global expansion risk: AMP is branching out globally for the first time
-
disruption risk: giant rivals plus fintech (which is increasingly being acquired by fintech)
-
talent retention risk in the tightest job market in 50 years
-
currency risk: near-zero today but will be growing rapidly over time
How do we quantify, monitor, and track such a complex risk profile? By doing what big institutions do.
Long-Term Risk Analysis: How Large Institutions Measure Total Risk
-
see the risk section of this video to get an in-depth view (and link to two reports) of how DK and big institutions measure long-term risk management by companies
AMP Long-Term Risk-Management Consensus
|
Rating Agency |
Industry Percentile |
Rating Agency Classification |
|
MSCI 37 Metric Model |
63.0% |
A Above-Average, Positive Trend |
|
Morningstar/Sustainalytics 20 Metric Model |
75.6% |
22.7/100 Medium-Risk |
|
Reuters’/Refinitiv 500+ Metric Model |
98.2% |
Excellent |
|
S&P 1,000+ Metric Model |
35.0% |
Below-Average, Stable Trend |
|
Just Capital 19 Metric Model |
70.0% |
Good |
|
FactSet |
30.0% |
Below-Average, Positive Trend |
|
Morningstar Global Percentile (All 15,000 Rated Companies) |
66.1% |
Above-Average |
|
Just Capital Global Percentile (All 954 Rated US Companies) |
66.5% |
Above-Average |
|
Consensus |
63% |
Low-Risk, Above-Average Risk-Management, Stable Trend |
(Sources: MSCI, Morningstar, FactSet, S&P, Just Capital, Reuters)
AMP’s Long-Term Risk Management Is The 248th Best In The Master List (50th Percentile)
|
Classification |
Average Consensus LT Risk-Management Industry Percentile |
Risk-Management Rating |
|
S&P Global (SPGI) #1 Risk Management In The Master List |
94 |
Exceptional |
|
Strong ESG Stocks |
78 |
Good – Bordering On Very Good |
|
Foreign Dividend Stocks |
75 |
Good |
|
Ultra SWANs |
71 |
Good |
|
Low Volatility Stocks |
68 |
Above-Average |
|
Dividend Aristocrats |
67 |
Above-Average |
|
Dividend Kings |
63 |
Above-Average |
|
Ameriprise Financial |
63 |
Above-Average |
|
Master List average |
62 |
Above-Average |
|
Hyper-Growth stocks |
61 |
Above-Average |
|
Monthly Dividend Stocks |
60 |
Above-Average |
|
Dividend Champions |
57 |
Average |
(Source: DK Research Terminal)
AMP’s risk-management consensus is in the top 50% of the world’s highest quality companies and similar to that of such other blue-chips as
-
Consolidated Edison (ED) – dividend aristocrat
-
Brown-Forman (BF.B) – dividend aristocrat
-
Procter & Gamble (PG) – dividend king
-
Emerson Electric (EMR) – dividend king
-
Illinois Tool Works (ITW) – dividend king
-
Medtronic (MDT) – dividend aristocrat
-
Coca-Cola (KO) – dividend king
-
NIKE (NKE)
-
Enterprise Products Partners (uses K-1 tax form) (EPD)
-
Alphabet (GOOG)
The bottom line is that all companies have risks, and AMP is above-average at managing theirs.
How We Monitor AMP’s Risk Profile
-
14 analysts
-
4 credit rating agencies
-
9 total risk rating agencies
-
23 experts who collectively know this business better than anyone other than management
“When the facts change, I change my mind. What do you do sir?” – John Maynard Keynes
There are no sacred cows at iREIT or Dividend Kings. Wherever the fundamentals lead we always follow. That’s the essence of disciplined financial science, the math behind retiring rich and staying rich in retirement.
Bottom Line: Ameriprise Is One Of The Best Anti-Bubble Blue-Chips You’ve Never Heard Of
Don’t get me wrong, I’m not saying AMP can’t fall further into a bear market.
|
Time Frame |
Historically Average Bear Market Bottom |
|
Non-Recessionary Bear Markets Since 1965 |
-21% (Achieved May 20th) |
|
Median Recessionary Bear Market Since WWII |
-24% (Citigroup base case with a mild recession) June 16th |
|
Non-Recessionary Bear Markets Since 1928 |
-26% (Goldman Sachs base case with a mild recession) |
|
Average Bear Markets Since WWII |
-30% (Morgan Stanley base case) |
|
Recessionary Bear Markets Since 1965 |
-36% (Bank of America recessionary base case) |
|
All 140 Bear Markets Since 1792 |
-37% |
|
Average Recessionary Bear Market Since 1928 |
-40% (Deutsche Bank, Bridgewater, SocGen Severe Recessionary base case, Morgan Stanley Recessionary Base Case) |
|
(Sources: Ben Carlson, Bank of America, Oxford Economics, Goldman Sachs) |
Deutsche Bank, Bridgewater, Societe Generale, Bank of America, and Morgan Stanley all think the market might end up falling 40% if we slip into recession next year.
Why? It’s simple math. The average historical recessionary bear market trough PE is 13 to 15, and the average S&P EPS decline during a recession is -15%.
-
$249 per share EPS consensus for S&P 500 right now
-
-15% = $212 X 13 to 15 trough PE = 2,756 to 3,180
-
2,968 mid-range = about 3,000 (-40% peak decline)
-
the consensus recessionary bear market consensus among the most accurate economist teams (the blue-chip consensus)
But Wall Street doesn’t run on certainties, only probabilities.
If we avoid a recession, then the market might be very close to a bottom. And remember it’s a market of stocks, not a stock market, and stocks will bottom at different times.
For example, in the Great Recession Altria (MO), bottomed in November 2008, while stocks kept falling for another four months.
In the tech crash, Amazon (AMZN) bottomed in January 2002, a full 10 months before the rest of the market.
And while I can’t tell you when the market or AMP will bottom, here’s what I can say with high confidence.
Stocks don’t stop falling because bad news stops coming but when the bad news is fully priced in.
-
AMP is one of the world’s safest, most dependable, and highest quality companies on earth
-
top 16% of the world’s best companies
-
2.0% very safe yield
-
close to 10% real risk-adjusted expected income growth over time, 5X that of the S&P 500
-
15.6% CAGR long-term total return potential
-
31% discount to fair value = potential Ultra Value strong buy
-
7.0X cash-adjusted earnings anti-bubble blue-chip
-
about 160% consensus return potential over the next five years, 19% CAGR, 2.5X more than the S&P 500
-
about 2X better risk-adjusted expected returns of the S&P 500 over the next five years
If you want to earn Buffett-like returns over time from blue-chip bargains hiding in plain sight, consider Ameriprise Financial.
If you want to own one of the world’s best fast-growing blue-chips, consider Ameriprise Financial.
If you want to take charge of your financial destiny and make your own luck on Wall Street, consider Ameriprise Financial.
If you’re tired of the “Wall Street casino”, then maybe it’s time to stop speculating and start long-term investing in your future.
Because when you make smart decisions in bear markets, great things happen.
“Fortunes are made in bear markets.” – Todd Sullivan
And while there is a lot of uncertainty in today’s market, the quality, dependability, and attractive valuation of this A-rated anti-bubble Ultra SWAN isn’t one of them.
Be the first to comment