

carebott/E+ via Getty Images
In January, I predicted Single Family Rental (SFR) REITs would outperform the REIT average this year. That has proved true thus far, but just barely. According to Hoya Capital Income Builder, SFRs have averaged a total return of (-15.38)% YTD, compared to the Equity REIT Index return of (-17.41)%.
Hoya Capital Income Builder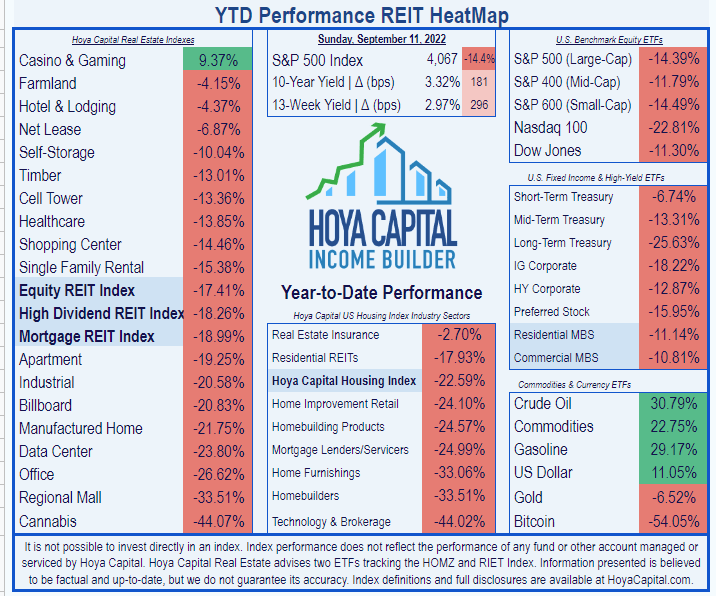
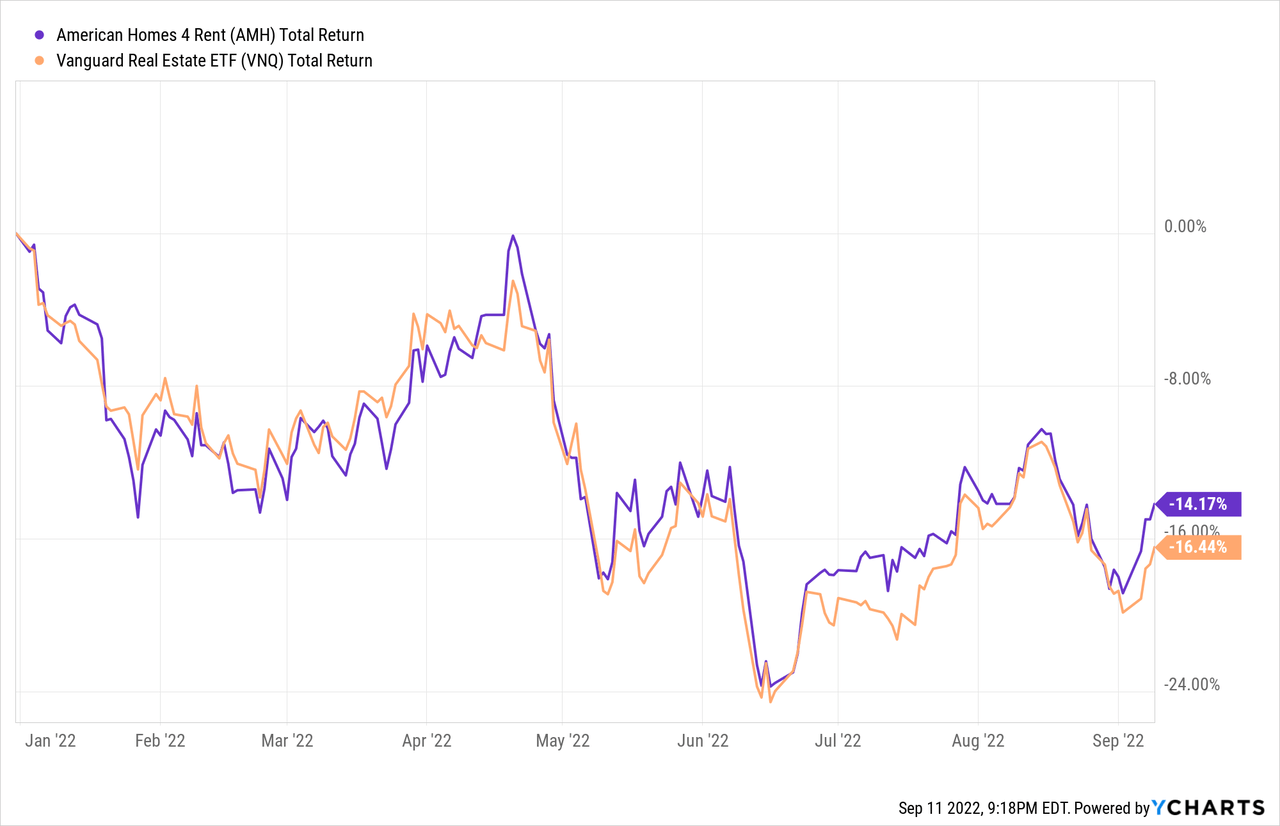
Accordingly, in February I chose American Homes 4 Rent (NYSE:AMH) as one of the Top 12 REITs for the succeeding 12 months. That has not panned out. Although AMH is up about 10% from its June low, and has slightly outperformed the VNQ, as shown in the chart below, there are no fewer than 25 REITs that have posted positive total returns YTD, while AMH has returned (-14.17)%.
Going forward, however, the tailwinds still look favorable for Single Family Rental REITs. As Hoya Capital writes in its recent Sector Report on SFRs:
Single Family Rental (“SFR”) REITs have been beneficiaries of surging mortgage rates, which made renting single-family homes a relative bargain.
Indeed, according to Hoya’s research, the nationwide average mortgage payment on a starter home is $839 a month higher than the average monthly rent.
Hoya Capital Income Builder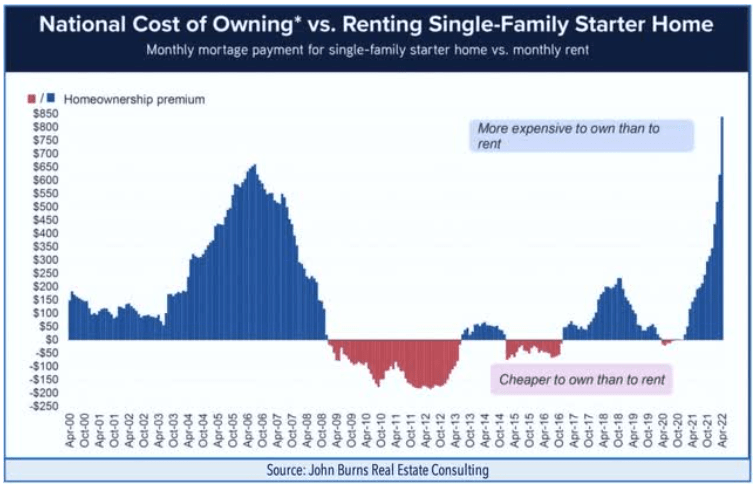
Another factor playing in favor of SFRs is the significant leasing spreads caused by the housing shortage and higher interest rates.
Single-family rents rose at the fastest pace on record through mid-2022, an elevated pace that has staying-power given the significant ’embedded’ rent growth resulting from below-market renewal offers.
Hoya Capital Income Builder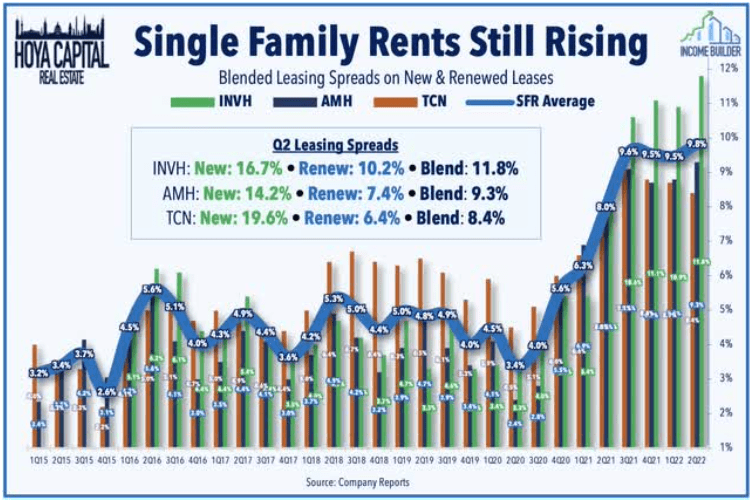
The Sunbelt continues to lead the way in economic growth and rent increase rates. Of the hottest 15 rental-increase markets in the U.S., 13 are in the southern half of the country. Three of the top four are in Florida.
Hoya Capital Income Builder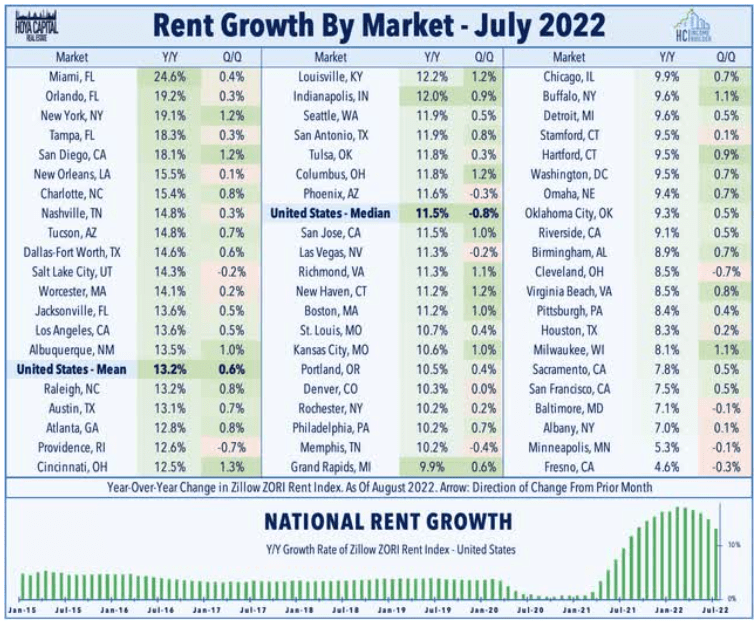
Meet the Company
American Homes 4 Rent
Based in Calabasas, California, AMH owns over 58,715 homes, according to their Q2 2022 10-Q. These are spread across 37 U.S. markets in 22 states, with a high concentration in desirable neighborhoods in the Sunbelt, enjoying a 97.4% occupancy rate. The average AMH home is 17 years old, about 2000 square feet in size, and rents for $1901 per month.
Company 8-K as of September 12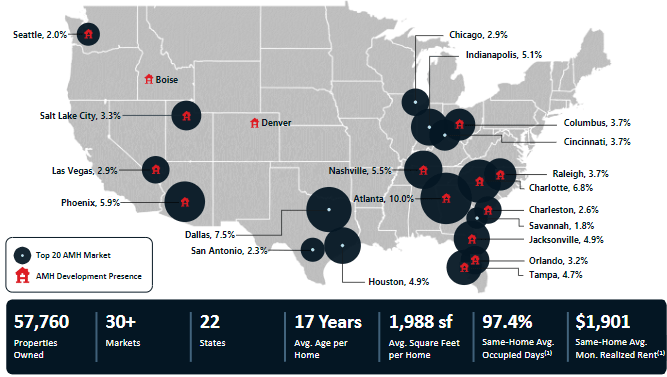
The company’s strongest concentrations of assets are in Atlanta, Dallas-Fort Worth, Charlotte, and Phoenix, but these four locales account for only 28.8% of the portfolio’s gross book value, and 30.2% of total properties.
Company 10-Q for Q2 2022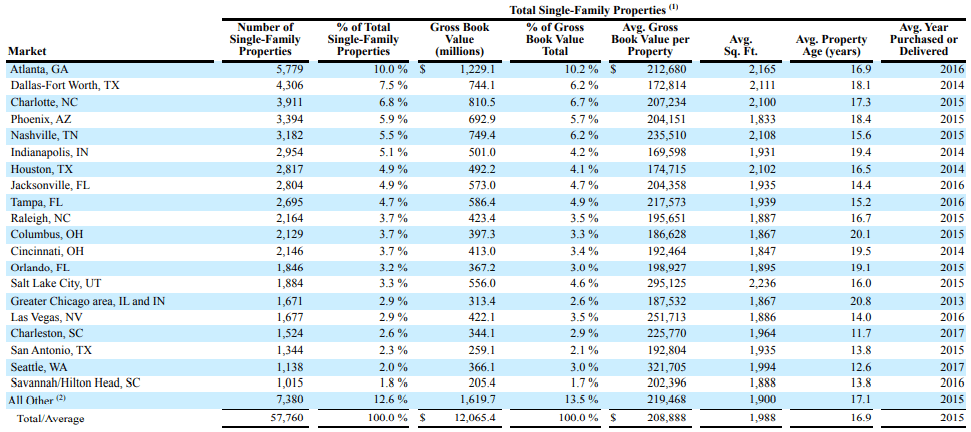
AMH grows in three ways:
- Development of build-to-rent housing communities, in which AMH is far and away the leader,
- Networking with builders to acquire newly constructed homes, and
- In-market acquisition teams that identify homes that come onto the market in areas where AMH already has a relatively high concentration.
Further details on how the company operates can be found in this previous article, published in February.
Of the three SFR REITs, AMH is the only one that builds its own units from the ground up, and such activity accounts for about half of AMH acquisitions. Thus, this company is contributing to resolving the housing shortage.
Hoya Capital Income Builder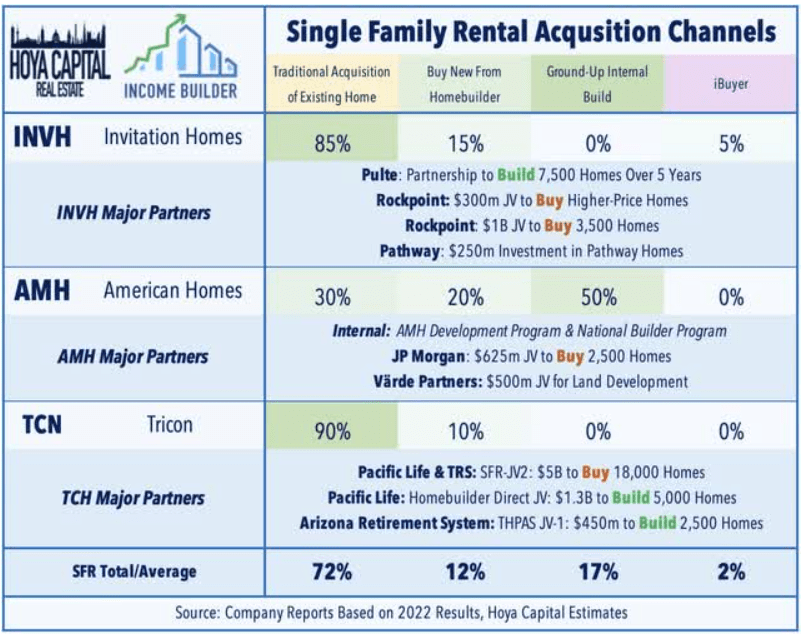
AMH leasing spreads are averaging a healthy 12.9% on new leases, and 8.2% on renewals, for a blended spread of 9.6%.
Company 8-K as of September 12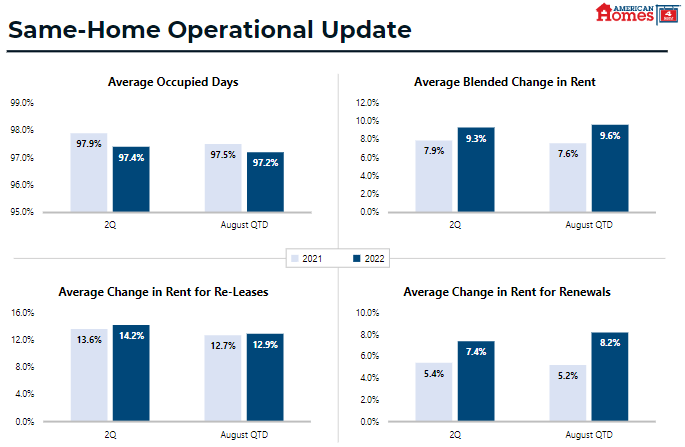
Housing continues to be in short supply, with the existing home inventory about 50% below its long-term average, and single-family permit levels down from a year ago. This adds up to a favorable situation for SFR landlords.
Company 8-K as of September 12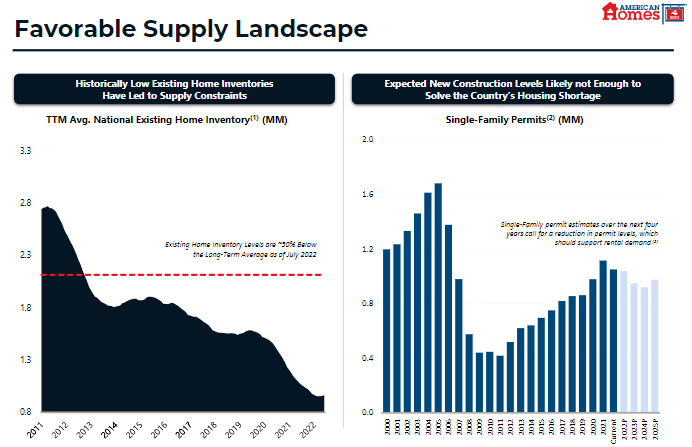
Further enhancing SFR prospects, it is currently about 20% cheaper to rent a home than to own one, and the Millennial cohort, particularly over the coming 3 years, is coming into the 35-49 age range where people typically transition into single family dwellings.
Company 8-K as of September 12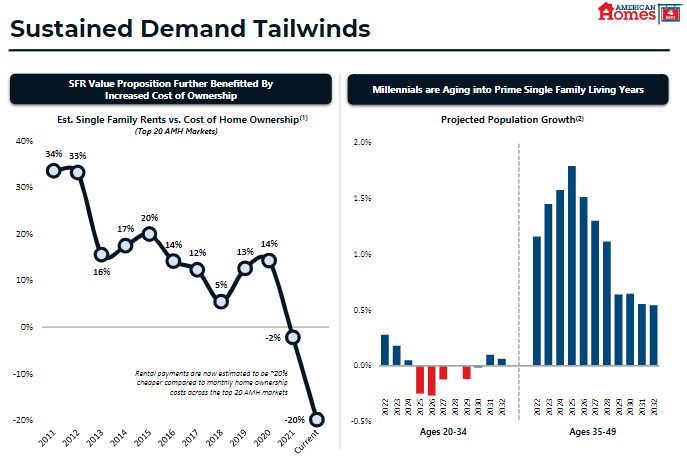
Net migration trends continue to benefit AMH, as Americans move from big cities on the coasts to secondary markets in the Sunbelt. AMH is conducting more than double the showings per property, compared to pre-pandemic levels, and handling more than half of inbound inquiries digitally.
Company 8-K as of September 12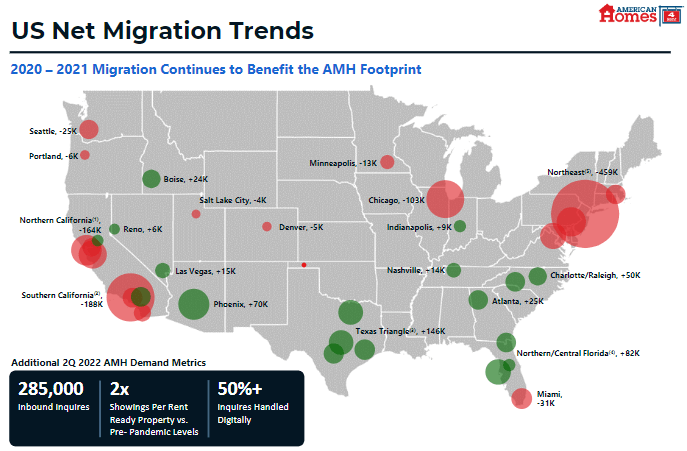
As Ross Bowler notes in a previous article, American Homes 4 Rent has shown a knack for being ahead of these patterns, and building a presence in these markets even before the change occurs.
All three SFR REITs are concentrated more in the Sunbelt than anywhere else in the country. Of AMH’s total portfolio, 80% is located in the Sunbelt, with 2% in Seattle and 18% in the Midwest.
Hoya Capital Income Builder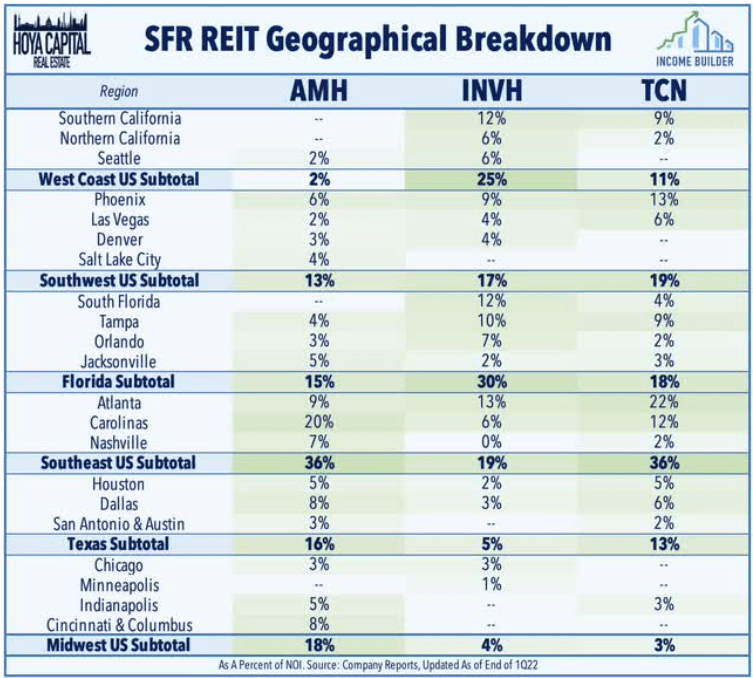
Quarterly results
AMH reported Q2 results for 2022 on August 5. Here are the healthy highlights:
- Revenues of $362 million, up 15.4% YoY (year over year).
- Expenses of $324 million, up 18.4% YoY.
- Net income of $74.6 million, up 43.9% YoY.
- An increase of 8.8% in shares outstanding YoY.
- Net income per share of $0.16, up 167% YoY.
- Assets of $11.8 billion, versus liabilities totaling $4.9 billion.
- Same-property core NOI of $174 million, up 10.2% YoY.
- Core FFO of $153 million, up 24.8% YoY.
- EBITDA of $214 million, up 25.4% YoY.
For the first half of 2022:
- Revenues of $718 million, up 14.7% YoY.
- Expenses of $634 million, up 14.5% YoY.
- Net income of $145 million, up 43.5% YoY.
- Net income per share of $0.32 up 100% YoY.
- Net cash from operations of $379 million, up 14.2% YoY.
- Same-property core NOI of $349 million, up 10.7% YoY
- Core FFO of $303 million, up 26.8% YoY
- EBITDA of $411 million, up 21.9% YoY
In short, everything is up double digits, across the board. The company guided for full-year Core FFO per share of $1.56, core NOI growth of 10.0%, and $700 million in total acquisitions.
Growth metrics
Here are the sizzling 3-year growth figures for FFO (funds from operations) and TCFO (total cash from operations).
| Metric | 2019 | 2020 | 2021 | 2022* | 3-year CAGR |
| FFO (millions) | $384 | $397 | $471 | $606 | — |
| FFO Growth % | — | 3.4 | 18.6 | 28.7 | 16.4% |
| FFO per share | $1.11 | $1.16 | $1.36 | $1.56 | — |
| FFO per share growth % | — | 4.5 | 17.2 | 14.7 | 12.0% |
| TCFO (millions) | $458 | $474 | $595 | $758 | — |
| TCFO Growth % | — | 3.5 | 25.5 | 27.4 | 18.3% |
*Projected, based on H1 2022 results
Source: TD Ameritrade, CompaniesMarketCap.com, and author calculations
The 3-year growth figures for revenue and cash flow are all double digits, and even in the pandemic year of 2020, AMH kept growing.
AMH has slightly outgained its larger competitor Invitation Homes (INVH) in FFO growth per share and total return over the past 3 years.
Company 8-K for September 12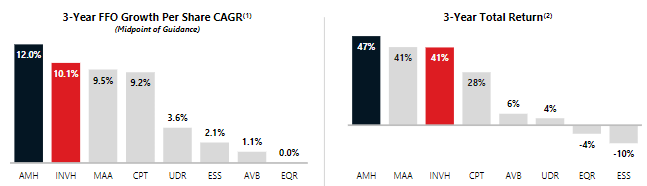
Meanwhile, here is how the stock price has done over the past 3 twelve-month periods, compared to the REIT average as represented by the Vanguard Real Estate ETF (VNQ).
| Metric | 2019 | 2020 | 2021 | 2022 | 3-yr CAGR |
| AMH share price September 12 | $24.60 | $28.70 | $40.61 | $37.42 | — |
| AMH share price Gain % | — | 16.7 | 41.5 | (-7.9) | 15.0% |
| VNQ share price September 12 | $92.63 | $80.25 | $106.40 | $96.74 | — |
| VNQ share price Gain % | — | (-13.4) | 32.6 | (-9.1) | 1.5% |
Source: MarketWatch.com and author calculations
Despite this year’s sell-off, AMH has rewarded investors with an average of 15% in share price gain alone, compared to the piddling 1.5% gain in VNQ shares.
The current market cap for AMH is $12.8 billion, up from $7.8 billion on September 29, 2019, an annual growth rate of 17.95%. It currently sits just above the market cap sweet spot, which is the second-best place to be.
Balance sheet metrics
AMH has a stellar balance sheet, with better liquidity, lower debt ratio, and lower Debt/EBITDA than both the SFR sector average and the overall REIT average. Combined with the double-digit growth rates in FFO and TCFO, this qualifies AMH as a bona fide FROG.
| Company | Liquidity Ratio | Debt Ratio | Debt/EBITDA | Bond Rating |
| AMH | 2.42 | 20% | 6.2 | BBB |
Source: Hoya Capital Income Builder, TD Ameritrade, and author calculations
The company has $1.8 billion in liquidity, and no significant debt maturities over the next 5 years, except for a $951 million payment that comes due in 2024. This is an enviable position.
Company 8-K as of September 12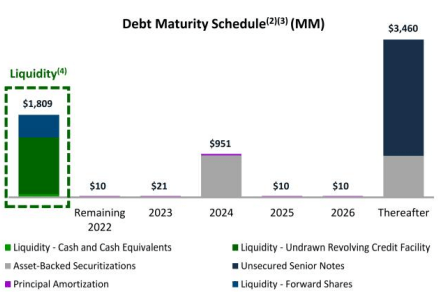
Of the company’s $4.4 billion debt, $1.9 billion (43%) is secured by assets and the remainder (57%) is unsecured.
Company 10-Q for Q2 2022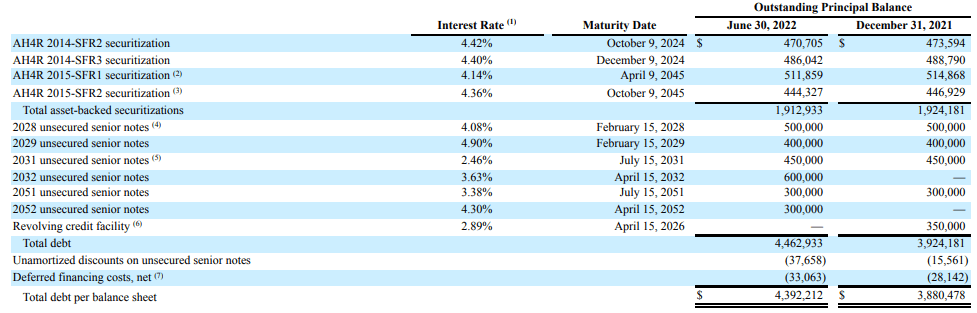
According to my trusty calculator, based on the figures in the chart above, AMH’s debt carries a weighted average interest rate of 4.00%.
Dividend metrics
AMH’s current dividend yield of just 1.92% lags both the overall REIT average and the low-yielding SFR sector average. The dividend, if anything, is too safe at A+. However, when you take its scorching rate of dividend increases into account, AMH earns a superb 6.92 on the Dividend Score.
| Company | Div. Yield | 3-yr Div. Growth | Div. Score | Payout | Div. Safety |
| AMH | 1.92 | 53.3% | 6.92 | 50% | A+ |
Source: Hoya Capital Income Builder, TD Ameritrade, Seeking Alpha Premium
Dividend Score projects the Yield three years from now, on shares bought today, assuming the Dividend Growth rate remains unchanged. This strongly suggests that three years from now, shares of AMH bought today will be outyielding the average REIT on cost, making this company a superior long-term income play.
Valuation metrics
This kind of growth in FFO, cash, and dividends usually comes at a premium price, and while AMH’s price/FFO is somewhat above the REIT average, it is not stratospheric, by any means. Meanwhile, the price represents a nice 12.8% discount to NAV.
| Company | Div. Score | Price/FFO ’22 | Premium to NAV |
| AMH | 6.92 | 23.3 | (-12.8)% |
Source: Hoya Capital Income Builder, TD Ameritrade, and author calculations
What could go wrong?
Because AMH relies so heavily on building their own houses:
- supply chain disruptions
- inflationary increases in labor and material costs
- labor shortages
may impact bottom line results.
Competition from other companies in this sector is of negligible importance, since only about 2% of nationwide inventory is owned by institutions, and the geographic focus of the three REITs is markedly different. SFRs do compete for acquisitions in some markets, but only AMH builds new homes.
Investor’s bottom line
So what does a company do when they are flush with cash and growing like a weed, but unloved by the market? Raise the dividend, of course. AMH is a champion when it comes to dividend growth, and there is every reason to expect that will continue. For investors with at least a 3-year horizon, I rate AMH a Buy. For short-term traders, I would call it a Hold.
Seeking Alpha Premium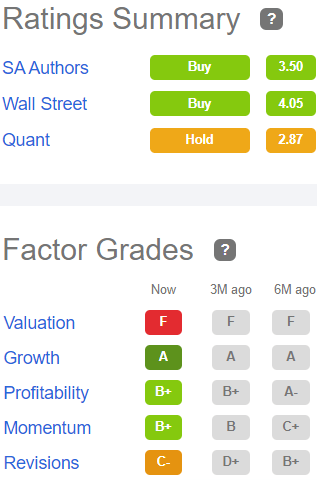
Of the Wall Street analysts covering AMH, 13 rate the company a Buy or Strong Buy, as do TipRanks and The Street. Meanwhile 7 rate it a Hold, as do the Seeking Alpha Quant Ratings, Ford Equity Research, and Zacks. But the opinion that really counts is yours.
Be the first to comment